Air Pollution in Liaogong: Real-time Air Quality Index and smog alert.
Pollution and air quality forecast for Liaogong. Today is Tuesday, June 16, 2026. The following air pollution values have been recorded for Liaogong:- particulate matter (PM10) suspended dust - 7 (Good)
- particulate matter (PM2.5) dust - 2 (Good)
- carbon monoxide (CO) - 100 (Good)
- nitrogen dioxide (NO2) - 8 (Good)
- ozone (O3) - 0 (Good)
- sulfur dioxide (SO2) - 9 (Good)

What is the air quality in Liaogong today? Is the air polluted in Liaogong?. Is there smog?
What is the level of PM10 today in Liaogong? (particulate matter (PM10) suspended dust)
The current level of particulate matter PM10 in Liaogong is:
7 (Good)
The highest PM10 values usually occur in month: 120 (March 2019).
The lowest value of particulate matter PM10 pollution in Liaogong is usually recorded in: August (31).
What is the current level of PM2.5 in Liaogong? (particulate matter (PM2.5) dust)
Today's PM2.5 level is:
2 (Good)
For comparison, the highest level of PM2.5 in Liaogong in the last 7 days was: 24 (Friday, May 27, 2022) and the lowest: 24 (Friday, May 27, 2022).
The highest PM2.5 values were recorded: 96 (January 2020).
The lowest level of particulate matter PM2.5 pollution occurs in month: August (17).
How high is the CO level? (carbon monoxide (CO))
100 (Good)
How high is the level of NO2? (nitrogen dioxide (NO2))
8 (Good)
How is the O3 level today in Liaogong? (ozone (O3))
0 (Good)
What is the level of SO2 pollution? (sulfur dioxide (SO2))
9 (Good)
Current data Friday, May 27, 2022, 12:00 PM
PM10 7 (Good)
PM2,5 2 (Good)
CO 100 (Good)
NO2 8 (Good)
O3 0 (Good)
SO2 9 (Good)
Data on air pollution from recent days in Liaogong
index
2022-05-27
pm10
32
Moderate
pm25
24
Moderate
co
468
Good
no2
21
Good
o3
32
Good
so2
5
Good
data source »
Air pollution in Liaogong from October 2018 to May 2020

index
2020-05
2020-04
2020-03
2020-02
2020-01
2019-12
2019-11
2019-10
2019-09
2019-08
2019-07
2019-06
2019-05
2019-04
2019-03
2019-02
2019-01
2018-12
2018-11
2018-10
pm25
36 (Unhealthy for Sensitive Groups)
39 (Unhealthy for Sensitive Groups)
38 (Unhealthy for Sensitive Groups)
58 (Unhealthy)
96 (Very Unhealthy)
69 (Unhealthy)
45 (Unhealthy for Sensitive Groups)
45 (Unhealthy for Sensitive Groups)
36 (Unhealthy for Sensitive Groups)
17 (Moderate)
30 (Moderate)
33 (Moderate)
36 (Unhealthy for Sensitive Groups)
40 (Unhealthy for Sensitive Groups)
89 (Very Unhealthy)
53 (Unhealthy for Sensitive Groups)
70 (Unhealthy)
41 (Unhealthy for Sensitive Groups)
65 (Unhealthy)
45 (Unhealthy for Sensitive Groups)
co
786 (Good)
706 (Good)
772 (Good)
1 (Good)
1 (Good)
1 (Good)
1 (Good)
1 (Good)
903 (Good)
681 (Good)
800 (Good)
626 (Good)
723 (Good)
643 (Good)
1 (Good)
1 (Good)
1 (Good)
1 (Good)
1 (Good)
1 (Good)
no2
24 (Good)
23 (Good)
24 (Good)
24 (Good)
41 (Moderate)
40 (Good)
35 (Good)
35 (Good)
28 (Good)
16 (Good)
16 (Good)
18 (Good)
25 (Good)
28 (Good)
50 (Moderate)
37 (Good)
50 (Moderate)
34 (Good)
45 (Moderate)
40 (Moderate)
o3
125 (Unhealthy for Sensitive Groups)
115 (Moderate)
86 (Moderate)
74 (Moderate)
67 (Good)
57 (Good)
60 (Good)
90 (Moderate)
140 (Unhealthy for Sensitive Groups)
107 (Moderate)
157 (Unhealthy)
145 (Unhealthy for Sensitive Groups)
151 (Unhealthy)
124 (Unhealthy for Sensitive Groups)
84 (Moderate)
66 (Good)
63 (Good)
60 (Good)
69 (Good)
85 (Moderate)
pm10
58 (Unhealthy for Sensitive Groups)
74 (Unhealthy for Sensitive Groups)
61 (Unhealthy for Sensitive Groups)
67 (Unhealthy for Sensitive Groups)
111 (Very Unhealthy)
86 (Unhealthy)
71 (Unhealthy for Sensitive Groups)
73 (Unhealthy for Sensitive Groups)
57 (Unhealthy for Sensitive Groups)
31 (Moderate)
50 (Unhealthy for Sensitive Groups)
43 (Moderate)
66 (Unhealthy for Sensitive Groups)
79 (Unhealthy for Sensitive Groups)
120 (Very Unhealthy)
79 (Unhealthy for Sensitive Groups)
106 (Unhealthy)
67 (Unhealthy for Sensitive Groups)
106 (Unhealthy)
80 (Unhealthy)
so2
16 (Good)
17 (Good)
30 (Good)
39 (Good)
62 (Moderate)
65 (Moderate)
46 (Good)
19 (Good)
17 (Good)
11 (Good)
11 (Good)
16 (Good)
21 (Good)
19 (Good)
50 (Moderate)
62 (Moderate)
75 (Moderate)
61 (Moderate)
54 (Moderate)
22 (Good)
data source »
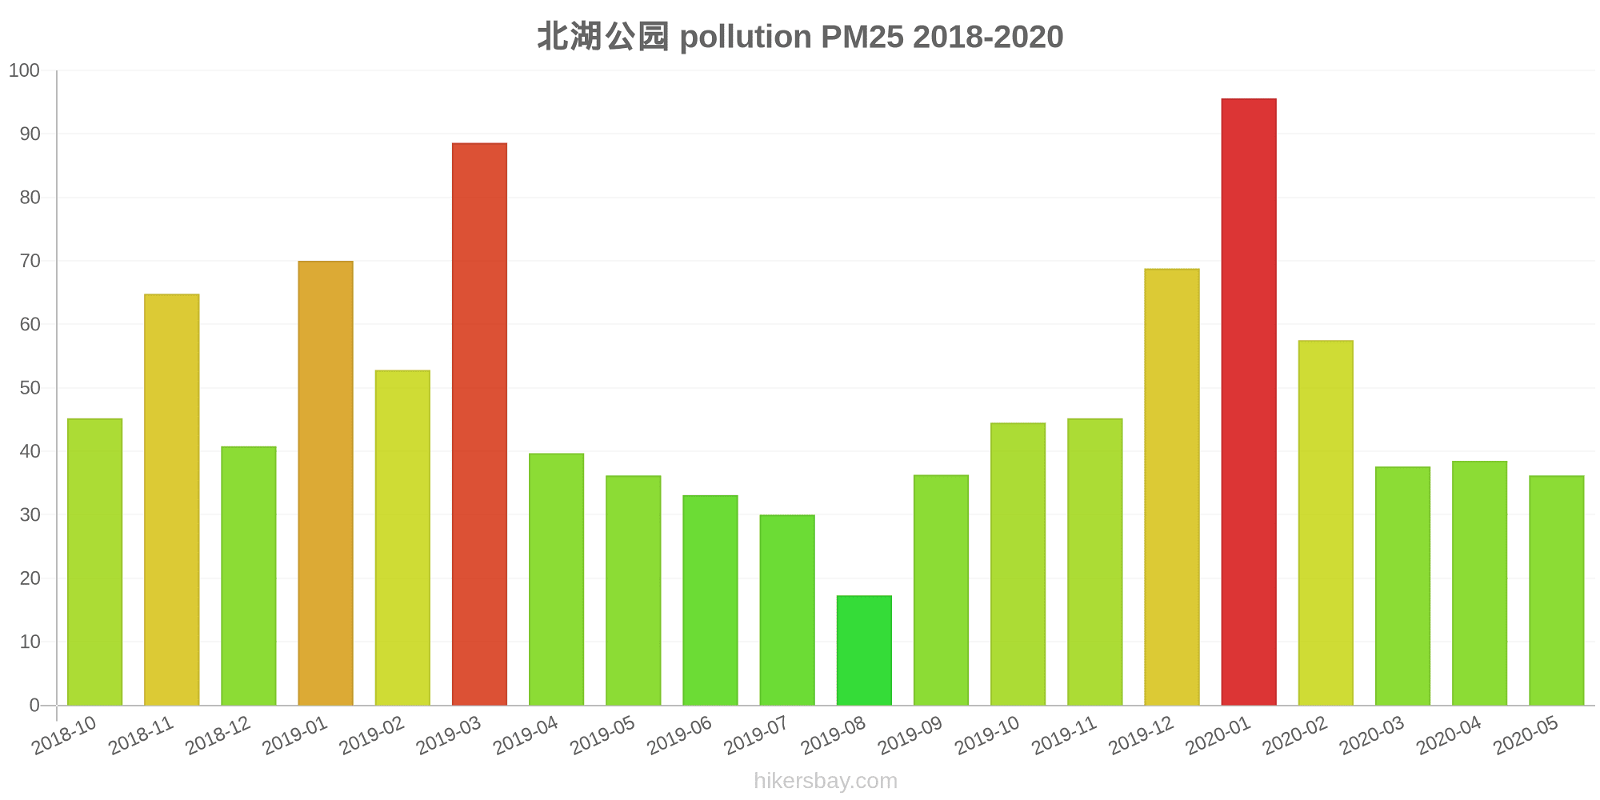
北湖公园
Friday, May 27, 2022, 12:00 PM
PM10 6.7 (Good)
particulate matter (PM10) suspended dust
PM2,5 1.7 (Good)
particulate matter (PM2.5) dust
CO 100 (Good)
carbon monoxide (CO)
NO2 7.6 (Good)
nitrogen dioxide (NO2)
O3 0.02 (Good)
ozone (O3)
SO2 8.6 (Good)
sulfur dioxide (SO2)
北湖公园
index
2022-05-27
pm10
32
pm25
24
co
468
no2
21
o3
32
so2
4.6
北湖公园
2018-10 2020-05
index
2020-05
2020-04
2020-03
2020-02
2020-01
2019-12
2019-11
2019-10
2019-09
2019-08
2019-07
2019-06
2019-05
2019-04
2019-03
2019-02
2019-01
2018-12
2018-11
2018-10
pm25
36
39
38
58
96
69
45
45
36
17
30
33
36
40
89
53
70
41
65
45
co
786
706
772
1
1
1
1
1
903
681
800
626
723
643
1
1
1
1
1
1
no2
24
23
24
24
41
40
35
35
28
16
16
18
25
28
50
37
50
34
45
40
o3
125
115
86
74
67
57
60
90
140
107
157
145
151
124
84
66
63
60
69
85
pm10
58
74
61
67
111
86
71
73
57
31
50
43
66
79
120
79
106
67
106
80
so2
16
17
30
39
62
65
46
19
17
11
11
16
21
19
50
62
75
61
54
22
* Pollution data source:
https://openaq.org
(ChinaAQIData)
The data is licensed under CC-By 4.0
PM10 7 (Good)
PM2,5 2 (Good)
CO 100 (Good)
NO2 8 (Good)
O3 0 (Good)
SO2 9 (Good)
Data on air pollution from recent days in Liaogong
| index | 2022-05-27 |
|---|---|
| pm10 | 32 Moderate |
| pm25 | 24 Moderate |
| co | 468 Good |
| no2 | 21 Good |
| o3 | 32 Good |
| so2 | 5 Good |
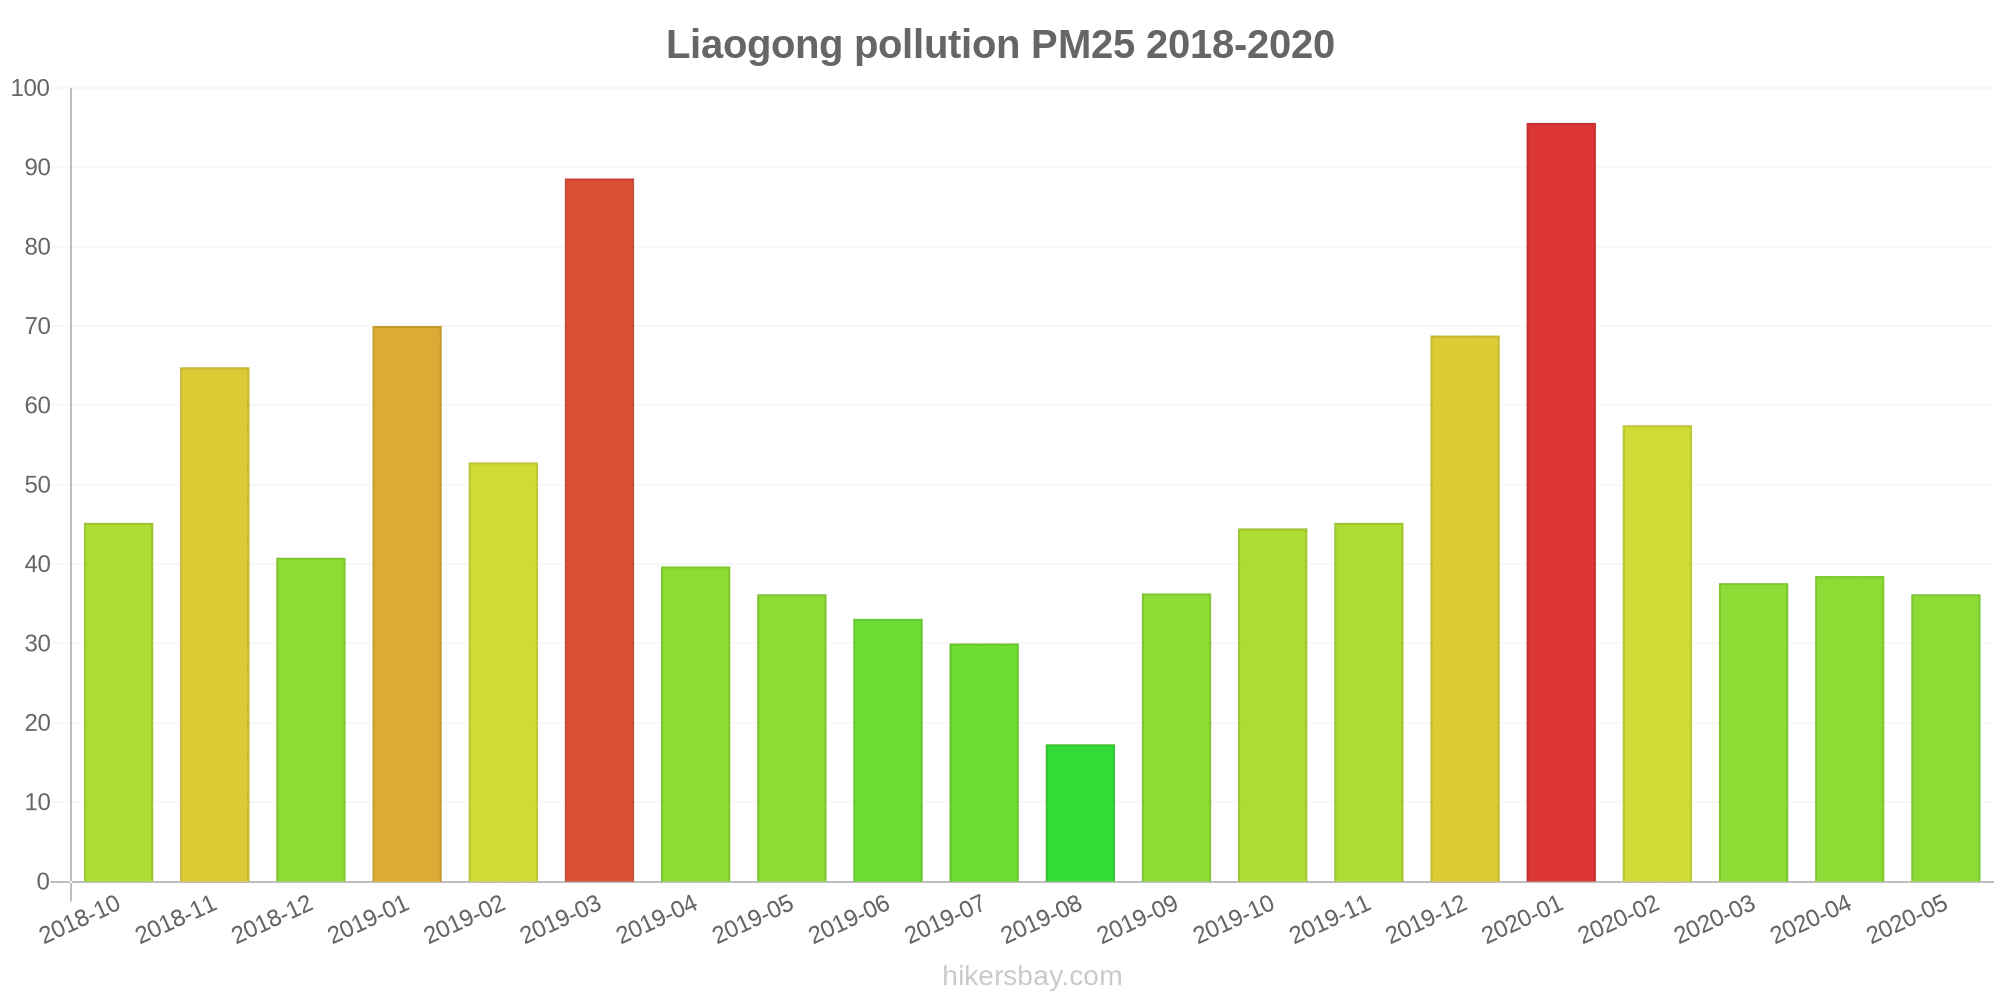
| index | 2020-05 | 2020-04 | 2020-03 | 2020-02 | 2020-01 | 2019-12 | 2019-11 | 2019-10 | 2019-09 | 2019-08 | 2019-07 | 2019-06 | 2019-05 | 2019-04 | 2019-03 | 2019-02 | 2019-01 | 2018-12 | 2018-11 | 2018-10 |
|---|---|---|---|---|---|---|---|---|---|---|---|---|---|---|---|---|---|---|---|---|
| pm25 | 36 (Unhealthy for Sensitive Groups) | 39 (Unhealthy for Sensitive Groups) | 38 (Unhealthy for Sensitive Groups) | 58 (Unhealthy) | 96 (Very Unhealthy) | 69 (Unhealthy) | 45 (Unhealthy for Sensitive Groups) | 45 (Unhealthy for Sensitive Groups) | 36 (Unhealthy for Sensitive Groups) | 17 (Moderate) | 30 (Moderate) | 33 (Moderate) | 36 (Unhealthy for Sensitive Groups) | 40 (Unhealthy for Sensitive Groups) | 89 (Very Unhealthy) | 53 (Unhealthy for Sensitive Groups) | 70 (Unhealthy) | 41 (Unhealthy for Sensitive Groups) | 65 (Unhealthy) | 45 (Unhealthy for Sensitive Groups) |
| co | 786 (Good) | 706 (Good) | 772 (Good) | 1 (Good) | 1 (Good) | 1 (Good) | 1 (Good) | 1 (Good) | 903 (Good) | 681 (Good) | 800 (Good) | 626 (Good) | 723 (Good) | 643 (Good) | 1 (Good) | 1 (Good) | 1 (Good) | 1 (Good) | 1 (Good) | 1 (Good) |
| no2 | 24 (Good) | 23 (Good) | 24 (Good) | 24 (Good) | 41 (Moderate) | 40 (Good) | 35 (Good) | 35 (Good) | 28 (Good) | 16 (Good) | 16 (Good) | 18 (Good) | 25 (Good) | 28 (Good) | 50 (Moderate) | 37 (Good) | 50 (Moderate) | 34 (Good) | 45 (Moderate) | 40 (Moderate) |
| o3 | 125 (Unhealthy for Sensitive Groups) | 115 (Moderate) | 86 (Moderate) | 74 (Moderate) | 67 (Good) | 57 (Good) | 60 (Good) | 90 (Moderate) | 140 (Unhealthy for Sensitive Groups) | 107 (Moderate) | 157 (Unhealthy) | 145 (Unhealthy for Sensitive Groups) | 151 (Unhealthy) | 124 (Unhealthy for Sensitive Groups) | 84 (Moderate) | 66 (Good) | 63 (Good) | 60 (Good) | 69 (Good) | 85 (Moderate) |
| pm10 | 58 (Unhealthy for Sensitive Groups) | 74 (Unhealthy for Sensitive Groups) | 61 (Unhealthy for Sensitive Groups) | 67 (Unhealthy for Sensitive Groups) | 111 (Very Unhealthy) | 86 (Unhealthy) | 71 (Unhealthy for Sensitive Groups) | 73 (Unhealthy for Sensitive Groups) | 57 (Unhealthy for Sensitive Groups) | 31 (Moderate) | 50 (Unhealthy for Sensitive Groups) | 43 (Moderate) | 66 (Unhealthy for Sensitive Groups) | 79 (Unhealthy for Sensitive Groups) | 120 (Very Unhealthy) | 79 (Unhealthy for Sensitive Groups) | 106 (Unhealthy) | 67 (Unhealthy for Sensitive Groups) | 106 (Unhealthy) | 80 (Unhealthy) |
| so2 | 16 (Good) | 17 (Good) | 30 (Good) | 39 (Good) | 62 (Moderate) | 65 (Moderate) | 46 (Good) | 19 (Good) | 17 (Good) | 11 (Good) | 11 (Good) | 16 (Good) | 21 (Good) | 19 (Good) | 50 (Moderate) | 62 (Moderate) | 75 (Moderate) | 61 (Moderate) | 54 (Moderate) | 22 (Good) |
PM10 6.7 (Good)
particulate matter (PM10) suspended dustPM2,5 1.7 (Good)
particulate matter (PM2.5) dustCO 100 (Good)
carbon monoxide (CO)NO2 7.6 (Good)
nitrogen dioxide (NO2)O3 0.02 (Good)
ozone (O3)SO2 8.6 (Good)
sulfur dioxide (SO2)北湖公园
| index | 2022-05-27 |
|---|---|
| pm10 | 32 |
| pm25 | 24 |
| co | 468 |
| no2 | 21 |
| o3 | 32 |
| so2 | 4.6 |
北湖公园

| index | 2020-05 | 2020-04 | 2020-03 | 2020-02 | 2020-01 | 2019-12 | 2019-11 | 2019-10 | 2019-09 | 2019-08 | 2019-07 | 2019-06 | 2019-05 | 2019-04 | 2019-03 | 2019-02 | 2019-01 | 2018-12 | 2018-11 | 2018-10 |
|---|---|---|---|---|---|---|---|---|---|---|---|---|---|---|---|---|---|---|---|---|
| pm25 | 36 | 39 | 38 | 58 | 96 | 69 | 45 | 45 | 36 | 17 | 30 | 33 | 36 | 40 | 89 | 53 | 70 | 41 | 65 | 45 |
| co | 786 | 706 | 772 | 1 | 1 | 1 | 1 | 1 | 903 | 681 | 800 | 626 | 723 | 643 | 1 | 1 | 1 | 1 | 1 | 1 |
| no2 | 24 | 23 | 24 | 24 | 41 | 40 | 35 | 35 | 28 | 16 | 16 | 18 | 25 | 28 | 50 | 37 | 50 | 34 | 45 | 40 |
| o3 | 125 | 115 | 86 | 74 | 67 | 57 | 60 | 90 | 140 | 107 | 157 | 145 | 151 | 124 | 84 | 66 | 63 | 60 | 69 | 85 |
| pm10 | 58 | 74 | 61 | 67 | 111 | 86 | 71 | 73 | 57 | 31 | 50 | 43 | 66 | 79 | 120 | 79 | 106 | 67 | 106 | 80 |
| so2 | 16 | 17 | 30 | 39 | 62 | 65 | 46 | 19 | 17 | 11 | 11 | 16 | 21 | 19 | 50 | 62 | 75 | 61 | 54 | 22 |