Air Pollution in Shiyingcun: Real-time Air Quality Index and smog alert.
Pollution and air quality forecast for Shiyingcun. Today is Tuesday, June 16, 2026. The following air pollution values have been recorded for Shiyingcun:- particulate matter (PM10) suspended dust - 7 (Good)
- particulate matter (PM2.5) dust - 2 (Good)
- carbon monoxide (CO) - 100 (Good)
- nitrogen dioxide (NO2) - 8 (Good)
- ozone (O3) - 0 (Good)
- sulfur dioxide (SO2) - 9 (Good)

What is the air quality in Shiyingcun today? Is the air polluted in Shiyingcun?. Is there smog?
What is the level of PM10 today in Shiyingcun? (particulate matter (PM10) suspended dust)
The current level of particulate matter PM10 in Shiyingcun is:
7 (Good)
The highest PM10 values usually occur in month: 121 (November 2018).
The lowest value of particulate matter PM10 pollution in Shiyingcun is usually recorded in: August (33).
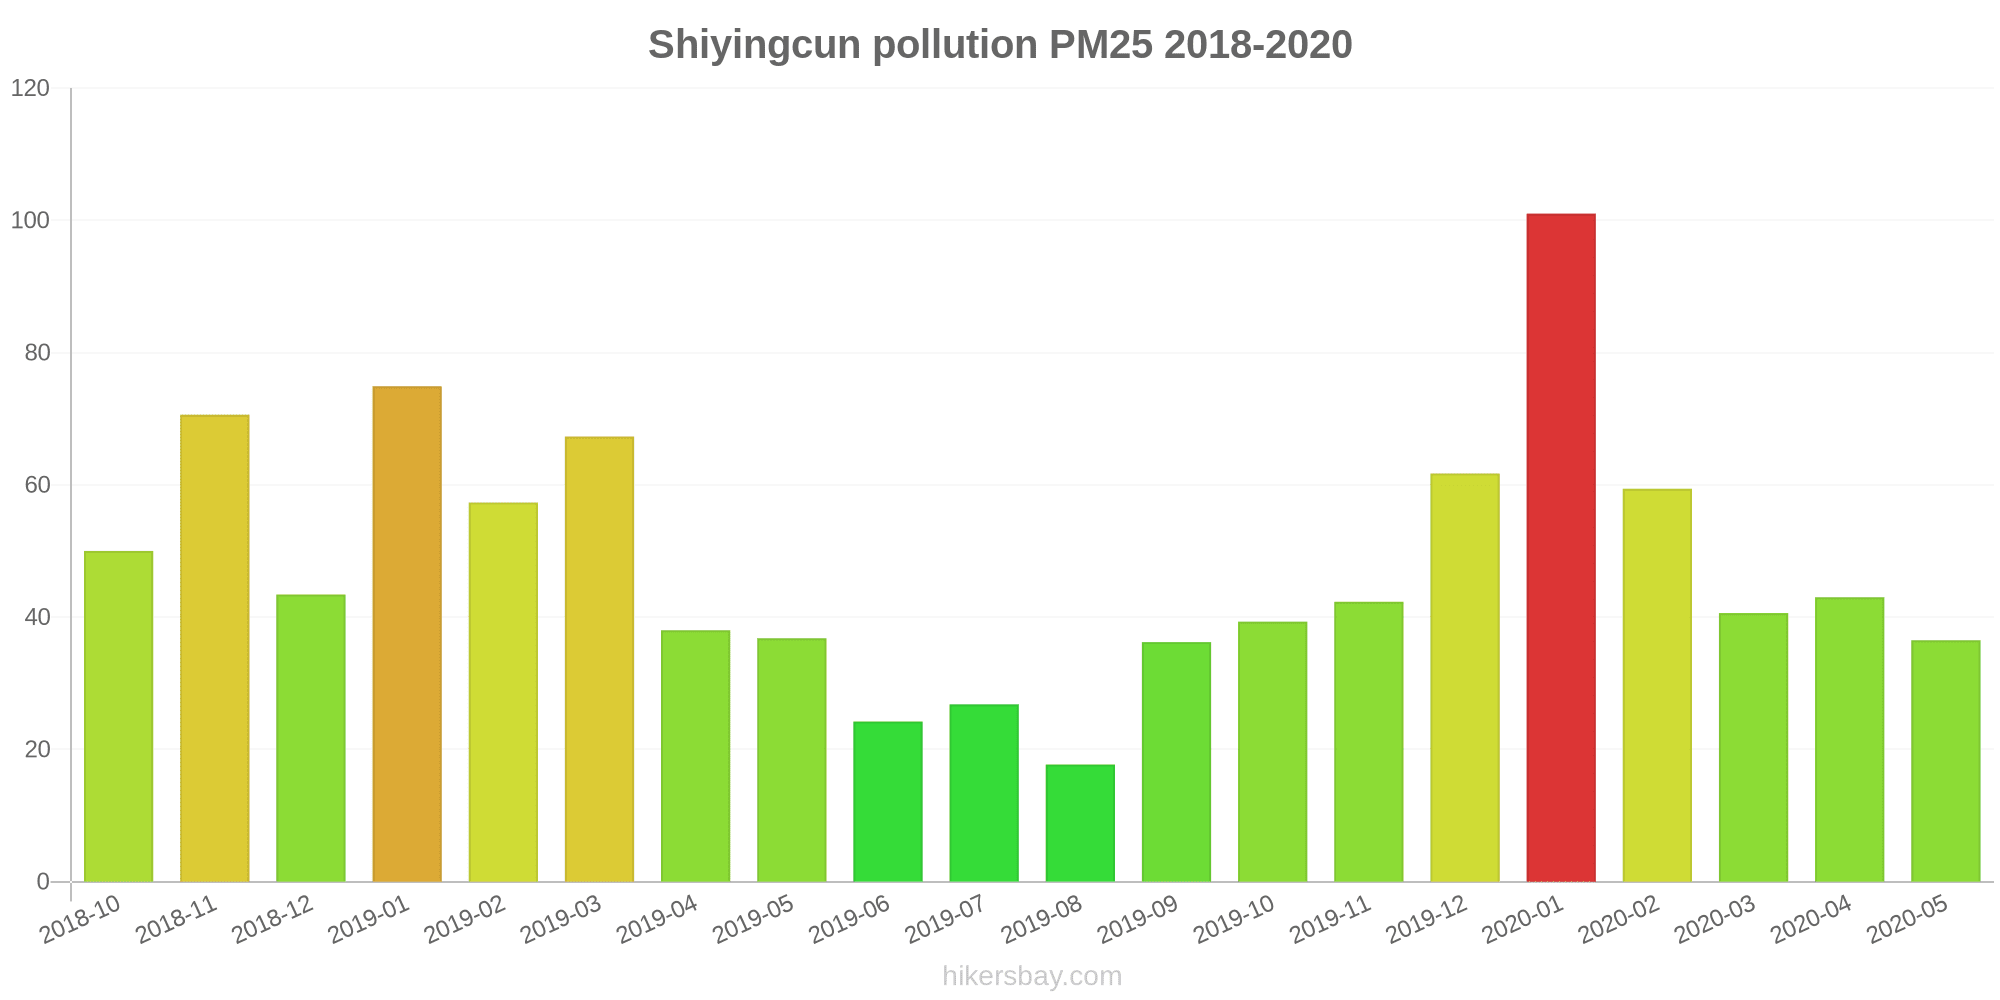
What is the current level of PM2.5 in Shiyingcun? (particulate matter (PM2.5) dust)
Today's PM2.5 level is:
2 (Good)
For comparison, the highest level of PM2.5 in Shiyingcun in the last 7 days was: 24 (Friday, May 27, 2022) and the lowest: 24 (Friday, May 27, 2022).
The highest PM2.5 values were recorded: 101 (January 2020).
The lowest level of particulate matter PM2.5 pollution occurs in month: August (18).
How high is the CO level? (carbon monoxide (CO))
100 (Good)
How high is the level of NO2? (nitrogen dioxide (NO2))
8 (Good)
How is the O3 level today in Shiyingcun? (ozone (O3))
0 (Good)
What is the level of SO2 pollution? (sulfur dioxide (SO2))
9 (Good)
Current data Friday, May 27, 2022, 12:00 PM
PM10 7 (Good)
PM2,5 2 (Good)
CO 100 (Good)
NO2 8 (Good)
O3 0 (Good)
SO2 9 (Good)
Data on air pollution from recent days in Shiyingcun
index
2022-05-27
pm10
32
Moderate
pm25
24
Moderate
co
468
Good
no2
21
Good
o3
32
Good
so2
5
Good
data source »
Air pollution in Shiyingcun from October 2018 to May 2020

index
2020-05
2020-04
2020-03
2020-02
2020-01
2019-12
2019-11
2019-10
2019-09
2019-08
2019-07
2019-06
2019-05
2019-04
2019-03
2019-02
2019-01
2018-12
2018-11
2018-10
pm25
37 (Unhealthy for Sensitive Groups)
43 (Unhealthy for Sensitive Groups)
41 (Unhealthy for Sensitive Groups)
59 (Unhealthy)
101 (Very Unhealthy)
62 (Unhealthy)
42 (Unhealthy for Sensitive Groups)
39 (Unhealthy for Sensitive Groups)
36 (Unhealthy for Sensitive Groups)
18 (Moderate)
27 (Moderate)
24 (Moderate)
37 (Unhealthy for Sensitive Groups)
38 (Unhealthy for Sensitive Groups)
67 (Unhealthy)
57 (Unhealthy)
75 (Unhealthy)
43 (Unhealthy for Sensitive Groups)
71 (Unhealthy)
50 (Unhealthy for Sensitive Groups)
co
858 (Good)
802 (Good)
787 (Good)
1 (Good)
1 (Good)
1 (Good)
1 (Good)
1 (Good)
988 (Good)
738 (Good)
865 (Good)
751 (Good)
746 (Good)
844 (Good)
1 (Good)
1 (Good)
1 (Good)
1 (Good)
1 (Good)
1 (Good)
no2
31 (Good)
29 (Good)
28 (Good)
28 (Good)
48 (Moderate)
45 (Moderate)
39 (Good)
39 (Good)
32 (Good)
21 (Good)
20 (Good)
24 (Good)
29 (Good)
30 (Good)
44 (Moderate)
41 (Moderate)
45 (Moderate)
36 (Good)
51 (Moderate)
43 (Moderate)
o3
134 (Unhealthy for Sensitive Groups)
120 (Unhealthy for Sensitive Groups)
87 (Moderate)
76 (Moderate)
66 (Good)
54 (Good)
57 (Good)
88 (Moderate)
137 (Unhealthy for Sensitive Groups)
114 (Moderate)
158 (Unhealthy)
150 (Unhealthy)
157 (Unhealthy)
112 (Moderate)
81 (Moderate)
65 (Good)
66 (Good)
63 (Good)
67 (Good)
87 (Moderate)
pm10
64 (Unhealthy for Sensitive Groups)
82 (Unhealthy)
67 (Unhealthy for Sensitive Groups)
72 (Unhealthy for Sensitive Groups)
115 (Very Unhealthy)
83 (Unhealthy)
72 (Unhealthy for Sensitive Groups)
78 (Unhealthy for Sensitive Groups)
59 (Unhealthy for Sensitive Groups)
33 (Moderate)
48 (Moderate)
45 (Moderate)
73 (Unhealthy for Sensitive Groups)
81 (Unhealthy)
94 (Unhealthy)
79 (Unhealthy for Sensitive Groups)
106 (Unhealthy)
68 (Unhealthy for Sensitive Groups)
121 (Very Unhealthy)
75 (Unhealthy for Sensitive Groups)
so2
19 (Good)
20 (Good)
35 (Good)
42 (Good)
74 (Moderate)
72 (Moderate)
57 (Moderate)
23 (Good)
19 (Good)
17 (Good)
12 (Good)
16 (Good)
21 (Good)
25 (Good)
44 (Good)
63 (Moderate)
68 (Moderate)
60 (Moderate)
66 (Moderate)
21 (Good)
data source »
天安街道
Friday, May 27, 2022, 12:00 PM
PM10 6.7 (Good)
particulate matter (PM10) suspended dust
PM2,5 1.7 (Good)
particulate matter (PM2.5) dust
CO 100 (Good)
carbon monoxide (CO)
NO2 7.6 (Good)
nitrogen dioxide (NO2)
O3 0.02 (Good)
ozone (O3)
SO2 8.6 (Good)
sulfur dioxide (SO2)
天安街道
index
2022-05-27
pm10
32
pm25
24
co
468
no2
21
o3
32
so2
4.6
天安街道
2018-10 2020-05

index
2020-05
2020-04
2020-03
2020-02
2020-01
2019-12
2019-11
2019-10
2019-09
2019-08
2019-07
2019-06
2019-05
2019-04
2019-03
2019-02
2019-01
2018-12
2018-11
2018-10
pm25
37
43
41
59
101
62
42
39
36
18
27
24
37
38
67
57
75
43
71
50
co
858
802
787
1
1
1
1
1
988
738
865
751
746
844
1
1
1
1
1
1
no2
31
29
28
28
48
45
39
39
32
21
20
24
29
30
44
41
45
36
51
43
o3
134
120
87
76
66
54
57
88
137
114
158
150
157
112
81
65
66
63
67
87
pm10
64
82
67
72
115
83
72
78
59
33
48
45
73
81
94
79
106
68
121
75
so2
19
20
35
42
74
72
57
23
19
17
12
16
21
25
44
63
68
60
66
21
* Pollution data source:
https://openaq.org
(ChinaAQIData)
The data is licensed under CC-By 4.0
PM10 7 (Good)
PM2,5 2 (Good)
CO 100 (Good)
NO2 8 (Good)
O3 0 (Good)
SO2 9 (Good)
Data on air pollution from recent days in Shiyingcun
| index | 2022-05-27 |
|---|---|
| pm10 | 32 Moderate |
| pm25 | 24 Moderate |
| co | 468 Good |
| no2 | 21 Good |
| o3 | 32 Good |
| so2 | 5 Good |
| index | 2020-05 | 2020-04 | 2020-03 | 2020-02 | 2020-01 | 2019-12 | 2019-11 | 2019-10 | 2019-09 | 2019-08 | 2019-07 | 2019-06 | 2019-05 | 2019-04 | 2019-03 | 2019-02 | 2019-01 | 2018-12 | 2018-11 | 2018-10 |
|---|---|---|---|---|---|---|---|---|---|---|---|---|---|---|---|---|---|---|---|---|
| pm25 | 37 (Unhealthy for Sensitive Groups) | 43 (Unhealthy for Sensitive Groups) | 41 (Unhealthy for Sensitive Groups) | 59 (Unhealthy) | 101 (Very Unhealthy) | 62 (Unhealthy) | 42 (Unhealthy for Sensitive Groups) | 39 (Unhealthy for Sensitive Groups) | 36 (Unhealthy for Sensitive Groups) | 18 (Moderate) | 27 (Moderate) | 24 (Moderate) | 37 (Unhealthy for Sensitive Groups) | 38 (Unhealthy for Sensitive Groups) | 67 (Unhealthy) | 57 (Unhealthy) | 75 (Unhealthy) | 43 (Unhealthy for Sensitive Groups) | 71 (Unhealthy) | 50 (Unhealthy for Sensitive Groups) |
| co | 858 (Good) | 802 (Good) | 787 (Good) | 1 (Good) | 1 (Good) | 1 (Good) | 1 (Good) | 1 (Good) | 988 (Good) | 738 (Good) | 865 (Good) | 751 (Good) | 746 (Good) | 844 (Good) | 1 (Good) | 1 (Good) | 1 (Good) | 1 (Good) | 1 (Good) | 1 (Good) |
| no2 | 31 (Good) | 29 (Good) | 28 (Good) | 28 (Good) | 48 (Moderate) | 45 (Moderate) | 39 (Good) | 39 (Good) | 32 (Good) | 21 (Good) | 20 (Good) | 24 (Good) | 29 (Good) | 30 (Good) | 44 (Moderate) | 41 (Moderate) | 45 (Moderate) | 36 (Good) | 51 (Moderate) | 43 (Moderate) |
| o3 | 134 (Unhealthy for Sensitive Groups) | 120 (Unhealthy for Sensitive Groups) | 87 (Moderate) | 76 (Moderate) | 66 (Good) | 54 (Good) | 57 (Good) | 88 (Moderate) | 137 (Unhealthy for Sensitive Groups) | 114 (Moderate) | 158 (Unhealthy) | 150 (Unhealthy) | 157 (Unhealthy) | 112 (Moderate) | 81 (Moderate) | 65 (Good) | 66 (Good) | 63 (Good) | 67 (Good) | 87 (Moderate) |
| pm10 | 64 (Unhealthy for Sensitive Groups) | 82 (Unhealthy) | 67 (Unhealthy for Sensitive Groups) | 72 (Unhealthy for Sensitive Groups) | 115 (Very Unhealthy) | 83 (Unhealthy) | 72 (Unhealthy for Sensitive Groups) | 78 (Unhealthy for Sensitive Groups) | 59 (Unhealthy for Sensitive Groups) | 33 (Moderate) | 48 (Moderate) | 45 (Moderate) | 73 (Unhealthy for Sensitive Groups) | 81 (Unhealthy) | 94 (Unhealthy) | 79 (Unhealthy for Sensitive Groups) | 106 (Unhealthy) | 68 (Unhealthy for Sensitive Groups) | 121 (Very Unhealthy) | 75 (Unhealthy for Sensitive Groups) |
| so2 | 19 (Good) | 20 (Good) | 35 (Good) | 42 (Good) | 74 (Moderate) | 72 (Moderate) | 57 (Moderate) | 23 (Good) | 19 (Good) | 17 (Good) | 12 (Good) | 16 (Good) | 21 (Good) | 25 (Good) | 44 (Good) | 63 (Moderate) | 68 (Moderate) | 60 (Moderate) | 66 (Moderate) | 21 (Good) |
PM10 6.7 (Good)
particulate matter (PM10) suspended dustPM2,5 1.7 (Good)
particulate matter (PM2.5) dustCO 100 (Good)
carbon monoxide (CO)NO2 7.6 (Good)
nitrogen dioxide (NO2)O3 0.02 (Good)
ozone (O3)SO2 8.6 (Good)
sulfur dioxide (SO2)天安街道
| index | 2022-05-27 |
|---|---|
| pm10 | 32 |
| pm25 | 24 |
| co | 468 |
| no2 | 21 |
| o3 | 32 |
| so2 | 4.6 |
天安街道

| index | 2020-05 | 2020-04 | 2020-03 | 2020-02 | 2020-01 | 2019-12 | 2019-11 | 2019-10 | 2019-09 | 2019-08 | 2019-07 | 2019-06 | 2019-05 | 2019-04 | 2019-03 | 2019-02 | 2019-01 | 2018-12 | 2018-11 | 2018-10 |
|---|---|---|---|---|---|---|---|---|---|---|---|---|---|---|---|---|---|---|---|---|
| pm25 | 37 | 43 | 41 | 59 | 101 | 62 | 42 | 39 | 36 | 18 | 27 | 24 | 37 | 38 | 67 | 57 | 75 | 43 | 71 | 50 |
| co | 858 | 802 | 787 | 1 | 1 | 1 | 1 | 1 | 988 | 738 | 865 | 751 | 746 | 844 | 1 | 1 | 1 | 1 | 1 | 1 |
| no2 | 31 | 29 | 28 | 28 | 48 | 45 | 39 | 39 | 32 | 21 | 20 | 24 | 29 | 30 | 44 | 41 | 45 | 36 | 51 | 43 |
| o3 | 134 | 120 | 87 | 76 | 66 | 54 | 57 | 88 | 137 | 114 | 158 | 150 | 157 | 112 | 81 | 65 | 66 | 63 | 67 | 87 |
| pm10 | 64 | 82 | 67 | 72 | 115 | 83 | 72 | 78 | 59 | 33 | 48 | 45 | 73 | 81 | 94 | 79 | 106 | 68 | 121 | 75 |
| so2 | 19 | 20 | 35 | 42 | 74 | 72 | 57 | 23 | 19 | 17 | 12 | 16 | 21 | 25 | 44 | 63 | 68 | 60 | 66 | 21 |