Air Pollution in Desheng: Real-time Air Quality Index and smog alert.
Pollution and air quality forecast for Desheng. Today is Tuesday, June 16, 2026. The following air pollution values have been recorded for Desheng:- particulate matter (PM10) suspended dust - 7 (Good)
- particulate matter (PM2.5) dust - 2 (Good)
- carbon monoxide (CO) - 100 (Good)
- nitrogen dioxide (NO2) - 8 (Good)
- ozone (O3) - 0 (Good)
- sulfur dioxide (SO2) - 9 (Good)

What is the air quality in Desheng today? Is the air polluted in Desheng?. Is there smog?
What is the level of PM10 today in Desheng? (particulate matter (PM10) suspended dust)
The current level of particulate matter PM10 in Desheng is:
7 (Good)
The highest PM10 values usually occur in month: 175 (January 2020).
The lowest value of particulate matter PM10 pollution in Desheng is usually recorded in: August (38).
What is the current level of PM2.5 in Desheng? (particulate matter (PM2.5) dust)
Today's PM2.5 level is:
2 (Good)
For comparison, the highest level of PM2.5 in Desheng in the last 7 days was: 24 (Friday, May 27, 2022) and the lowest: 24 (Friday, May 27, 2022).
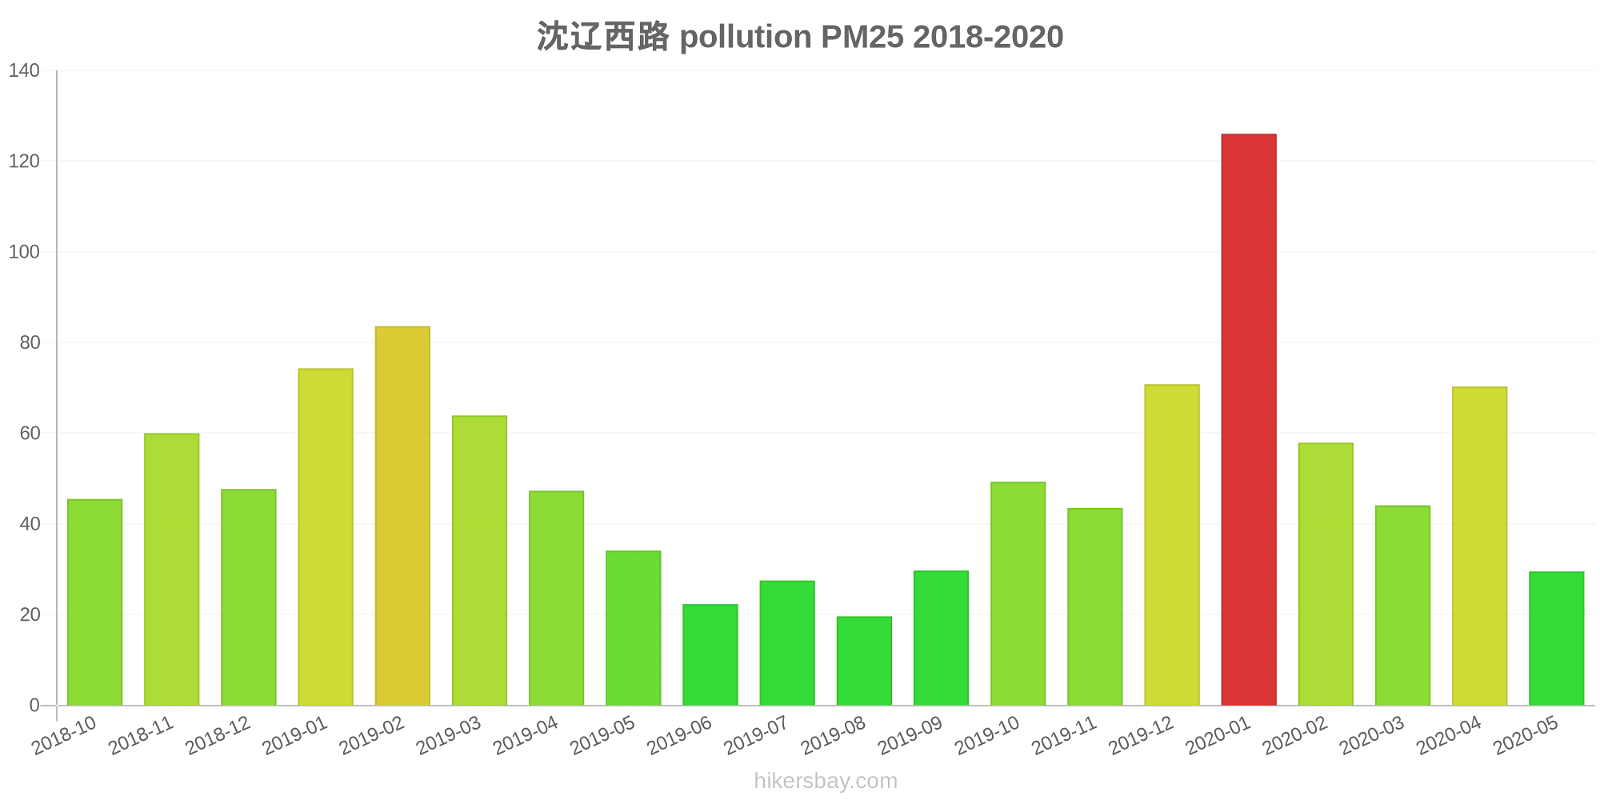
The highest PM2.5 values were recorded: 126 (January 2020).
The lowest level of particulate matter PM2.5 pollution occurs in month: August (20).
How high is the CO level? (carbon monoxide (CO))
100 (Good)
How high is the level of NO2? (nitrogen dioxide (NO2))
8 (Good)
How is the O3 level today in Desheng? (ozone (O3))
0 (Good)
What is the level of SO2 pollution? (sulfur dioxide (SO2))
9 (Good)
Current data Friday, May 27, 2022, 12:00 PM
PM10 7 (Good)
PM2,5 2 (Good)
CO 100 (Good)
NO2 8 (Good)
O3 0 (Good)
SO2 9 (Good)
Data on air pollution from recent days in Desheng
index
2022-05-27
pm10
32
Moderate
pm25
24
Moderate
co
468
Good
no2
21
Good
o3
32
Good
so2
5
Good
data source »
Air pollution in Desheng from October 2018 to May 2020

index
2020-05
2020-04
2020-03
2020-02
2020-01
2019-12
2019-11
2019-10
2019-09
2019-08
2019-07
2019-06
2019-05
2019-04
2019-03
2019-02
2019-01
2018-12
2018-11
2018-10
pm25
30 (Moderate)
70 (Unhealthy)
44 (Unhealthy for Sensitive Groups)
58 (Unhealthy)
126 (Very bad Hazardous)
71 (Unhealthy)
44 (Unhealthy for Sensitive Groups)
49 (Unhealthy for Sensitive Groups)
30 (Moderate)
20 (Moderate)
28 (Moderate)
22 (Moderate)
34 (Moderate)
47 (Unhealthy for Sensitive Groups)
64 (Unhealthy)
84 (Very Unhealthy)
74 (Unhealthy)
48 (Unhealthy for Sensitive Groups)
60 (Unhealthy)
46 (Unhealthy for Sensitive Groups)
co
574 (Good)
798 (Good)
620 (Good)
893 (Good)
1 (Good)
1 (Good)
819 (Good)
940 (Good)
1 (Good)
835 (Good)
1 (Good)
750 (Good)
658 (Good)
777 (Good)
970 (Good)
1 (Good)
1 (Good)
1 (Good)
1 (Good)
1 (Good)
no2
29 (Good)
43 (Moderate)
32 (Good)
31 (Good)
58 (Moderate)
48 (Moderate)
43 (Moderate)
44 (Moderate)
38 (Good)
24 (Good)
20 (Good)
30 (Good)
23 (Good)
36 (Good)
39 (Good)
42 (Moderate)
47 (Moderate)
40 (Moderate)
46 (Moderate)
41 (Moderate)
o3
130 (Unhealthy for Sensitive Groups)
129 (Unhealthy for Sensitive Groups)
98 (Moderate)
82 (Moderate)
68 (Good)
55 (Good)
57 (Good)
102 (Moderate)
125 (Unhealthy for Sensitive Groups)
116 (Moderate)
168 (Unhealthy)
152 (Unhealthy)
150 (Unhealthy)
120 (Unhealthy for Sensitive Groups)
107 (Moderate)
89 (Moderate)
65 (Good)
58 (Good)
65 (Good)
85 (Moderate)
pm10
98 (Unhealthy)
153 (Very bad Hazardous)
90 (Unhealthy)
94 (Unhealthy)
175 (Very bad Hazardous)
107 (Unhealthy)
88 (Unhealthy)
107 (Unhealthy)
69 (Unhealthy for Sensitive Groups)
38 (Moderate)
51 (Unhealthy for Sensitive Groups)
50 (Moderate)
104 (Unhealthy)
134 (Very Unhealthy)
125 (Very Unhealthy)
122 (Very Unhealthy)
127 (Very Unhealthy)
83 (Unhealthy)
104 (Unhealthy)
86 (Unhealthy)
so2
12 (Good)
19 (Good)
14 (Good)
17 (Good)
33 (Good)
29 (Good)
25 (Good)
21 (Good)
20 (Good)
10 (Good)
11 (Good)
15 (Good)
16 (Good)
18 (Good)
21 (Good)
24 (Good)
28 (Good)
22 (Good)
25 (Good)
27 (Good)
data source »
沈辽西路
Friday, May 27, 2022, 12:00 PM
PM10 6.7 (Good)
particulate matter (PM10) suspended dust
PM2,5 1.7 (Good)
particulate matter (PM2.5) dust
CO 100 (Good)
carbon monoxide (CO)
NO2 7.6 (Good)
nitrogen dioxide (NO2)
O3 0.02 (Good)
ozone (O3)
SO2 8.6 (Good)
sulfur dioxide (SO2)
沈辽西路
index
2022-05-27
pm10
32
pm25
24
co
468
no2
21
o3
32
so2
4.6
沈辽西路
2018-10 2020-05
index
2020-05
2020-04
2020-03
2020-02
2020-01
2019-12
2019-11
2019-10
2019-09
2019-08
2019-07
2019-06
2019-05
2019-04
2019-03
2019-02
2019-01
2018-12
2018-11
2018-10
pm25
30
70
44
58
126
71
44
49
30
20
28
22
34
47
64
84
74
48
60
46
co
574
798
620
893
1
1
819
940
1
835
1
750
658
777
970
1
1
1
1
1
no2
29
43
32
31
58
48
43
44
38
24
20
30
23
36
39
42
47
40
46
41
o3
130
129
98
82
68
55
57
102
125
116
168
152
150
120
107
89
65
58
65
85
pm10
98
153
90
94
175
107
88
107
69
38
51
50
104
134
125
122
127
83
104
86
so2
12
19
14
17
33
29
25
21
20
10
11
15
16
18
21
24
28
22
25
27
* Pollution data source:
https://openaq.org
(ChinaAQIData)
The data is licensed under CC-By 4.0
PM10 7 (Good)
PM2,5 2 (Good)
CO 100 (Good)
NO2 8 (Good)
O3 0 (Good)
SO2 9 (Good)
Data on air pollution from recent days in Desheng
| index | 2022-05-27 |
|---|---|
| pm10 | 32 Moderate |
| pm25 | 24 Moderate |
| co | 468 Good |
| no2 | 21 Good |
| o3 | 32 Good |
| so2 | 5 Good |

| index | 2020-05 | 2020-04 | 2020-03 | 2020-02 | 2020-01 | 2019-12 | 2019-11 | 2019-10 | 2019-09 | 2019-08 | 2019-07 | 2019-06 | 2019-05 | 2019-04 | 2019-03 | 2019-02 | 2019-01 | 2018-12 | 2018-11 | 2018-10 |
|---|---|---|---|---|---|---|---|---|---|---|---|---|---|---|---|---|---|---|---|---|
| pm25 | 30 (Moderate) | 70 (Unhealthy) | 44 (Unhealthy for Sensitive Groups) | 58 (Unhealthy) | 126 (Very bad Hazardous) | 71 (Unhealthy) | 44 (Unhealthy for Sensitive Groups) | 49 (Unhealthy for Sensitive Groups) | 30 (Moderate) | 20 (Moderate) | 28 (Moderate) | 22 (Moderate) | 34 (Moderate) | 47 (Unhealthy for Sensitive Groups) | 64 (Unhealthy) | 84 (Very Unhealthy) | 74 (Unhealthy) | 48 (Unhealthy for Sensitive Groups) | 60 (Unhealthy) | 46 (Unhealthy for Sensitive Groups) |
| co | 574 (Good) | 798 (Good) | 620 (Good) | 893 (Good) | 1 (Good) | 1 (Good) | 819 (Good) | 940 (Good) | 1 (Good) | 835 (Good) | 1 (Good) | 750 (Good) | 658 (Good) | 777 (Good) | 970 (Good) | 1 (Good) | 1 (Good) | 1 (Good) | 1 (Good) | 1 (Good) |
| no2 | 29 (Good) | 43 (Moderate) | 32 (Good) | 31 (Good) | 58 (Moderate) | 48 (Moderate) | 43 (Moderate) | 44 (Moderate) | 38 (Good) | 24 (Good) | 20 (Good) | 30 (Good) | 23 (Good) | 36 (Good) | 39 (Good) | 42 (Moderate) | 47 (Moderate) | 40 (Moderate) | 46 (Moderate) | 41 (Moderate) |
| o3 | 130 (Unhealthy for Sensitive Groups) | 129 (Unhealthy for Sensitive Groups) | 98 (Moderate) | 82 (Moderate) | 68 (Good) | 55 (Good) | 57 (Good) | 102 (Moderate) | 125 (Unhealthy for Sensitive Groups) | 116 (Moderate) | 168 (Unhealthy) | 152 (Unhealthy) | 150 (Unhealthy) | 120 (Unhealthy for Sensitive Groups) | 107 (Moderate) | 89 (Moderate) | 65 (Good) | 58 (Good) | 65 (Good) | 85 (Moderate) |
| pm10 | 98 (Unhealthy) | 153 (Very bad Hazardous) | 90 (Unhealthy) | 94 (Unhealthy) | 175 (Very bad Hazardous) | 107 (Unhealthy) | 88 (Unhealthy) | 107 (Unhealthy) | 69 (Unhealthy for Sensitive Groups) | 38 (Moderate) | 51 (Unhealthy for Sensitive Groups) | 50 (Moderate) | 104 (Unhealthy) | 134 (Very Unhealthy) | 125 (Very Unhealthy) | 122 (Very Unhealthy) | 127 (Very Unhealthy) | 83 (Unhealthy) | 104 (Unhealthy) | 86 (Unhealthy) |
| so2 | 12 (Good) | 19 (Good) | 14 (Good) | 17 (Good) | 33 (Good) | 29 (Good) | 25 (Good) | 21 (Good) | 20 (Good) | 10 (Good) | 11 (Good) | 15 (Good) | 16 (Good) | 18 (Good) | 21 (Good) | 24 (Good) | 28 (Good) | 22 (Good) | 25 (Good) | 27 (Good) |
PM10 6.7 (Good)
particulate matter (PM10) suspended dustPM2,5 1.7 (Good)
particulate matter (PM2.5) dustCO 100 (Good)
carbon monoxide (CO)NO2 7.6 (Good)
nitrogen dioxide (NO2)O3 0.02 (Good)
ozone (O3)SO2 8.6 (Good)
sulfur dioxide (SO2)沈辽西路
| index | 2022-05-27 |
|---|---|
| pm10 | 32 |
| pm25 | 24 |
| co | 468 |
| no2 | 21 |
| o3 | 32 |
| so2 | 4.6 |
沈辽西路

| index | 2020-05 | 2020-04 | 2020-03 | 2020-02 | 2020-01 | 2019-12 | 2019-11 | 2019-10 | 2019-09 | 2019-08 | 2019-07 | 2019-06 | 2019-05 | 2019-04 | 2019-03 | 2019-02 | 2019-01 | 2018-12 | 2018-11 | 2018-10 |
|---|---|---|---|---|---|---|---|---|---|---|---|---|---|---|---|---|---|---|---|---|
| pm25 | 30 | 70 | 44 | 58 | 126 | 71 | 44 | 49 | 30 | 20 | 28 | 22 | 34 | 47 | 64 | 84 | 74 | 48 | 60 | 46 |
| co | 574 | 798 | 620 | 893 | 1 | 1 | 819 | 940 | 1 | 835 | 1 | 750 | 658 | 777 | 970 | 1 | 1 | 1 | 1 | 1 |
| no2 | 29 | 43 | 32 | 31 | 58 | 48 | 43 | 44 | 38 | 24 | 20 | 30 | 23 | 36 | 39 | 42 | 47 | 40 | 46 | 41 |
| o3 | 130 | 129 | 98 | 82 | 68 | 55 | 57 | 102 | 125 | 116 | 168 | 152 | 150 | 120 | 107 | 89 | 65 | 58 | 65 | 85 |
| pm10 | 98 | 153 | 90 | 94 | 175 | 107 | 88 | 107 | 69 | 38 | 51 | 50 | 104 | 134 | 125 | 122 | 127 | 83 | 104 | 86 |
| so2 | 12 | 19 | 14 | 17 | 33 | 29 | 25 | 21 | 20 | 10 | 11 | 15 | 16 | 18 | 21 | 24 | 28 | 22 | 25 | 27 |