Air Pollution in Wulitaicun: Real-time Air Quality Index and smog alert.
Pollution and air quality forecast for Wulitaicun. Today is Tuesday, June 16, 2026. The following air pollution values have been recorded for Wulitaicun:- particulate matter (PM10) suspended dust - 7 (Good)
- particulate matter (PM2.5) dust - 2 (Good)
- carbon monoxide (CO) - 100 (Good)
- nitrogen dioxide (NO2) - 8 (Good)
- ozone (O3) - 0 (Good)
- sulfur dioxide (SO2) - 9 (Good)

What is the air quality in Wulitaicun today? Is the air polluted in Wulitaicun?. Is there smog?
What is the level of PM10 today in Wulitaicun? (particulate matter (PM10) suspended dust)
The current level of particulate matter PM10 in Wulitaicun is:
7 (Good)
The highest PM10 values usually occur in month: 150 (January 2020).
The lowest value of particulate matter PM10 pollution in Wulitaicun is usually recorded in: August (37).
What is the current level of PM2.5 in Wulitaicun? (particulate matter (PM2.5) dust)
Today's PM2.5 level is:
2 (Good)
For comparison, the highest level of PM2.5 in Wulitaicun in the last 7 days was: 24 (Friday, May 27, 2022) and the lowest: 24 (Friday, May 27, 2022).
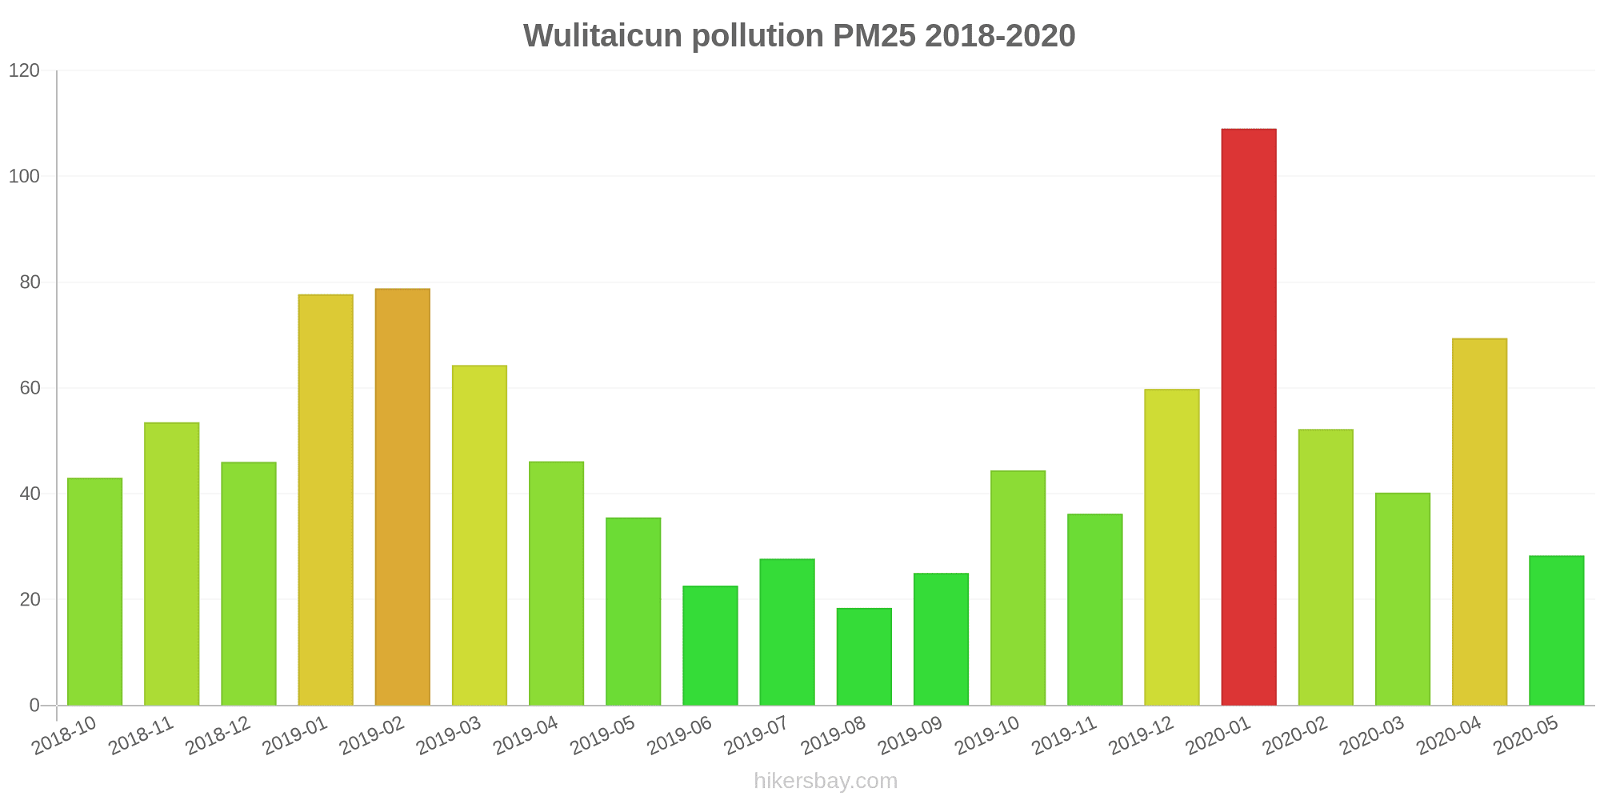
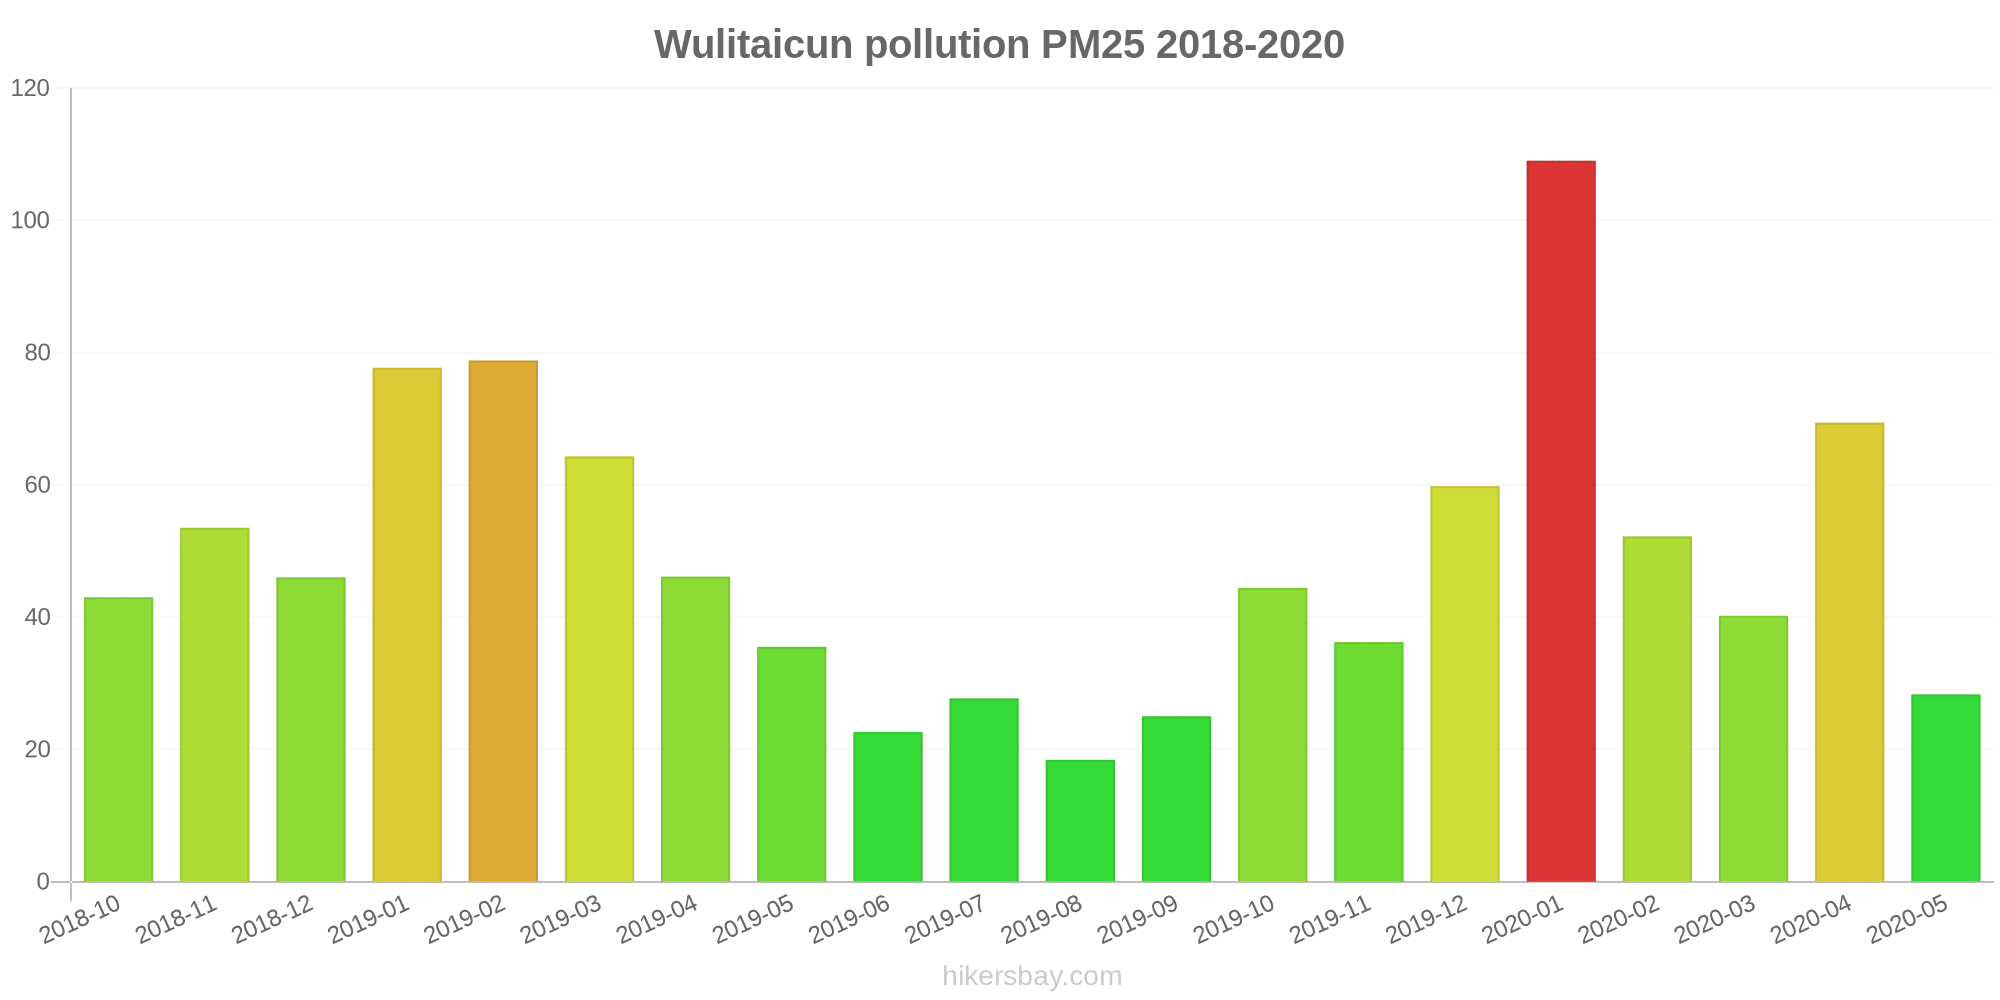
The highest PM2.5 values were recorded: 109 (January 2020).
The lowest level of particulate matter PM2.5 pollution occurs in month: August (18).
How high is the CO level? (carbon monoxide (CO))
100 (Good)
How high is the level of NO2? (nitrogen dioxide (NO2))
8 (Good)
How is the O3 level today in Wulitaicun? (ozone (O3))
0 (Good)
What is the level of SO2 pollution? (sulfur dioxide (SO2))
9 (Good)
Current data Friday, May 27, 2022, 12:00 PM
PM10 7 (Good)
PM2,5 2 (Good)
CO 100 (Good)
NO2 8 (Good)
O3 0 (Good)
SO2 9 (Good)
Data on air pollution from recent days in Wulitaicun
index
2022-05-27
pm10
32
Moderate
pm25
24
Moderate
co
468
Good
no2
21
Good
o3
32
Good
so2
5
Good
data source »
Air pollution in Wulitaicun from October 2018 to May 2020
index
2020-05
2020-04
2020-03
2020-02
2020-01
2019-12
2019-11
2019-10
2019-09
2019-08
2019-07
2019-06
2019-05
2019-04
2019-03
2019-02
2019-01
2018-12
2018-11
2018-10
pm25
28 (Moderate)
69 (Unhealthy)
40 (Unhealthy for Sensitive Groups)
52 (Unhealthy for Sensitive Groups)
109 (Very Unhealthy)
60 (Unhealthy)
36 (Unhealthy for Sensitive Groups)
44 (Unhealthy for Sensitive Groups)
25 (Moderate)
18 (Moderate)
28 (Moderate)
23 (Moderate)
36 (Unhealthy for Sensitive Groups)
46 (Unhealthy for Sensitive Groups)
64 (Unhealthy)
79 (Very Unhealthy)
78 (Very Unhealthy)
46 (Unhealthy for Sensitive Groups)
54 (Unhealthy for Sensitive Groups)
43 (Unhealthy for Sensitive Groups)
co
586 (Good)
862 (Good)
720 (Good)
1 (Good)
1 (Good)
1 (Good)
847 (Good)
994 (Good)
874 (Good)
802 (Good)
925 (Good)
642 (Good)
635 (Good)
762 (Good)
999 (Good)
1 (Good)
1 (Good)
968 (Good)
1 (Good)
1 (Good)
no2
27 (Good)
43 (Moderate)
32 (Good)
30 (Good)
60 (Moderate)
49 (Moderate)
47 (Moderate)
48 (Moderate)
42 (Moderate)
32 (Good)
29 (Good)
32 (Good)
30 (Good)
42 (Moderate)
47 (Moderate)
47 (Moderate)
53 (Moderate)
43 (Moderate)
49 (Moderate)
44 (Moderate)
o3
129 (Unhealthy for Sensitive Groups)
126 (Unhealthy for Sensitive Groups)
90 (Moderate)
80 (Moderate)
62 (Good)
48 (Good)
54 (Good)
100 (Moderate)
130 (Unhealthy for Sensitive Groups)
118 (Moderate)
174 (Unhealthy)
155 (Unhealthy)
148 (Unhealthy for Sensitive Groups)
114 (Moderate)
99 (Moderate)
75 (Moderate)
58 (Good)
49 (Good)
54 (Good)
74 (Moderate)
pm10
77 (Unhealthy for Sensitive Groups)
135 (Very Unhealthy)
79 (Unhealthy for Sensitive Groups)
80 (Unhealthy for Sensitive Groups)
150 (Very bad Hazardous)
92 (Unhealthy)
72 (Unhealthy for Sensitive Groups)
91 (Unhealthy)
58 (Unhealthy for Sensitive Groups)
37 (Moderate)
48 (Moderate)
40 (Moderate)
95 (Unhealthy)
117 (Very Unhealthy)
116 (Very Unhealthy)
109 (Unhealthy)
126 (Very Unhealthy)
81 (Unhealthy)
90 (Unhealthy)
76 (Unhealthy for Sensitive Groups)
so2
19 (Good)
25 (Good)
23 (Good)
18 (Good)
29 (Good)
32 (Good)
29 (Good)
22 (Good)
26 (Good)
14 (Good)
14 (Good)
15 (Good)
27 (Good)
29 (Good)
31 (Good)
30 (Good)
26 (Good)
28 (Good)
31 (Good)
27 (Good)
data source »
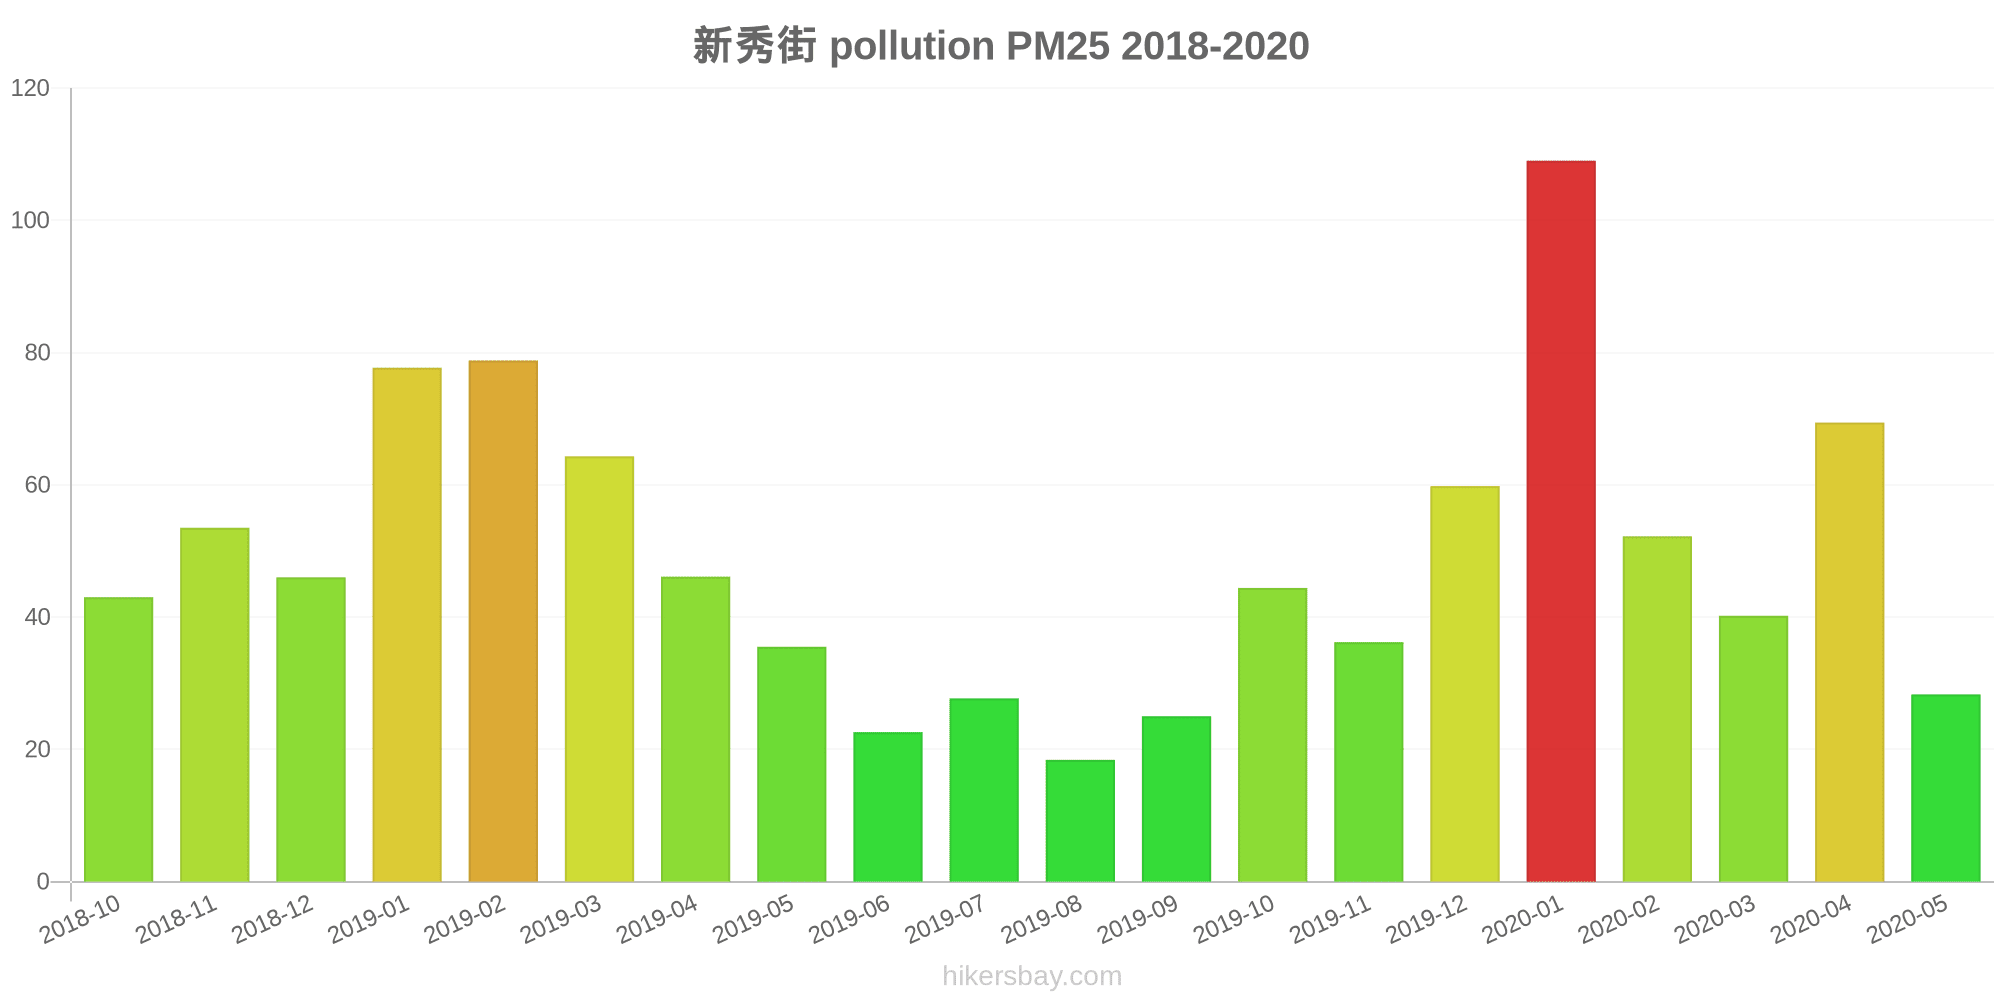
新秀街
Friday, May 27, 2022, 12:00 PM
PM10 6.7 (Good)
particulate matter (PM10) suspended dust
PM2,5 1.7 (Good)
particulate matter (PM2.5) dust
CO 100 (Good)
carbon monoxide (CO)
NO2 7.6 (Good)
nitrogen dioxide (NO2)
O3 0.02 (Good)
ozone (O3)
SO2 8.6 (Good)
sulfur dioxide (SO2)
新秀街
index
2022-05-27
pm10
32
pm25
24
co
468
no2
21
o3
32
so2
4.6
新秀街
2018-10 2020-05

index
2020-05
2020-04
2020-03
2020-02
2020-01
2019-12
2019-11
2019-10
2019-09
2019-08
2019-07
2019-06
2019-05
2019-04
2019-03
2019-02
2019-01
2018-12
2018-11
2018-10
pm25
28
69
40
52
109
60
36
44
25
18
28
23
36
46
64
79
78
46
54
43
co
586
862
720
1
1
1
847
994
874
802
925
642
635
762
999
1
1
968
1
1
no2
27
43
32
30
60
49
47
48
42
32
29
32
30
42
47
47
53
43
49
44
o3
129
126
90
80
62
48
54
100
130
118
174
155
148
114
99
75
58
49
54
74
pm10
77
135
79
80
150
92
72
91
58
37
48
40
95
117
116
109
126
81
90
76
so2
19
25
23
18
29
32
29
22
26
14
14
15
27
29
31
30
26
28
31
27
* Pollution data source:
https://openaq.org
(ChinaAQIData)
The data is licensed under CC-By 4.0
PM10 7 (Good)
PM2,5 2 (Good)
CO 100 (Good)
NO2 8 (Good)
O3 0 (Good)
SO2 9 (Good)
Data on air pollution from recent days in Wulitaicun
| index | 2022-05-27 |
|---|---|
| pm10 | 32 Moderate |
| pm25 | 24 Moderate |
| co | 468 Good |
| no2 | 21 Good |
| o3 | 32 Good |
| so2 | 5 Good |
| index | 2020-05 | 2020-04 | 2020-03 | 2020-02 | 2020-01 | 2019-12 | 2019-11 | 2019-10 | 2019-09 | 2019-08 | 2019-07 | 2019-06 | 2019-05 | 2019-04 | 2019-03 | 2019-02 | 2019-01 | 2018-12 | 2018-11 | 2018-10 |
|---|---|---|---|---|---|---|---|---|---|---|---|---|---|---|---|---|---|---|---|---|
| pm25 | 28 (Moderate) | 69 (Unhealthy) | 40 (Unhealthy for Sensitive Groups) | 52 (Unhealthy for Sensitive Groups) | 109 (Very Unhealthy) | 60 (Unhealthy) | 36 (Unhealthy for Sensitive Groups) | 44 (Unhealthy for Sensitive Groups) | 25 (Moderate) | 18 (Moderate) | 28 (Moderate) | 23 (Moderate) | 36 (Unhealthy for Sensitive Groups) | 46 (Unhealthy for Sensitive Groups) | 64 (Unhealthy) | 79 (Very Unhealthy) | 78 (Very Unhealthy) | 46 (Unhealthy for Sensitive Groups) | 54 (Unhealthy for Sensitive Groups) | 43 (Unhealthy for Sensitive Groups) |
| co | 586 (Good) | 862 (Good) | 720 (Good) | 1 (Good) | 1 (Good) | 1 (Good) | 847 (Good) | 994 (Good) | 874 (Good) | 802 (Good) | 925 (Good) | 642 (Good) | 635 (Good) | 762 (Good) | 999 (Good) | 1 (Good) | 1 (Good) | 968 (Good) | 1 (Good) | 1 (Good) |
| no2 | 27 (Good) | 43 (Moderate) | 32 (Good) | 30 (Good) | 60 (Moderate) | 49 (Moderate) | 47 (Moderate) | 48 (Moderate) | 42 (Moderate) | 32 (Good) | 29 (Good) | 32 (Good) | 30 (Good) | 42 (Moderate) | 47 (Moderate) | 47 (Moderate) | 53 (Moderate) | 43 (Moderate) | 49 (Moderate) | 44 (Moderate) |
| o3 | 129 (Unhealthy for Sensitive Groups) | 126 (Unhealthy for Sensitive Groups) | 90 (Moderate) | 80 (Moderate) | 62 (Good) | 48 (Good) | 54 (Good) | 100 (Moderate) | 130 (Unhealthy for Sensitive Groups) | 118 (Moderate) | 174 (Unhealthy) | 155 (Unhealthy) | 148 (Unhealthy for Sensitive Groups) | 114 (Moderate) | 99 (Moderate) | 75 (Moderate) | 58 (Good) | 49 (Good) | 54 (Good) | 74 (Moderate) |
| pm10 | 77 (Unhealthy for Sensitive Groups) | 135 (Very Unhealthy) | 79 (Unhealthy for Sensitive Groups) | 80 (Unhealthy for Sensitive Groups) | 150 (Very bad Hazardous) | 92 (Unhealthy) | 72 (Unhealthy for Sensitive Groups) | 91 (Unhealthy) | 58 (Unhealthy for Sensitive Groups) | 37 (Moderate) | 48 (Moderate) | 40 (Moderate) | 95 (Unhealthy) | 117 (Very Unhealthy) | 116 (Very Unhealthy) | 109 (Unhealthy) | 126 (Very Unhealthy) | 81 (Unhealthy) | 90 (Unhealthy) | 76 (Unhealthy for Sensitive Groups) |
| so2 | 19 (Good) | 25 (Good) | 23 (Good) | 18 (Good) | 29 (Good) | 32 (Good) | 29 (Good) | 22 (Good) | 26 (Good) | 14 (Good) | 14 (Good) | 15 (Good) | 27 (Good) | 29 (Good) | 31 (Good) | 30 (Good) | 26 (Good) | 28 (Good) | 31 (Good) | 27 (Good) |
PM10 6.7 (Good)
particulate matter (PM10) suspended dustPM2,5 1.7 (Good)
particulate matter (PM2.5) dustCO 100 (Good)
carbon monoxide (CO)NO2 7.6 (Good)
nitrogen dioxide (NO2)O3 0.02 (Good)
ozone (O3)SO2 8.6 (Good)
sulfur dioxide (SO2)新秀街
| index | 2022-05-27 |
|---|---|
| pm10 | 32 |
| pm25 | 24 |
| co | 468 |
| no2 | 21 |
| o3 | 32 |
| so2 | 4.6 |
新秀街
| index | 2020-05 | 2020-04 | 2020-03 | 2020-02 | 2020-01 | 2019-12 | 2019-11 | 2019-10 | 2019-09 | 2019-08 | 2019-07 | 2019-06 | 2019-05 | 2019-04 | 2019-03 | 2019-02 | 2019-01 | 2018-12 | 2018-11 | 2018-10 |
|---|---|---|---|---|---|---|---|---|---|---|---|---|---|---|---|---|---|---|---|---|
| pm25 | 28 | 69 | 40 | 52 | 109 | 60 | 36 | 44 | 25 | 18 | 28 | 23 | 36 | 46 | 64 | 79 | 78 | 46 | 54 | 43 |
| co | 586 | 862 | 720 | 1 | 1 | 1 | 847 | 994 | 874 | 802 | 925 | 642 | 635 | 762 | 999 | 1 | 1 | 968 | 1 | 1 |
| no2 | 27 | 43 | 32 | 30 | 60 | 49 | 47 | 48 | 42 | 32 | 29 | 32 | 30 | 42 | 47 | 47 | 53 | 43 | 49 | 44 |
| o3 | 129 | 126 | 90 | 80 | 62 | 48 | 54 | 100 | 130 | 118 | 174 | 155 | 148 | 114 | 99 | 75 | 58 | 49 | 54 | 74 |
| pm10 | 77 | 135 | 79 | 80 | 150 | 92 | 72 | 91 | 58 | 37 | 48 | 40 | 95 | 117 | 116 | 109 | 126 | 81 | 90 | 76 |
| so2 | 19 | 25 | 23 | 18 | 29 | 32 | 29 | 22 | 26 | 14 | 14 | 15 | 27 | 29 | 31 | 30 | 26 | 28 | 31 | 27 |