Air Pollution in Lieshishan: Real-time Air Quality Index and smog alert.
Pollution and air quality forecast for Lieshishan. Today is Tuesday, June 16, 2026. The following air pollution values have been recorded for Lieshishan:- particulate matter (PM10) suspended dust - 7 (Good)
- particulate matter (PM2.5) dust - 2 (Good)
- carbon monoxide (CO) - 100 (Good)
- nitrogen dioxide (NO2) - 8 (Good)
- ozone (O3) - 0 (Good)
- sulfur dioxide (SO2) - 9 (Good)

What is the air quality in Lieshishan today? Is the air polluted in Lieshishan?. Is there smog?
What is the level of PM10 today in Lieshishan? (particulate matter (PM10) suspended dust)
The current level of particulate matter PM10 in Lieshishan is:
7 (Good)
The highest PM10 values usually occur in month: 187 (January 2020).
The lowest value of particulate matter PM10 pollution in Lieshishan is usually recorded in: August (51).
What is the current level of PM2.5 in Lieshishan? (particulate matter (PM2.5) dust)
Today's PM2.5 level is:
2 (Good)
For comparison, the highest level of PM2.5 in Lieshishan in the last 7 days was: 24 (Friday, May 27, 2022) and the lowest: 24 (Friday, May 27, 2022).
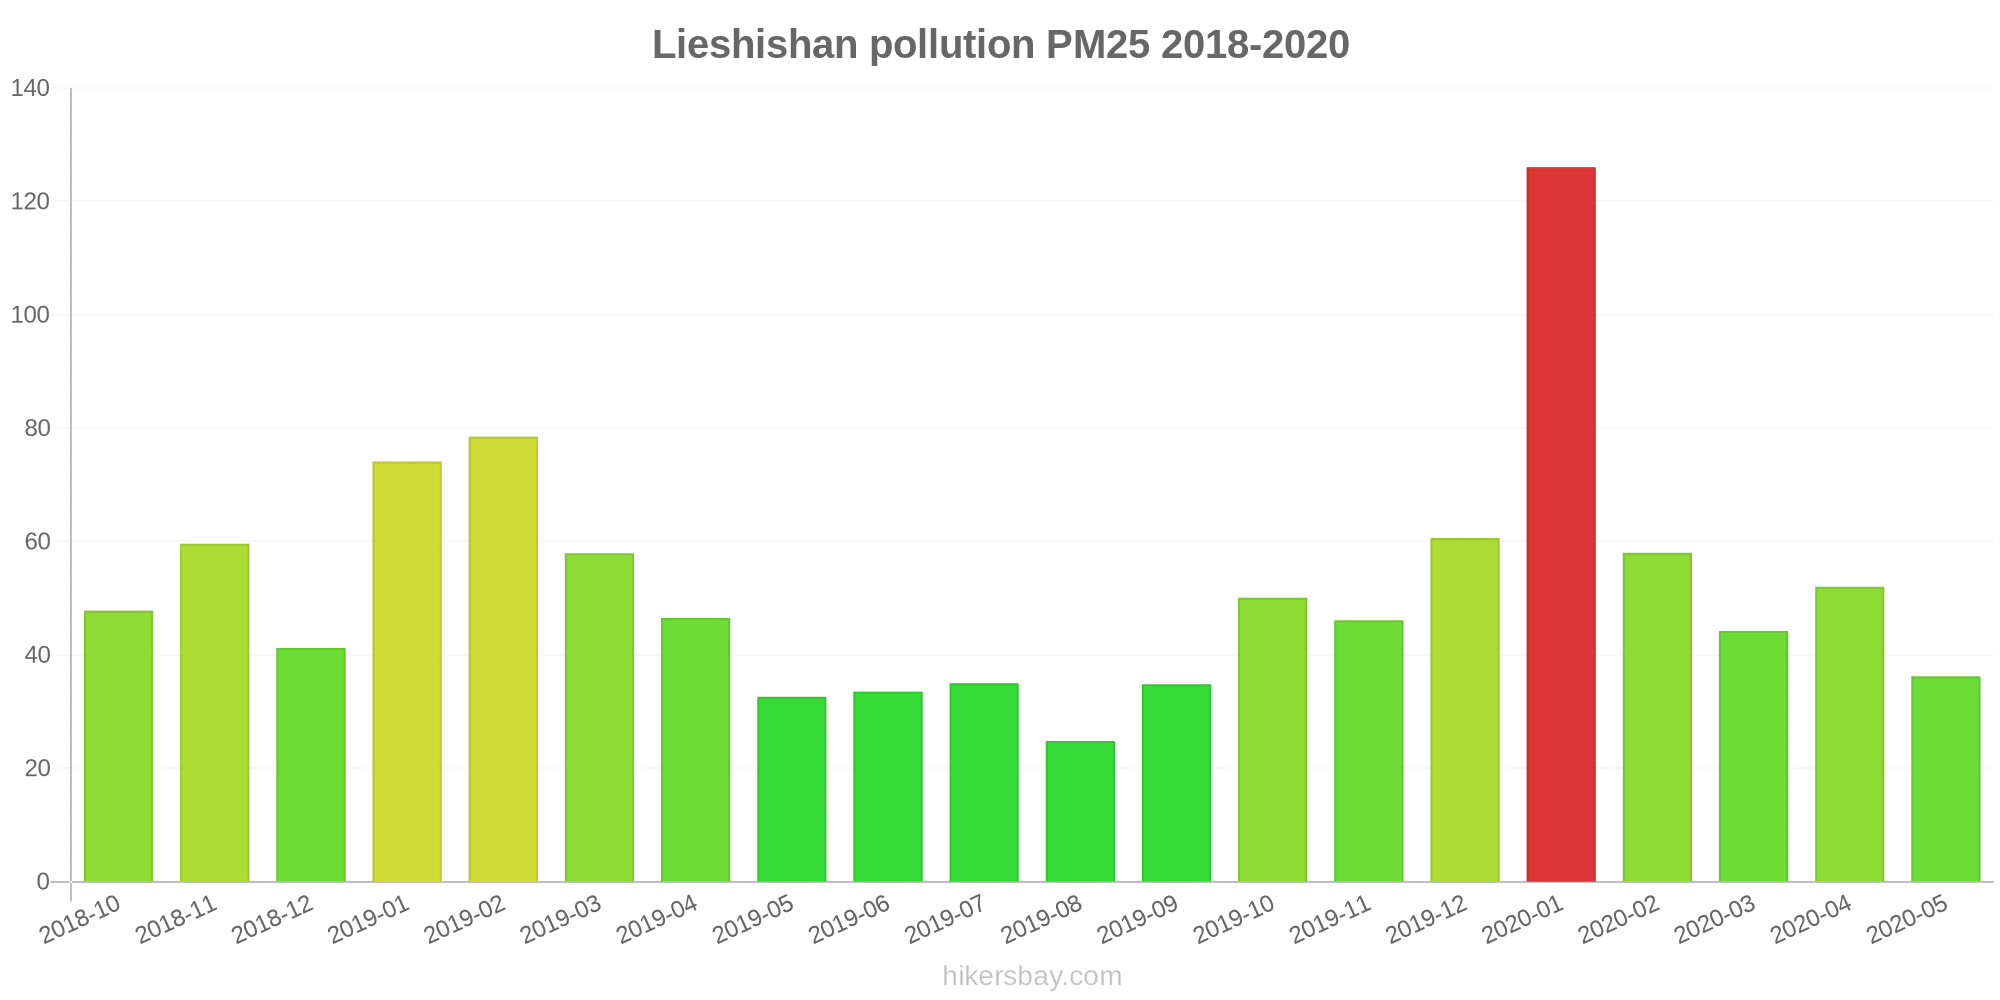
The highest PM2.5 values were recorded: 126 (January 2020).
The lowest level of particulate matter PM2.5 pollution occurs in month: August (25).
How high is the CO level? (carbon monoxide (CO))
100 (Good)
How high is the level of NO2? (nitrogen dioxide (NO2))
8 (Good)
How is the O3 level today in Lieshishan? (ozone (O3))
0 (Good)
What is the level of SO2 pollution? (sulfur dioxide (SO2))
9 (Good)
Current data Friday, May 27, 2022, 12:00 PM
PM10 7 (Good)
PM2,5 2 (Good)
CO 100 (Good)
NO2 8 (Good)
O3 0 (Good)
SO2 9 (Good)
Data on air pollution from recent days in Lieshishan
index
2022-05-27
pm10
32
Moderate
pm25
24
Moderate
co
468
Good
no2
21
Good
o3
32
Good
so2
5
Good
data source »
Air pollution in Lieshishan from October 2018 to May 2020

index
2020-05
2020-04
2020-03
2020-02
2020-01
2019-12
2019-11
2019-10
2019-09
2019-08
2019-07
2019-06
2019-05
2019-04
2019-03
2019-02
2019-01
2018-12
2018-11
2018-10
pm25
36 (Unhealthy for Sensitive Groups)
52 (Unhealthy for Sensitive Groups)
44 (Unhealthy for Sensitive Groups)
58 (Unhealthy)
126 (Very bad Hazardous)
61 (Unhealthy)
46 (Unhealthy for Sensitive Groups)
50 (Unhealthy for Sensitive Groups)
35 (Moderate)
25 (Moderate)
35 (Unhealthy for Sensitive Groups)
34 (Moderate)
33 (Moderate)
47 (Unhealthy for Sensitive Groups)
58 (Unhealthy)
79 (Very Unhealthy)
74 (Unhealthy)
41 (Unhealthy for Sensitive Groups)
60 (Unhealthy)
48 (Unhealthy for Sensitive Groups)
co
1 (Good)
1 (Good)
1 (Good)
1 (Good)
2 (Good)
1 (Good)
1 (Good)
1 (Good)
1 (Good)
1 (Good)
1 (Good)
1 (Good)
1 (Good)
1 (Good)
1 (Good)
1 (Good)
1 (Good)
1 (Good)
1 (Good)
1 (Good)
no2
24 (Good)
32 (Good)
34 (Good)
37 (Good)
60 (Moderate)
47 (Moderate)
47 (Moderate)
46 (Moderate)
39 (Good)
24 (Good)
22 (Good)
29 (Good)
28 (Good)
36 (Good)
43 (Moderate)
47 (Moderate)
51 (Moderate)
40 (Good)
47 (Moderate)
47 (Moderate)
o3
148 (Unhealthy for Sensitive Groups)
136 (Unhealthy for Sensitive Groups)
101 (Moderate)
74 (Moderate)
56 (Good)
55 (Good)
56 (Good)
94 (Moderate)
128 (Unhealthy for Sensitive Groups)
117 (Moderate)
173 (Unhealthy)
154 (Unhealthy)
151 (Unhealthy)
118 (Moderate)
102 (Moderate)
81 (Moderate)
58 (Good)
52 (Good)
66 (Good)
87 (Moderate)
pm10
78 (Unhealthy for Sensitive Groups)
117 (Very Unhealthy)
85 (Unhealthy)
88 (Unhealthy)
187 (Very bad Hazardous)
108 (Unhealthy)
105 (Unhealthy)
118 (Very Unhealthy)
85 (Unhealthy)
51 (Unhealthy for Sensitive Groups)
66 (Unhealthy for Sensitive Groups)
69 (Unhealthy for Sensitive Groups)
86 (Unhealthy)
123 (Very Unhealthy)
107 (Unhealthy)
124 (Very Unhealthy)
145 (Very Unhealthy)
85 (Unhealthy)
117 (Very Unhealthy)
108 (Unhealthy)
so2
13 (Good)
22 (Good)
23 (Good)
27 (Good)
36 (Good)
30 (Good)
33 (Good)
27 (Good)
20 (Good)
11 (Good)
10 (Good)
13 (Good)
16 (Good)
19 (Good)
24 (Good)
34 (Good)
34 (Good)
26 (Good)
30 (Good)
23 (Good)
data source »
铁西三道街
Friday, May 27, 2022, 12:00 PM
PM10 6.7 (Good)
particulate matter (PM10) suspended dust
PM2,5 1.7 (Good)
particulate matter (PM2.5) dust
CO 100 (Good)
carbon monoxide (CO)
NO2 7.6 (Good)
nitrogen dioxide (NO2)
O3 0.02 (Good)
ozone (O3)
SO2 8.6 (Good)
sulfur dioxide (SO2)
铁西三道街
index
2022-05-27
pm10
32
pm25
24
co
468
no2
21
o3
32
so2
4.6
铁西三道街
2018-10 2020-05

index
2020-05
2020-04
2020-03
2020-02
2020-01
2019-12
2019-11
2019-10
2019-09
2019-08
2019-07
2019-06
2019-05
2019-04
2019-03
2019-02
2019-01
2018-12
2018-11
2018-10
pm25
36
52
44
58
126
61
46
50
35
25
35
34
33
47
58
79
74
41
60
48
co
1
1
1
1
2
1
1
1
1
1
1
1
1
1
1
1
1
1
1
1
no2
24
32
34
37
60
47
47
46
39
24
22
29
28
36
43
47
51
40
47
47
o3
148
136
101
74
56
55
56
94
128
117
173
154
151
118
102
81
58
52
66
87
pm10
78
117
85
88
187
108
105
118
85
51
66
69
86
123
107
124
145
85
117
108
so2
13
22
23
27
36
30
33
27
20
11
10
13
16
19
24
34
34
26
30
23
* Pollution data source:
https://openaq.org
(ChinaAQIData)
The data is licensed under CC-By 4.0
PM10 7 (Good)
PM2,5 2 (Good)
CO 100 (Good)
NO2 8 (Good)
O3 0 (Good)
SO2 9 (Good)
Data on air pollution from recent days in Lieshishan
| index | 2022-05-27 |
|---|---|
| pm10 | 32 Moderate |
| pm25 | 24 Moderate |
| co | 468 Good |
| no2 | 21 Good |
| o3 | 32 Good |
| so2 | 5 Good |
| index | 2020-05 | 2020-04 | 2020-03 | 2020-02 | 2020-01 | 2019-12 | 2019-11 | 2019-10 | 2019-09 | 2019-08 | 2019-07 | 2019-06 | 2019-05 | 2019-04 | 2019-03 | 2019-02 | 2019-01 | 2018-12 | 2018-11 | 2018-10 |
|---|---|---|---|---|---|---|---|---|---|---|---|---|---|---|---|---|---|---|---|---|
| pm25 | 36 (Unhealthy for Sensitive Groups) | 52 (Unhealthy for Sensitive Groups) | 44 (Unhealthy for Sensitive Groups) | 58 (Unhealthy) | 126 (Very bad Hazardous) | 61 (Unhealthy) | 46 (Unhealthy for Sensitive Groups) | 50 (Unhealthy for Sensitive Groups) | 35 (Moderate) | 25 (Moderate) | 35 (Unhealthy for Sensitive Groups) | 34 (Moderate) | 33 (Moderate) | 47 (Unhealthy for Sensitive Groups) | 58 (Unhealthy) | 79 (Very Unhealthy) | 74 (Unhealthy) | 41 (Unhealthy for Sensitive Groups) | 60 (Unhealthy) | 48 (Unhealthy for Sensitive Groups) |
| co | 1 (Good) | 1 (Good) | 1 (Good) | 1 (Good) | 2 (Good) | 1 (Good) | 1 (Good) | 1 (Good) | 1 (Good) | 1 (Good) | 1 (Good) | 1 (Good) | 1 (Good) | 1 (Good) | 1 (Good) | 1 (Good) | 1 (Good) | 1 (Good) | 1 (Good) | 1 (Good) |
| no2 | 24 (Good) | 32 (Good) | 34 (Good) | 37 (Good) | 60 (Moderate) | 47 (Moderate) | 47 (Moderate) | 46 (Moderate) | 39 (Good) | 24 (Good) | 22 (Good) | 29 (Good) | 28 (Good) | 36 (Good) | 43 (Moderate) | 47 (Moderate) | 51 (Moderate) | 40 (Good) | 47 (Moderate) | 47 (Moderate) |
| o3 | 148 (Unhealthy for Sensitive Groups) | 136 (Unhealthy for Sensitive Groups) | 101 (Moderate) | 74 (Moderate) | 56 (Good) | 55 (Good) | 56 (Good) | 94 (Moderate) | 128 (Unhealthy for Sensitive Groups) | 117 (Moderate) | 173 (Unhealthy) | 154 (Unhealthy) | 151 (Unhealthy) | 118 (Moderate) | 102 (Moderate) | 81 (Moderate) | 58 (Good) | 52 (Good) | 66 (Good) | 87 (Moderate) |
| pm10 | 78 (Unhealthy for Sensitive Groups) | 117 (Very Unhealthy) | 85 (Unhealthy) | 88 (Unhealthy) | 187 (Very bad Hazardous) | 108 (Unhealthy) | 105 (Unhealthy) | 118 (Very Unhealthy) | 85 (Unhealthy) | 51 (Unhealthy for Sensitive Groups) | 66 (Unhealthy for Sensitive Groups) | 69 (Unhealthy for Sensitive Groups) | 86 (Unhealthy) | 123 (Very Unhealthy) | 107 (Unhealthy) | 124 (Very Unhealthy) | 145 (Very Unhealthy) | 85 (Unhealthy) | 117 (Very Unhealthy) | 108 (Unhealthy) |
| so2 | 13 (Good) | 22 (Good) | 23 (Good) | 27 (Good) | 36 (Good) | 30 (Good) | 33 (Good) | 27 (Good) | 20 (Good) | 11 (Good) | 10 (Good) | 13 (Good) | 16 (Good) | 19 (Good) | 24 (Good) | 34 (Good) | 34 (Good) | 26 (Good) | 30 (Good) | 23 (Good) |
PM10 6.7 (Good)
particulate matter (PM10) suspended dustPM2,5 1.7 (Good)
particulate matter (PM2.5) dustCO 100 (Good)
carbon monoxide (CO)NO2 7.6 (Good)
nitrogen dioxide (NO2)O3 0.02 (Good)
ozone (O3)SO2 8.6 (Good)
sulfur dioxide (SO2)铁西三道街
| index | 2022-05-27 |
|---|---|
| pm10 | 32 |
| pm25 | 24 |
| co | 468 |
| no2 | 21 |
| o3 | 32 |
| so2 | 4.6 |
铁西三道街

| index | 2020-05 | 2020-04 | 2020-03 | 2020-02 | 2020-01 | 2019-12 | 2019-11 | 2019-10 | 2019-09 | 2019-08 | 2019-07 | 2019-06 | 2019-05 | 2019-04 | 2019-03 | 2019-02 | 2019-01 | 2018-12 | 2018-11 | 2018-10 |
|---|---|---|---|---|---|---|---|---|---|---|---|---|---|---|---|---|---|---|---|---|
| pm25 | 36 | 52 | 44 | 58 | 126 | 61 | 46 | 50 | 35 | 25 | 35 | 34 | 33 | 47 | 58 | 79 | 74 | 41 | 60 | 48 |
| co | 1 | 1 | 1 | 1 | 2 | 1 | 1 | 1 | 1 | 1 | 1 | 1 | 1 | 1 | 1 | 1 | 1 | 1 | 1 | 1 |
| no2 | 24 | 32 | 34 | 37 | 60 | 47 | 47 | 46 | 39 | 24 | 22 | 29 | 28 | 36 | 43 | 47 | 51 | 40 | 47 | 47 |
| o3 | 148 | 136 | 101 | 74 | 56 | 55 | 56 | 94 | 128 | 117 | 173 | 154 | 151 | 118 | 102 | 81 | 58 | 52 | 66 | 87 |
| pm10 | 78 | 117 | 85 | 88 | 187 | 108 | 105 | 118 | 85 | 51 | 66 | 69 | 86 | 123 | 107 | 124 | 145 | 85 | 117 | 108 |
| so2 | 13 | 22 | 23 | 27 | 36 | 30 | 33 | 27 | 20 | 11 | 10 | 13 | 16 | 19 | 24 | 34 | 34 | 26 | 30 | 23 |