Air Pollution in Xinhecun: Real-time Air Quality Index and smog alert.
Pollution and air quality forecast for Xinhecun. Today is Tuesday, June 16, 2026. The following air pollution values have been recorded for Xinhecun:- particulate matter (PM10) suspended dust - 7 (Good)
- particulate matter (PM2.5) dust - 2 (Good)
- carbon monoxide (CO) - 100 (Good)
- nitrogen dioxide (NO2) - 8 (Good)
- ozone (O3) - 0 (Good)
- sulfur dioxide (SO2) - 9 (Good)

What is the air quality in Xinhecun today? Is the air polluted in Xinhecun?. Is there smog?
What is the level of PM10 today in Xinhecun? (particulate matter (PM10) suspended dust)
The current level of particulate matter PM10 in Xinhecun is:
7 (Good)
The highest PM10 values usually occur in month: 146 (January 2020).
The lowest value of particulate matter PM10 pollution in Xinhecun is usually recorded in: August (38).
What is the current level of PM2.5 in Xinhecun? (particulate matter (PM2.5) dust)
Today's PM2.5 level is:
2 (Good)
For comparison, the highest level of PM2.5 in Xinhecun in the last 7 days was: 24 (Friday, May 27, 2022) and the lowest: 24 (Friday, May 27, 2022).
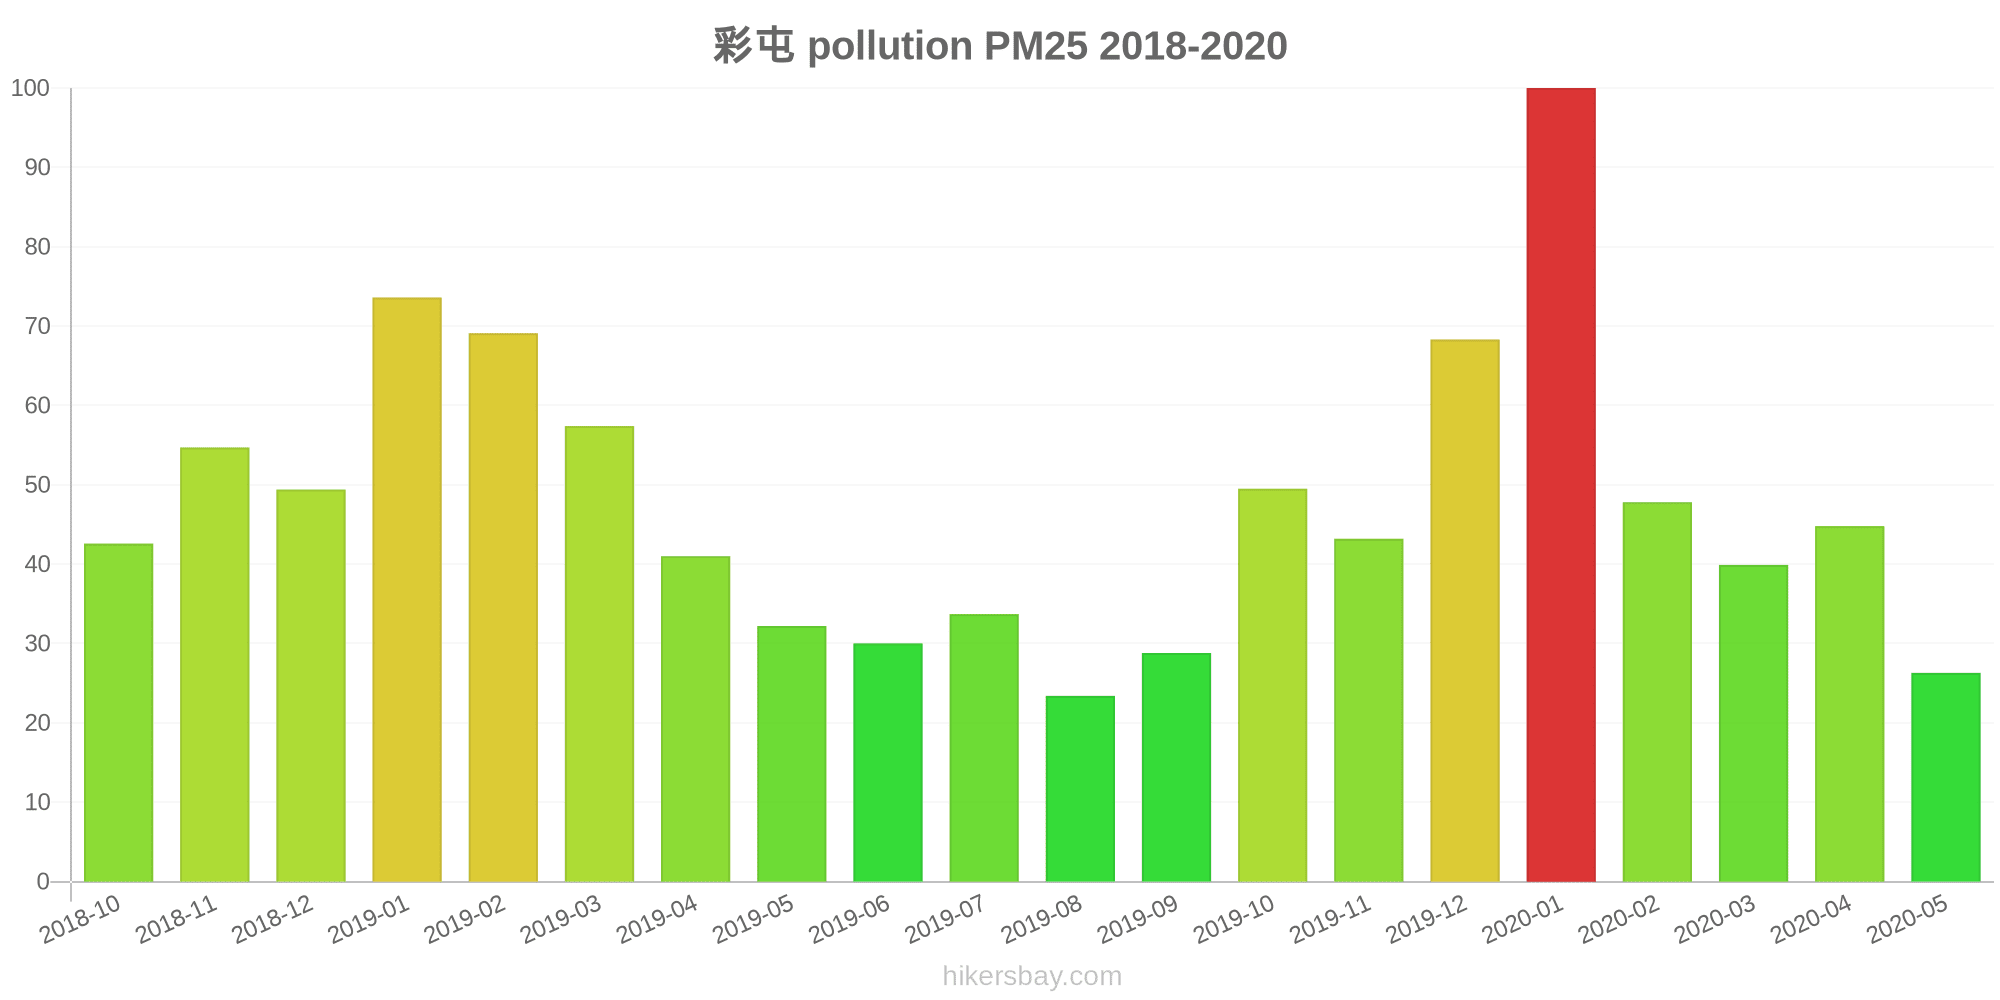
The highest PM2.5 values were recorded: 100 (January 2020).
The lowest level of particulate matter PM2.5 pollution occurs in month: August (23).
How high is the CO level? (carbon monoxide (CO))
100 (Good)
How high is the level of NO2? (nitrogen dioxide (NO2))
8 (Good)
How is the O3 level today in Xinhecun? (ozone (O3))
0 (Good)
What is the level of SO2 pollution? (sulfur dioxide (SO2))
9 (Good)
Current data Friday, May 27, 2022, 12:00 PM
PM10 7 (Good)
PM2,5 2 (Good)
CO 100 (Good)
NO2 8 (Good)
O3 0 (Good)
SO2 9 (Good)
Data on air pollution from recent days in Xinhecun
index
2022-05-27
pm10
32
Moderate
pm25
24
Moderate
co
468
Good
no2
21
Good
o3
32
Good
so2
5
Good
data source »
Air pollution in Xinhecun from October 2018 to May 2020

index
2020-05
2020-04
2020-03
2020-02
2020-01
2019-12
2019-11
2019-10
2019-09
2019-08
2019-07
2019-06
2019-05
2019-04
2019-03
2019-02
2019-01
2018-12
2018-11
2018-10
pm25
26 (Moderate)
45 (Unhealthy for Sensitive Groups)
40 (Unhealthy for Sensitive Groups)
48 (Unhealthy for Sensitive Groups)
100 (Very Unhealthy)
68 (Unhealthy)
43 (Unhealthy for Sensitive Groups)
50 (Unhealthy for Sensitive Groups)
29 (Moderate)
23 (Moderate)
34 (Moderate)
30 (Moderate)
32 (Moderate)
41 (Unhealthy for Sensitive Groups)
57 (Unhealthy)
69 (Unhealthy)
74 (Unhealthy)
49 (Unhealthy for Sensitive Groups)
55 (Unhealthy for Sensitive Groups)
43 (Unhealthy for Sensitive Groups)
co
1 (Good)
1 (Good)
1 (Good)
1 (Good)
2 (Good)
1 (Good)
1 (Good)
1 (Good)
1 (Good)
1 (Good)
1 (Good)
1 (Good)
1 (Good)
1 (Good)
1 (Good)
1 (Good)
1 (Good)
1 (Good)
1 (Good)
1 (Good)
no2
31 (Good)
34 (Good)
30 (Good)
32 (Good)
48 (Moderate)
41 (Moderate)
42 (Moderate)
42 (Moderate)
35 (Good)
25 (Good)
34 (Good)
36 (Good)
34 (Good)
36 (Good)
37 (Good)
38 (Good)
41 (Moderate)
36 (Good)
38 (Good)
34 (Good)
o3
111 (Moderate)
123 (Unhealthy for Sensitive Groups)
90 (Moderate)
73 (Moderate)
63 (Good)
53 (Good)
54 (Good)
94 (Moderate)
115 (Moderate)
94 (Moderate)
121 (Unhealthy for Sensitive Groups)
124 (Unhealthy for Sensitive Groups)
126 (Unhealthy for Sensitive Groups)
103 (Moderate)
98 (Moderate)
76 (Moderate)
56 (Good)
47 (Good)
57 (Good)
71 (Moderate)
pm10
66 (Unhealthy for Sensitive Groups)
102 (Unhealthy)
79 (Unhealthy for Sensitive Groups)
83 (Unhealthy)
146 (Very Unhealthy)
102 (Unhealthy)
82 (Unhealthy)
88 (Unhealthy)
58 (Unhealthy for Sensitive Groups)
38 (Moderate)
51 (Unhealthy for Sensitive Groups)
47 (Moderate)
67 (Unhealthy for Sensitive Groups)
88 (Unhealthy)
91 (Unhealthy)
99 (Unhealthy)
117 (Very Unhealthy)
82 (Unhealthy)
91 (Unhealthy)
75 (Unhealthy for Sensitive Groups)
so2
27 (Good)
29 (Good)
30 (Good)
30 (Good)
38 (Good)
36 (Good)
33 (Good)
18 (Good)
15 (Good)
12 (Good)
17 (Good)
23 (Good)
29 (Good)
26 (Good)
26 (Good)
29 (Good)
28 (Good)
31 (Good)
31 (Good)
23 (Good)
data source »
彩屯
Friday, May 27, 2022, 12:00 PM
PM10 6.7 (Good)
particulate matter (PM10) suspended dust
PM2,5 1.7 (Good)
particulate matter (PM2.5) dust
CO 100 (Good)
carbon monoxide (CO)
NO2 7.6 (Good)
nitrogen dioxide (NO2)
O3 0.02 (Good)
ozone (O3)
SO2 8.6 (Good)
sulfur dioxide (SO2)
彩屯
index
2022-05-27
pm10
32
pm25
24
co
468
no2
21
o3
32
so2
4.6
彩屯
2018-10 2020-05

index
2020-05
2020-04
2020-03
2020-02
2020-01
2019-12
2019-11
2019-10
2019-09
2019-08
2019-07
2019-06
2019-05
2019-04
2019-03
2019-02
2019-01
2018-12
2018-11
2018-10
pm25
26
45
40
48
100
68
43
50
29
23
34
30
32
41
57
69
74
49
55
43
co
1
1
1
1
2
1
1
1
1
1
1
1
1
1
1
1
1
1
1
1
no2
31
34
30
32
48
41
42
42
35
25
34
36
34
36
37
38
41
36
38
34
o3
111
123
90
73
63
53
54
94
115
94
121
124
126
103
98
76
56
47
57
71
pm10
66
102
79
83
146
102
82
88
58
38
51
47
67
88
91
99
117
82
91
75
so2
27
29
30
30
38
36
33
18
15
12
17
23
29
26
26
29
28
31
31
23
* Pollution data source:
https://openaq.org
(ChinaAQIData)
The data is licensed under CC-By 4.0
PM10 7 (Good)
PM2,5 2 (Good)
CO 100 (Good)
NO2 8 (Good)
O3 0 (Good)
SO2 9 (Good)
Data on air pollution from recent days in Xinhecun
| index | 2022-05-27 |
|---|---|
| pm10 | 32 Moderate |
| pm25 | 24 Moderate |
| co | 468 Good |
| no2 | 21 Good |
| o3 | 32 Good |
| so2 | 5 Good |

| index | 2020-05 | 2020-04 | 2020-03 | 2020-02 | 2020-01 | 2019-12 | 2019-11 | 2019-10 | 2019-09 | 2019-08 | 2019-07 | 2019-06 | 2019-05 | 2019-04 | 2019-03 | 2019-02 | 2019-01 | 2018-12 | 2018-11 | 2018-10 |
|---|---|---|---|---|---|---|---|---|---|---|---|---|---|---|---|---|---|---|---|---|
| pm25 | 26 (Moderate) | 45 (Unhealthy for Sensitive Groups) | 40 (Unhealthy for Sensitive Groups) | 48 (Unhealthy for Sensitive Groups) | 100 (Very Unhealthy) | 68 (Unhealthy) | 43 (Unhealthy for Sensitive Groups) | 50 (Unhealthy for Sensitive Groups) | 29 (Moderate) | 23 (Moderate) | 34 (Moderate) | 30 (Moderate) | 32 (Moderate) | 41 (Unhealthy for Sensitive Groups) | 57 (Unhealthy) | 69 (Unhealthy) | 74 (Unhealthy) | 49 (Unhealthy for Sensitive Groups) | 55 (Unhealthy for Sensitive Groups) | 43 (Unhealthy for Sensitive Groups) |
| co | 1 (Good) | 1 (Good) | 1 (Good) | 1 (Good) | 2 (Good) | 1 (Good) | 1 (Good) | 1 (Good) | 1 (Good) | 1 (Good) | 1 (Good) | 1 (Good) | 1 (Good) | 1 (Good) | 1 (Good) | 1 (Good) | 1 (Good) | 1 (Good) | 1 (Good) | 1 (Good) |
| no2 | 31 (Good) | 34 (Good) | 30 (Good) | 32 (Good) | 48 (Moderate) | 41 (Moderate) | 42 (Moderate) | 42 (Moderate) | 35 (Good) | 25 (Good) | 34 (Good) | 36 (Good) | 34 (Good) | 36 (Good) | 37 (Good) | 38 (Good) | 41 (Moderate) | 36 (Good) | 38 (Good) | 34 (Good) |
| o3 | 111 (Moderate) | 123 (Unhealthy for Sensitive Groups) | 90 (Moderate) | 73 (Moderate) | 63 (Good) | 53 (Good) | 54 (Good) | 94 (Moderate) | 115 (Moderate) | 94 (Moderate) | 121 (Unhealthy for Sensitive Groups) | 124 (Unhealthy for Sensitive Groups) | 126 (Unhealthy for Sensitive Groups) | 103 (Moderate) | 98 (Moderate) | 76 (Moderate) | 56 (Good) | 47 (Good) | 57 (Good) | 71 (Moderate) |
| pm10 | 66 (Unhealthy for Sensitive Groups) | 102 (Unhealthy) | 79 (Unhealthy for Sensitive Groups) | 83 (Unhealthy) | 146 (Very Unhealthy) | 102 (Unhealthy) | 82 (Unhealthy) | 88 (Unhealthy) | 58 (Unhealthy for Sensitive Groups) | 38 (Moderate) | 51 (Unhealthy for Sensitive Groups) | 47 (Moderate) | 67 (Unhealthy for Sensitive Groups) | 88 (Unhealthy) | 91 (Unhealthy) | 99 (Unhealthy) | 117 (Very Unhealthy) | 82 (Unhealthy) | 91 (Unhealthy) | 75 (Unhealthy for Sensitive Groups) |
| so2 | 27 (Good) | 29 (Good) | 30 (Good) | 30 (Good) | 38 (Good) | 36 (Good) | 33 (Good) | 18 (Good) | 15 (Good) | 12 (Good) | 17 (Good) | 23 (Good) | 29 (Good) | 26 (Good) | 26 (Good) | 29 (Good) | 28 (Good) | 31 (Good) | 31 (Good) | 23 (Good) |
PM10 6.7 (Good)
particulate matter (PM10) suspended dustPM2,5 1.7 (Good)
particulate matter (PM2.5) dustCO 100 (Good)
carbon monoxide (CO)NO2 7.6 (Good)
nitrogen dioxide (NO2)O3 0.02 (Good)
ozone (O3)SO2 8.6 (Good)
sulfur dioxide (SO2)彩屯
| index | 2022-05-27 |
|---|---|
| pm10 | 32 |
| pm25 | 24 |
| co | 468 |
| no2 | 21 |
| o3 | 32 |
| so2 | 4.6 |
彩屯
| index | 2020-05 | 2020-04 | 2020-03 | 2020-02 | 2020-01 | 2019-12 | 2019-11 | 2019-10 | 2019-09 | 2019-08 | 2019-07 | 2019-06 | 2019-05 | 2019-04 | 2019-03 | 2019-02 | 2019-01 | 2018-12 | 2018-11 | 2018-10 |
|---|---|---|---|---|---|---|---|---|---|---|---|---|---|---|---|---|---|---|---|---|
| pm25 | 26 | 45 | 40 | 48 | 100 | 68 | 43 | 50 | 29 | 23 | 34 | 30 | 32 | 41 | 57 | 69 | 74 | 49 | 55 | 43 |
| co | 1 | 1 | 1 | 1 | 2 | 1 | 1 | 1 | 1 | 1 | 1 | 1 | 1 | 1 | 1 | 1 | 1 | 1 | 1 | 1 |
| no2 | 31 | 34 | 30 | 32 | 48 | 41 | 42 | 42 | 35 | 25 | 34 | 36 | 34 | 36 | 37 | 38 | 41 | 36 | 38 | 34 |
| o3 | 111 | 123 | 90 | 73 | 63 | 53 | 54 | 94 | 115 | 94 | 121 | 124 | 126 | 103 | 98 | 76 | 56 | 47 | 57 | 71 |
| pm10 | 66 | 102 | 79 | 83 | 146 | 102 | 82 | 88 | 58 | 38 | 51 | 47 | 67 | 88 | 91 | 99 | 117 | 82 | 91 | 75 |
| so2 | 27 | 29 | 30 | 30 | 38 | 36 | 33 | 18 | 15 | 12 | 17 | 23 | 29 | 26 | 26 | 29 | 28 | 31 | 31 | 23 |