Air Pollution in Nanhu: Real-time Air Quality Index and smog alert.
Pollution and air quality forecast for Nanhu. Today is Tuesday, June 16, 2026. The following air pollution values have been recorded for Nanhu:- particulate matter (PM10) suspended dust - 7 (Good)
- particulate matter (PM2.5) dust - 2 (Good)
- carbon monoxide (CO) - 100 (Good)
- nitrogen dioxide (NO2) - 8 (Good)
- ozone (O3) - 0 (Good)
- sulfur dioxide (SO2) - 9 (Good)

What is the air quality in Nanhu today? Is the air polluted in Nanhu?. Is there smog?
What is the level of PM10 today in Nanhu? (particulate matter (PM10) suspended dust)
The current level of particulate matter PM10 in Nanhu is:
7 (Good)
The highest PM10 values usually occur in month: 121 (January 2020).
The lowest value of particulate matter PM10 pollution in Nanhu is usually recorded in: August (28).
What is the current level of PM2.5 in Nanhu? (particulate matter (PM2.5) dust)
Today's PM2.5 level is:
2 (Good)
For comparison, the highest level of PM2.5 in Nanhu in the last 7 days was: 24 (Friday, May 27, 2022) and the lowest: 24 (Friday, May 27, 2022).
The highest PM2.5 values were recorded: 109 (January 2020).
The lowest level of particulate matter PM2.5 pollution occurs in month: August (18).
How high is the CO level? (carbon monoxide (CO))
100 (Good)
How high is the level of NO2? (nitrogen dioxide (NO2))
8 (Good)
How is the O3 level today in Nanhu? (ozone (O3))
0 (Good)
What is the level of SO2 pollution? (sulfur dioxide (SO2))
9 (Good)
Current data Friday, May 27, 2022, 12:00 PM
PM10 7 (Good)
PM2,5 2 (Good)
CO 100 (Good)
NO2 8 (Good)
O3 0 (Good)
SO2 9 (Good)
Data on air pollution from recent days in Nanhu
index
2022-05-27
pm10
32
Moderate
pm25
24
Moderate
co
468
Good
no2
21
Good
o3
32
Good
so2
5
Good
data source »
Air pollution in Nanhu from October 2018 to May 2020
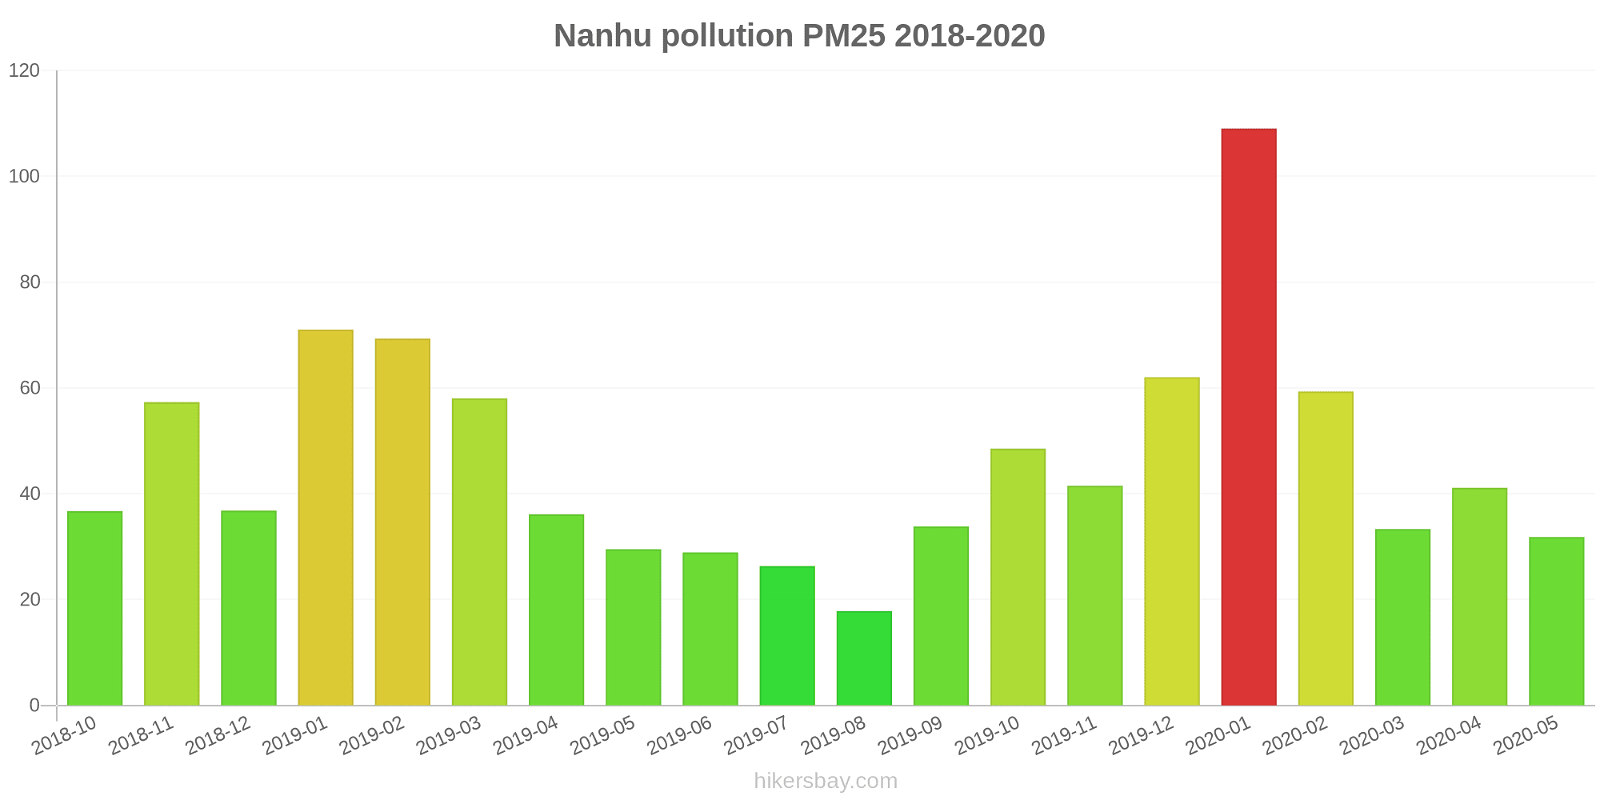
index
2020-05
2020-04
2020-03
2020-02
2020-01
2019-12
2019-11
2019-10
2019-09
2019-08
2019-07
2019-06
2019-05
2019-04
2019-03
2019-02
2019-01
2018-12
2018-11
2018-10
pm25
32 (Moderate)
41 (Unhealthy for Sensitive Groups)
33 (Moderate)
59 (Unhealthy)
109 (Very Unhealthy)
62 (Unhealthy)
42 (Unhealthy for Sensitive Groups)
49 (Unhealthy for Sensitive Groups)
34 (Moderate)
18 (Moderate)
26 (Moderate)
29 (Moderate)
30 (Moderate)
36 (Unhealthy for Sensitive Groups)
58 (Unhealthy)
69 (Unhealthy)
71 (Unhealthy)
37 (Unhealthy for Sensitive Groups)
57 (Unhealthy)
37 (Unhealthy for Sensitive Groups)
co
556 (Good)
644 (Good)
665 (Good)
774 (Good)
1 (Good)
1 (Good)
905 (Good)
724 (Good)
737 (Good)
608 (Good)
570 (Good)
507 (Good)
459 (Good)
509 (Good)
561 (Good)
789 (Good)
957 (Good)
632 (Good)
823 (Good)
510 (Good)
no2
22 (Good)
27 (Good)
25 (Good)
29 (Good)
50 (Moderate)
41 (Moderate)
35 (Good)
34 (Good)
26 (Good)
17 (Good)
14 (Good)
21 (Good)
24 (Good)
29 (Good)
35 (Good)
39 (Good)
45 (Moderate)
36 (Good)
44 (Moderate)
33 (Good)
o3
143 (Unhealthy for Sensitive Groups)
144 (Unhealthy for Sensitive Groups)
106 (Moderate)
88 (Moderate)
70 (Good)
60 (Good)
68 (Good)
116 (Moderate)
151 (Unhealthy)
130 (Unhealthy for Sensitive Groups)
169 (Unhealthy)
157 (Unhealthy)
157 (Unhealthy)
121 (Unhealthy for Sensitive Groups)
111 (Moderate)
78 (Moderate)
65 (Good)
63 (Good)
73 (Moderate)
107 (Moderate)
pm10
50 (Unhealthy for Sensitive Groups)
71 (Unhealthy for Sensitive Groups)
56 (Unhealthy for Sensitive Groups)
78 (Unhealthy for Sensitive Groups)
121 (Very Unhealthy)
78 (Unhealthy for Sensitive Groups)
64 (Unhealthy for Sensitive Groups)
78 (Unhealthy for Sensitive Groups)
56 (Unhealthy for Sensitive Groups)
28 (Moderate)
39 (Moderate)
39 (Moderate)
57 (Unhealthy for Sensitive Groups)
70 (Unhealthy for Sensitive Groups)
88 (Unhealthy)
91 (Unhealthy)
106 (Unhealthy)
64 (Unhealthy for Sensitive Groups)
93 (Unhealthy)
68 (Unhealthy for Sensitive Groups)
so2
9.1 (Good)
14 (Good)
11 (Good)
11 (Good)
23 (Good)
18 (Good)
16 (Good)
8.6 (Good)
8.1 (Good)
4.7 (Good)
4.7 (Good)
5.8 (Good)
7.8 (Good)
9 (Good)
12 (Good)
20 (Good)
25 (Good)
19 (Good)
18 (Good)
8.4 (Good)
data source »
学府南路
Friday, May 27, 2022, 12:00 PM
PM10 6.7 (Good)
particulate matter (PM10) suspended dust
PM2,5 1.7 (Good)
particulate matter (PM2.5) dust
CO 100 (Good)
carbon monoxide (CO)
NO2 7.6 (Good)
nitrogen dioxide (NO2)
O3 0.02 (Good)
ozone (O3)
SO2 8.6 (Good)
sulfur dioxide (SO2)
学府南路
index
2022-05-27
pm10
32
pm25
24
co
468
no2
21
o3
32
so2
4.6
学府南路
2018-10 2020-05
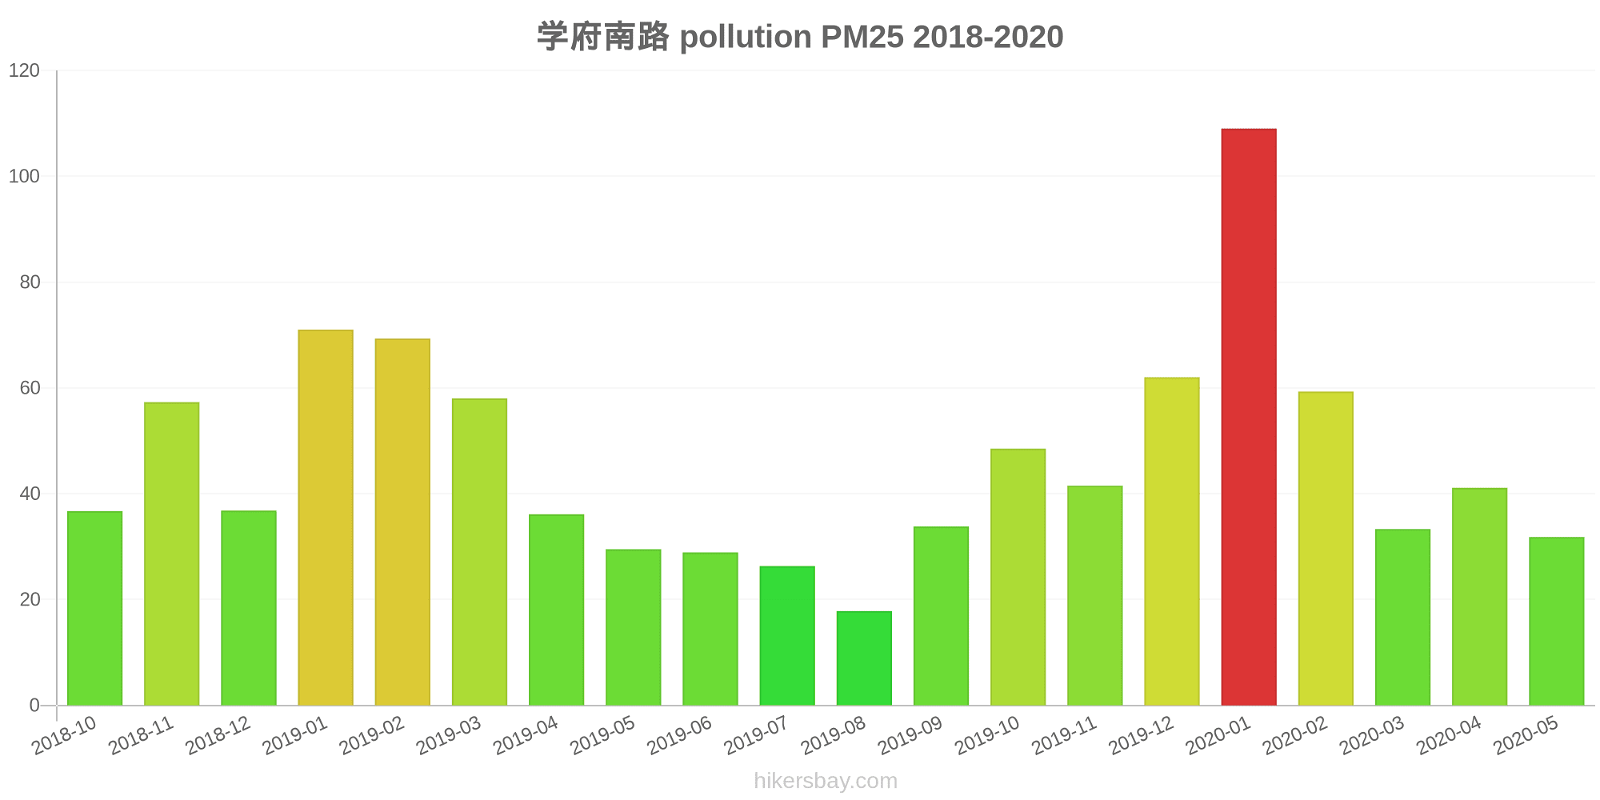
index
2020-05
2020-04
2020-03
2020-02
2020-01
2019-12
2019-11
2019-10
2019-09
2019-08
2019-07
2019-06
2019-05
2019-04
2019-03
2019-02
2019-01
2018-12
2018-11
2018-10
pm25
32
41
33
59
109
62
42
49
34
18
26
29
30
36
58
69
71
37
57
37
co
556
644
665
774
1
1
905
724
737
608
570
507
459
509
561
789
957
632
823
510
no2
22
27
25
29
50
41
35
34
26
17
14
21
24
29
35
39
45
36
44
33
o3
143
144
106
88
70
60
68
116
151
130
169
157
157
121
111
78
65
63
73
107
pm10
50
71
56
78
121
78
64
78
56
28
39
39
57
70
88
91
106
64
93
68
so2
9.1
14
11
11
23
18
16
8.6
8.1
4.7
4.7
5.8
7.8
9
12
20
25
19
18
8.4
* Pollution data source:
https://openaq.org
(ChinaAQIData)
The data is licensed under CC-By 4.0
PM10 7 (Good)
PM2,5 2 (Good)
CO 100 (Good)
NO2 8 (Good)
O3 0 (Good)
SO2 9 (Good)
Data on air pollution from recent days in Nanhu
| index | 2022-05-27 |
|---|---|
| pm10 | 32 Moderate |
| pm25 | 24 Moderate |
| co | 468 Good |
| no2 | 21 Good |
| o3 | 32 Good |
| so2 | 5 Good |

| index | 2020-05 | 2020-04 | 2020-03 | 2020-02 | 2020-01 | 2019-12 | 2019-11 | 2019-10 | 2019-09 | 2019-08 | 2019-07 | 2019-06 | 2019-05 | 2019-04 | 2019-03 | 2019-02 | 2019-01 | 2018-12 | 2018-11 | 2018-10 |
|---|---|---|---|---|---|---|---|---|---|---|---|---|---|---|---|---|---|---|---|---|
| pm25 | 32 (Moderate) | 41 (Unhealthy for Sensitive Groups) | 33 (Moderate) | 59 (Unhealthy) | 109 (Very Unhealthy) | 62 (Unhealthy) | 42 (Unhealthy for Sensitive Groups) | 49 (Unhealthy for Sensitive Groups) | 34 (Moderate) | 18 (Moderate) | 26 (Moderate) | 29 (Moderate) | 30 (Moderate) | 36 (Unhealthy for Sensitive Groups) | 58 (Unhealthy) | 69 (Unhealthy) | 71 (Unhealthy) | 37 (Unhealthy for Sensitive Groups) | 57 (Unhealthy) | 37 (Unhealthy for Sensitive Groups) |
| co | 556 (Good) | 644 (Good) | 665 (Good) | 774 (Good) | 1 (Good) | 1 (Good) | 905 (Good) | 724 (Good) | 737 (Good) | 608 (Good) | 570 (Good) | 507 (Good) | 459 (Good) | 509 (Good) | 561 (Good) | 789 (Good) | 957 (Good) | 632 (Good) | 823 (Good) | 510 (Good) |
| no2 | 22 (Good) | 27 (Good) | 25 (Good) | 29 (Good) | 50 (Moderate) | 41 (Moderate) | 35 (Good) | 34 (Good) | 26 (Good) | 17 (Good) | 14 (Good) | 21 (Good) | 24 (Good) | 29 (Good) | 35 (Good) | 39 (Good) | 45 (Moderate) | 36 (Good) | 44 (Moderate) | 33 (Good) |
| o3 | 143 (Unhealthy for Sensitive Groups) | 144 (Unhealthy for Sensitive Groups) | 106 (Moderate) | 88 (Moderate) | 70 (Good) | 60 (Good) | 68 (Good) | 116 (Moderate) | 151 (Unhealthy) | 130 (Unhealthy for Sensitive Groups) | 169 (Unhealthy) | 157 (Unhealthy) | 157 (Unhealthy) | 121 (Unhealthy for Sensitive Groups) | 111 (Moderate) | 78 (Moderate) | 65 (Good) | 63 (Good) | 73 (Moderate) | 107 (Moderate) |
| pm10 | 50 (Unhealthy for Sensitive Groups) | 71 (Unhealthy for Sensitive Groups) | 56 (Unhealthy for Sensitive Groups) | 78 (Unhealthy for Sensitive Groups) | 121 (Very Unhealthy) | 78 (Unhealthy for Sensitive Groups) | 64 (Unhealthy for Sensitive Groups) | 78 (Unhealthy for Sensitive Groups) | 56 (Unhealthy for Sensitive Groups) | 28 (Moderate) | 39 (Moderate) | 39 (Moderate) | 57 (Unhealthy for Sensitive Groups) | 70 (Unhealthy for Sensitive Groups) | 88 (Unhealthy) | 91 (Unhealthy) | 106 (Unhealthy) | 64 (Unhealthy for Sensitive Groups) | 93 (Unhealthy) | 68 (Unhealthy for Sensitive Groups) |
| so2 | 9.1 (Good) | 14 (Good) | 11 (Good) | 11 (Good) | 23 (Good) | 18 (Good) | 16 (Good) | 8.6 (Good) | 8.1 (Good) | 4.7 (Good) | 4.7 (Good) | 5.8 (Good) | 7.8 (Good) | 9 (Good) | 12 (Good) | 20 (Good) | 25 (Good) | 19 (Good) | 18 (Good) | 8.4 (Good) |
PM10 6.7 (Good)
particulate matter (PM10) suspended dustPM2,5 1.7 (Good)
particulate matter (PM2.5) dustCO 100 (Good)
carbon monoxide (CO)NO2 7.6 (Good)
nitrogen dioxide (NO2)O3 0.02 (Good)
ozone (O3)SO2 8.6 (Good)
sulfur dioxide (SO2)学府南路
| index | 2022-05-27 |
|---|---|
| pm10 | 32 |
| pm25 | 24 |
| co | 468 |
| no2 | 21 |
| o3 | 32 |
| so2 | 4.6 |
学府南路

| index | 2020-05 | 2020-04 | 2020-03 | 2020-02 | 2020-01 | 2019-12 | 2019-11 | 2019-10 | 2019-09 | 2019-08 | 2019-07 | 2019-06 | 2019-05 | 2019-04 | 2019-03 | 2019-02 | 2019-01 | 2018-12 | 2018-11 | 2018-10 |
|---|---|---|---|---|---|---|---|---|---|---|---|---|---|---|---|---|---|---|---|---|
| pm25 | 32 | 41 | 33 | 59 | 109 | 62 | 42 | 49 | 34 | 18 | 26 | 29 | 30 | 36 | 58 | 69 | 71 | 37 | 57 | 37 |
| co | 556 | 644 | 665 | 774 | 1 | 1 | 905 | 724 | 737 | 608 | 570 | 507 | 459 | 509 | 561 | 789 | 957 | 632 | 823 | 510 |
| no2 | 22 | 27 | 25 | 29 | 50 | 41 | 35 | 34 | 26 | 17 | 14 | 21 | 24 | 29 | 35 | 39 | 45 | 36 | 44 | 33 |
| o3 | 143 | 144 | 106 | 88 | 70 | 60 | 68 | 116 | 151 | 130 | 169 | 157 | 157 | 121 | 111 | 78 | 65 | 63 | 73 | 107 |
| pm10 | 50 | 71 | 56 | 78 | 121 | 78 | 64 | 78 | 56 | 28 | 39 | 39 | 57 | 70 | 88 | 91 | 106 | 64 | 93 | 68 |
| so2 | 9.1 | 14 | 11 | 11 | 23 | 18 | 16 | 8.6 | 8.1 | 4.7 | 4.7 | 5.8 | 7.8 | 9 | 12 | 20 | 25 | 19 | 18 | 8.4 |