Air Pollution in Xisanlicun: Real-time Air Quality Index and smog alert.
Pollution and air quality forecast for Xisanlicun. Today is Tuesday, June 16, 2026. The following air pollution values have been recorded for Xisanlicun:- particulate matter (PM10) suspended dust - 7 (Good)
- particulate matter (PM2.5) dust - 2 (Good)
- carbon monoxide (CO) - 100 (Good)
- nitrogen dioxide (NO2) - 8 (Good)
- ozone (O3) - 0 (Good)
- sulfur dioxide (SO2) - 9 (Good)

What is the air quality in Xisanlicun today? Is the air polluted in Xisanlicun?. Is there smog?
What is the level of PM10 today in Xisanlicun? (particulate matter (PM10) suspended dust)
The current level of particulate matter PM10 in Xisanlicun is:
7 (Good)
The highest PM10 values usually occur in month: 146 (January 2020).
The lowest value of particulate matter PM10 pollution in Xisanlicun is usually recorded in: August (35).
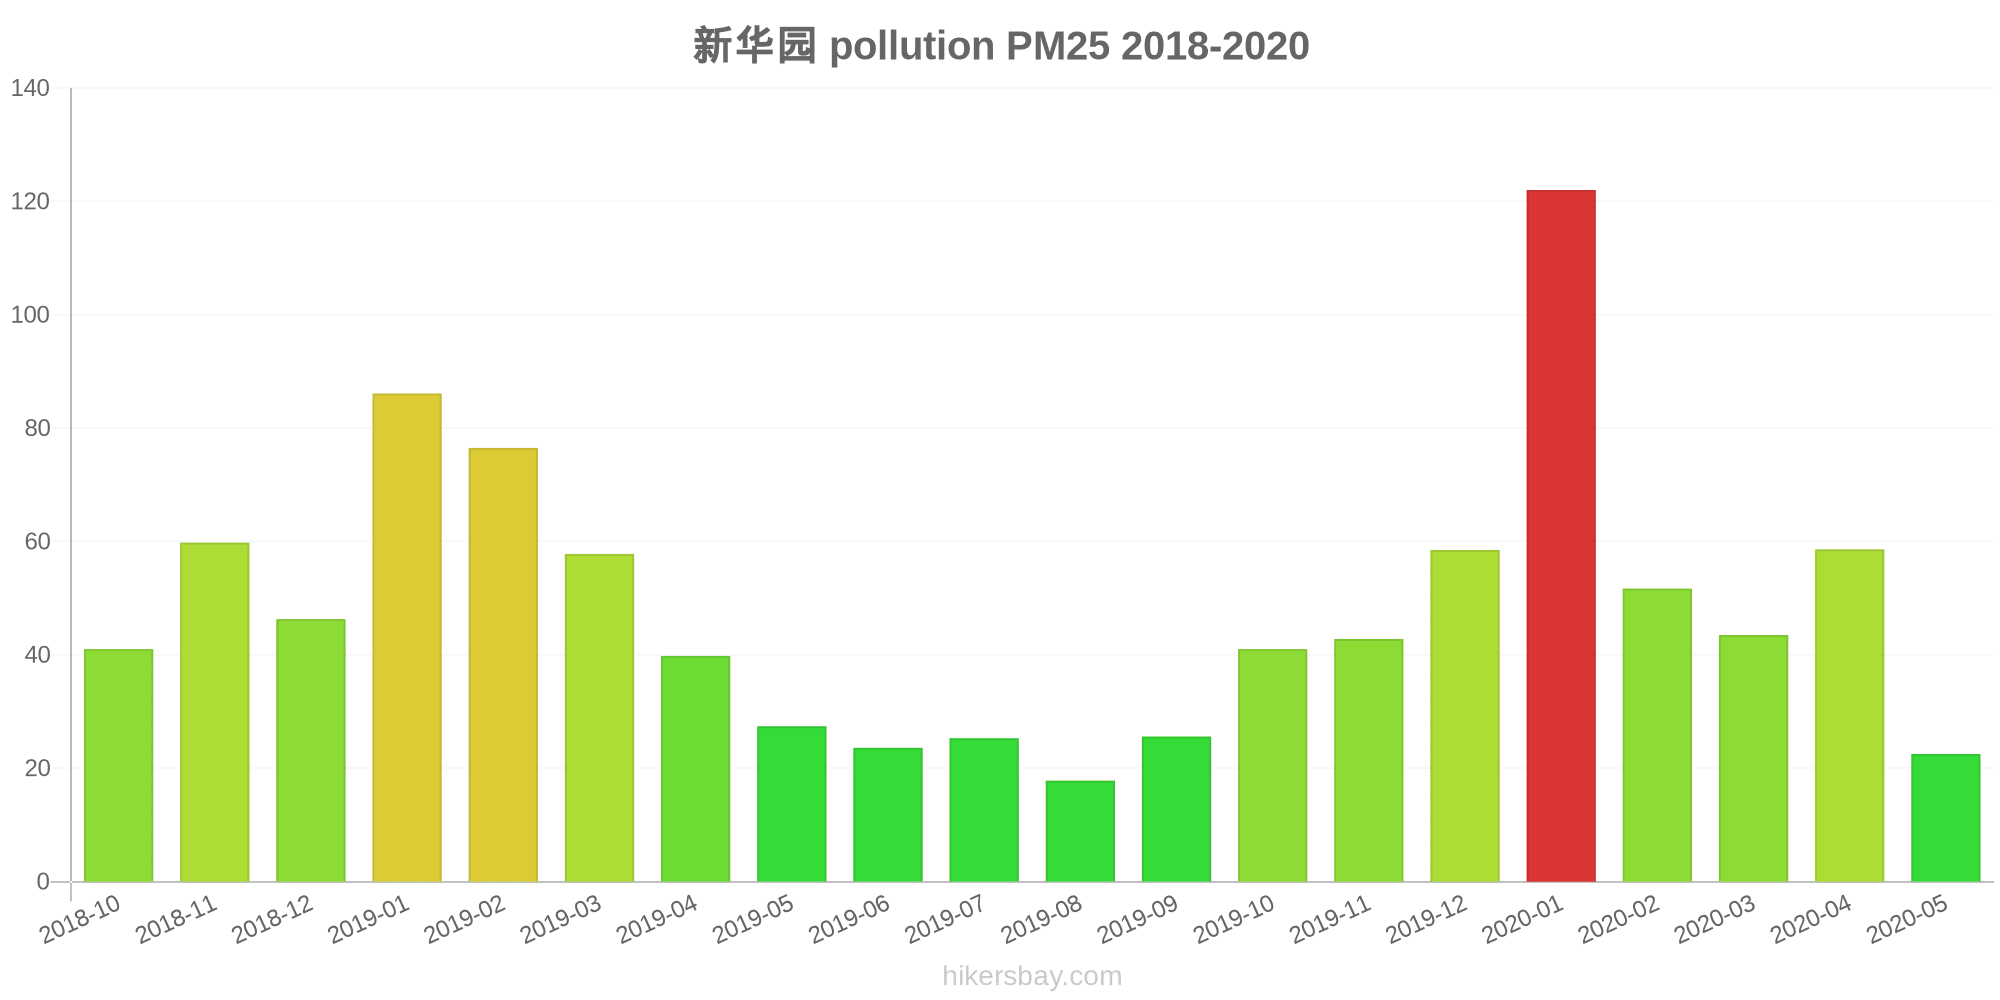
What is the current level of PM2.5 in Xisanlicun? (particulate matter (PM2.5) dust)
Today's PM2.5 level is:
2 (Good)
For comparison, the highest level of PM2.5 in Xisanlicun in the last 7 days was: 24 (Friday, May 27, 2022) and the lowest: 24 (Friday, May 27, 2022).
The highest PM2.5 values were recorded: 122 (January 2020).
The lowest level of particulate matter PM2.5 pollution occurs in month: August (18).
How high is the CO level? (carbon monoxide (CO))
100 (Good)
How high is the level of NO2? (nitrogen dioxide (NO2))
8 (Good)
How is the O3 level today in Xisanlicun? (ozone (O3))
0 (Good)
What is the level of SO2 pollution? (sulfur dioxide (SO2))
9 (Good)
Current data Friday, May 27, 2022, 12:00 PM
PM10 7 (Good)
PM2,5 2 (Good)
CO 100 (Good)
NO2 8 (Good)
O3 0 (Good)
SO2 9 (Good)
Data on air pollution from recent days in Xisanlicun
index
2022-05-27
pm10
32
Moderate
pm25
24
Moderate
co
468
Good
no2
21
Good
o3
32
Good
so2
5
Good
data source »
Air pollution in Xisanlicun from October 2018 to May 2020

index
2020-05
2020-04
2020-03
2020-02
2020-01
2019-12
2019-11
2019-10
2019-09
2019-08
2019-07
2019-06
2019-05
2019-04
2019-03
2019-02
2019-01
2018-12
2018-11
2018-10
pm25
23 (Moderate)
59 (Unhealthy)
44 (Unhealthy for Sensitive Groups)
52 (Unhealthy for Sensitive Groups)
122 (Very bad Hazardous)
59 (Unhealthy)
43 (Unhealthy for Sensitive Groups)
41 (Unhealthy for Sensitive Groups)
26 (Moderate)
18 (Moderate)
25 (Moderate)
24 (Moderate)
27 (Moderate)
40 (Unhealthy for Sensitive Groups)
58 (Unhealthy)
77 (Very Unhealthy)
86 (Very Unhealthy)
46 (Unhealthy for Sensitive Groups)
60 (Unhealthy)
41 (Unhealthy for Sensitive Groups)
co
797 (Good)
977 (Good)
876 (Good)
1 (Good)
1 (Good)
1 (Good)
991 (Good)
1 (Good)
851 (Good)
744 (Good)
800 (Good)
702 (Good)
885 (Good)
856 (Good)
1 (Good)
1 (Good)
1 (Good)
1 (Good)
1 (Good)
1 (Good)
no2
19 (Good)
30 (Good)
22 (Good)
24 (Good)
46 (Moderate)
33 (Good)
35 (Good)
39 (Good)
30 (Good)
19 (Good)
16 (Good)
21 (Good)
22 (Good)
29 (Good)
33 (Good)
37 (Good)
47 (Moderate)
37 (Good)
41 (Moderate)
33 (Good)
o3
125 (Unhealthy for Sensitive Groups)
131 (Unhealthy for Sensitive Groups)
100 (Moderate)
78 (Moderate)
59 (Good)
53 (Good)
56 (Good)
93 (Moderate)
114 (Moderate)
92 (Moderate)
146 (Unhealthy for Sensitive Groups)
142 (Unhealthy for Sensitive Groups)
144 (Unhealthy for Sensitive Groups)
116 (Moderate)
103 (Moderate)
80 (Moderate)
56 (Good)
47 (Good)
59 (Good)
80 (Moderate)
pm10
60 (Unhealthy for Sensitive Groups)
103 (Unhealthy)
67 (Unhealthy for Sensitive Groups)
69 (Unhealthy for Sensitive Groups)
146 (Very Unhealthy)
79 (Unhealthy for Sensitive Groups)
72 (Unhealthy for Sensitive Groups)
84 (Unhealthy)
58 (Unhealthy for Sensitive Groups)
35 (Moderate)
43 (Moderate)
40 (Moderate)
64 (Unhealthy for Sensitive Groups)
89 (Unhealthy)
91 (Unhealthy)
106 (Unhealthy)
119 (Very Unhealthy)
76 (Unhealthy for Sensitive Groups)
84 (Unhealthy)
63 (Unhealthy for Sensitive Groups)
so2
20 (Good)
24 (Good)
20 (Good)
16 (Good)
28 (Good)
21 (Good)
23 (Good)
20 (Good)
16 (Good)
8.4 (Good)
7.8 (Good)
12 (Good)
15 (Good)
23 (Good)
23 (Good)
30 (Good)
28 (Good)
25 (Good)
22 (Good)
20 (Good)
data source »
新华园
Friday, May 27, 2022, 12:00 PM
PM10 6.7 (Good)
particulate matter (PM10) suspended dust
PM2,5 1.7 (Good)
particulate matter (PM2.5) dust
CO 100 (Good)
carbon monoxide (CO)
NO2 7.6 (Good)
nitrogen dioxide (NO2)
O3 0.02 (Good)
ozone (O3)
SO2 8.6 (Good)
sulfur dioxide (SO2)
新华园
index
2022-05-27
pm10
32
pm25
24
co
468
no2
21
o3
32
so2
4.6
新华园
2018-10 2020-05

index
2020-05
2020-04
2020-03
2020-02
2020-01
2019-12
2019-11
2019-10
2019-09
2019-08
2019-07
2019-06
2019-05
2019-04
2019-03
2019-02
2019-01
2018-12
2018-11
2018-10
pm25
23
59
44
52
122
59
43
41
26
18
25
24
27
40
58
77
86
46
60
41
co
797
977
876
1
1
1
991
1
851
744
800
702
885
856
1
1
1
1
1
1
no2
19
30
22
24
46
33
35
39
30
19
16
21
22
29
33
37
47
37
41
33
o3
125
131
100
78
59
53
56
93
114
92
146
142
144
116
103
80
56
47
59
80
pm10
60
103
67
69
146
79
72
84
58
35
43
40
64
89
91
106
119
76
84
63
so2
20
24
20
16
28
21
23
20
16
8.4
7.8
12
15
23
23
30
28
25
22
20
* Pollution data source:
https://openaq.org
(ChinaAQIData)
The data is licensed under CC-By 4.0
PM10 7 (Good)
PM2,5 2 (Good)
CO 100 (Good)
NO2 8 (Good)
O3 0 (Good)
SO2 9 (Good)
Data on air pollution from recent days in Xisanlicun
| index | 2022-05-27 |
|---|---|
| pm10 | 32 Moderate |
| pm25 | 24 Moderate |
| co | 468 Good |
| no2 | 21 Good |
| o3 | 32 Good |
| so2 | 5 Good |

| index | 2020-05 | 2020-04 | 2020-03 | 2020-02 | 2020-01 | 2019-12 | 2019-11 | 2019-10 | 2019-09 | 2019-08 | 2019-07 | 2019-06 | 2019-05 | 2019-04 | 2019-03 | 2019-02 | 2019-01 | 2018-12 | 2018-11 | 2018-10 |
|---|---|---|---|---|---|---|---|---|---|---|---|---|---|---|---|---|---|---|---|---|
| pm25 | 23 (Moderate) | 59 (Unhealthy) | 44 (Unhealthy for Sensitive Groups) | 52 (Unhealthy for Sensitive Groups) | 122 (Very bad Hazardous) | 59 (Unhealthy) | 43 (Unhealthy for Sensitive Groups) | 41 (Unhealthy for Sensitive Groups) | 26 (Moderate) | 18 (Moderate) | 25 (Moderate) | 24 (Moderate) | 27 (Moderate) | 40 (Unhealthy for Sensitive Groups) | 58 (Unhealthy) | 77 (Very Unhealthy) | 86 (Very Unhealthy) | 46 (Unhealthy for Sensitive Groups) | 60 (Unhealthy) | 41 (Unhealthy for Sensitive Groups) |
| co | 797 (Good) | 977 (Good) | 876 (Good) | 1 (Good) | 1 (Good) | 1 (Good) | 991 (Good) | 1 (Good) | 851 (Good) | 744 (Good) | 800 (Good) | 702 (Good) | 885 (Good) | 856 (Good) | 1 (Good) | 1 (Good) | 1 (Good) | 1 (Good) | 1 (Good) | 1 (Good) |
| no2 | 19 (Good) | 30 (Good) | 22 (Good) | 24 (Good) | 46 (Moderate) | 33 (Good) | 35 (Good) | 39 (Good) | 30 (Good) | 19 (Good) | 16 (Good) | 21 (Good) | 22 (Good) | 29 (Good) | 33 (Good) | 37 (Good) | 47 (Moderate) | 37 (Good) | 41 (Moderate) | 33 (Good) |
| o3 | 125 (Unhealthy for Sensitive Groups) | 131 (Unhealthy for Sensitive Groups) | 100 (Moderate) | 78 (Moderate) | 59 (Good) | 53 (Good) | 56 (Good) | 93 (Moderate) | 114 (Moderate) | 92 (Moderate) | 146 (Unhealthy for Sensitive Groups) | 142 (Unhealthy for Sensitive Groups) | 144 (Unhealthy for Sensitive Groups) | 116 (Moderate) | 103 (Moderate) | 80 (Moderate) | 56 (Good) | 47 (Good) | 59 (Good) | 80 (Moderate) |
| pm10 | 60 (Unhealthy for Sensitive Groups) | 103 (Unhealthy) | 67 (Unhealthy for Sensitive Groups) | 69 (Unhealthy for Sensitive Groups) | 146 (Very Unhealthy) | 79 (Unhealthy for Sensitive Groups) | 72 (Unhealthy for Sensitive Groups) | 84 (Unhealthy) | 58 (Unhealthy for Sensitive Groups) | 35 (Moderate) | 43 (Moderate) | 40 (Moderate) | 64 (Unhealthy for Sensitive Groups) | 89 (Unhealthy) | 91 (Unhealthy) | 106 (Unhealthy) | 119 (Very Unhealthy) | 76 (Unhealthy for Sensitive Groups) | 84 (Unhealthy) | 63 (Unhealthy for Sensitive Groups) |
| so2 | 20 (Good) | 24 (Good) | 20 (Good) | 16 (Good) | 28 (Good) | 21 (Good) | 23 (Good) | 20 (Good) | 16 (Good) | 8.4 (Good) | 7.8 (Good) | 12 (Good) | 15 (Good) | 23 (Good) | 23 (Good) | 30 (Good) | 28 (Good) | 25 (Good) | 22 (Good) | 20 (Good) |
PM10 6.7 (Good)
particulate matter (PM10) suspended dustPM2,5 1.7 (Good)
particulate matter (PM2.5) dustCO 100 (Good)
carbon monoxide (CO)NO2 7.6 (Good)
nitrogen dioxide (NO2)O3 0.02 (Good)
ozone (O3)SO2 8.6 (Good)
sulfur dioxide (SO2)新华园
| index | 2022-05-27 |
|---|---|
| pm10 | 32 |
| pm25 | 24 |
| co | 468 |
| no2 | 21 |
| o3 | 32 |
| so2 | 4.6 |
新华园
| index | 2020-05 | 2020-04 | 2020-03 | 2020-02 | 2020-01 | 2019-12 | 2019-11 | 2019-10 | 2019-09 | 2019-08 | 2019-07 | 2019-06 | 2019-05 | 2019-04 | 2019-03 | 2019-02 | 2019-01 | 2018-12 | 2018-11 | 2018-10 |
|---|---|---|---|---|---|---|---|---|---|---|---|---|---|---|---|---|---|---|---|---|
| pm25 | 23 | 59 | 44 | 52 | 122 | 59 | 43 | 41 | 26 | 18 | 25 | 24 | 27 | 40 | 58 | 77 | 86 | 46 | 60 | 41 |
| co | 797 | 977 | 876 | 1 | 1 | 1 | 991 | 1 | 851 | 744 | 800 | 702 | 885 | 856 | 1 | 1 | 1 | 1 | 1 | 1 |
| no2 | 19 | 30 | 22 | 24 | 46 | 33 | 35 | 39 | 30 | 19 | 16 | 21 | 22 | 29 | 33 | 37 | 47 | 37 | 41 | 33 |
| o3 | 125 | 131 | 100 | 78 | 59 | 53 | 56 | 93 | 114 | 92 | 146 | 142 | 144 | 116 | 103 | 80 | 56 | 47 | 59 | 80 |
| pm10 | 60 | 103 | 67 | 69 | 146 | 79 | 72 | 84 | 58 | 35 | 43 | 40 | 64 | 89 | 91 | 106 | 119 | 76 | 84 | 63 |
| so2 | 20 | 24 | 20 | 16 | 28 | 21 | 23 | 20 | 16 | 8.4 | 7.8 | 12 | 15 | 23 | 23 | 30 | 28 | 25 | 22 | 20 |