Air Pollution in Tianjingyuan: Real-time Air Quality Index and smog alert.
Pollution and air quality forecast for Tianjingyuan. Today is Tuesday, June 16, 2026. The following air pollution values have been recorded for Tianjingyuan:- particulate matter (PM10) suspended dust - 7 (Good)
- particulate matter (PM2.5) dust - 2 (Good)
- carbon monoxide (CO) - 100 (Good)
- nitrogen dioxide (NO2) - 8 (Good)
- ozone (O3) - 0 (Good)
- sulfur dioxide (SO2) - 9 (Good)

What is the air quality in Tianjingyuan today? Is the air polluted in Tianjingyuan?. Is there smog?
What is the level of PM10 today in Tianjingyuan? (particulate matter (PM10) suspended dust)
The current level of particulate matter PM10 in Tianjingyuan is:
7 (Good)
The highest PM10 values usually occur in month: 129 (January 2020).
The lowest value of particulate matter PM10 pollution in Tianjingyuan is usually recorded in: August (34).
What is the current level of PM2.5 in Tianjingyuan? (particulate matter (PM2.5) dust)
Today's PM2.5 level is:
2 (Good)
For comparison, the highest level of PM2.5 in Tianjingyuan in the last 7 days was: 24 (Friday, May 27, 2022) and the lowest: 24 (Friday, May 27, 2022).
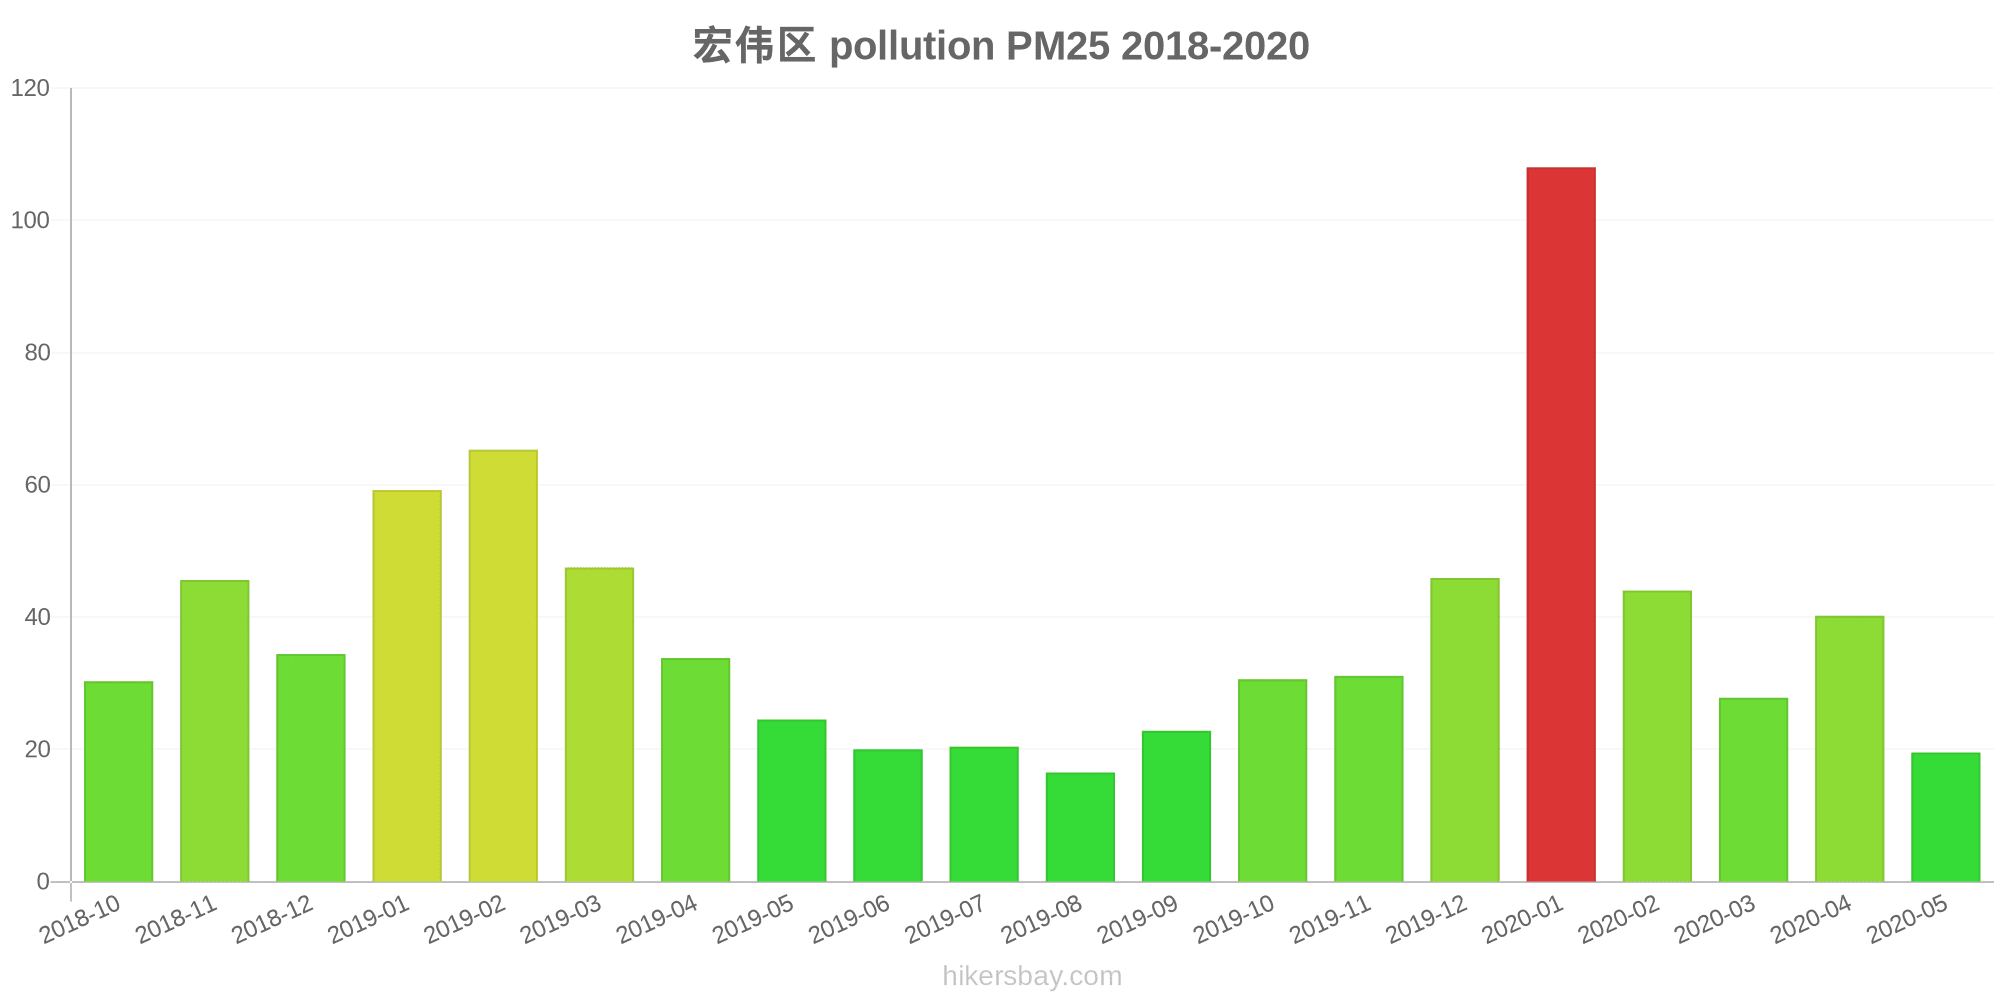
The highest PM2.5 values were recorded: 108 (January 2020).
The lowest level of particulate matter PM2.5 pollution occurs in month: August (17).
How high is the CO level? (carbon monoxide (CO))
100 (Good)
How high is the level of NO2? (nitrogen dioxide (NO2))
8 (Good)
How is the O3 level today in Tianjingyuan? (ozone (O3))
0 (Good)
What is the level of SO2 pollution? (sulfur dioxide (SO2))
9 (Good)
Current data Friday, May 27, 2022, 12:00 PM
PM10 7 (Good)
PM2,5 2 (Good)
CO 100 (Good)
NO2 8 (Good)
O3 0 (Good)
SO2 9 (Good)
Data on air pollution from recent days in Tianjingyuan
index
2022-05-27
pm10
32
Moderate
pm25
24
Moderate
co
468
Good
no2
21
Good
o3
32
Good
so2
5
Good
data source »
Air pollution in Tianjingyuan from October 2018 to May 2020

index
2020-05
2020-04
2020-03
2020-02
2020-01
2019-12
2019-11
2019-10
2019-09
2019-08
2019-07
2019-06
2019-05
2019-04
2019-03
2019-02
2019-01
2018-12
2018-11
2018-10
pm25
20 (Moderate)
40 (Unhealthy for Sensitive Groups)
28 (Moderate)
44 (Unhealthy for Sensitive Groups)
108 (Very Unhealthy)
46 (Unhealthy for Sensitive Groups)
31 (Moderate)
31 (Moderate)
23 (Moderate)
17 (Moderate)
20 (Moderate)
20 (Moderate)
25 (Moderate)
34 (Moderate)
48 (Unhealthy for Sensitive Groups)
65 (Unhealthy)
59 (Unhealthy)
34 (Moderate)
46 (Unhealthy for Sensitive Groups)
30 (Moderate)
co
791 (Good)
805 (Good)
711 (Good)
873 (Good)
1 (Good)
1 (Good)
883 (Good)
1 (Good)
785 (Good)
675 (Good)
737 (Good)
736 (Good)
739 (Good)
828 (Good)
835 (Good)
1 (Good)
1 (Good)
907 (Good)
1 (Good)
849 (Good)
no2
19 (Good)
26 (Good)
19 (Good)
21 (Good)
43 (Moderate)
29 (Good)
33 (Good)
34 (Good)
23 (Good)
14 (Good)
11 (Good)
16 (Good)
17 (Good)
24 (Good)
29 (Good)
33 (Good)
40 (Good)
30 (Good)
36 (Good)
27 (Good)
o3
127 (Unhealthy for Sensitive Groups)
129 (Unhealthy for Sensitive Groups)
102 (Moderate)
83 (Moderate)
65 (Good)
55 (Good)
58 (Good)
95 (Moderate)
108 (Moderate)
93 (Moderate)
155 (Unhealthy)
146 (Unhealthy for Sensitive Groups)
144 (Unhealthy for Sensitive Groups)
116 (Moderate)
106 (Moderate)
82 (Moderate)
62 (Good)
51 (Good)
61 (Good)
83 (Moderate)
pm10
56 (Unhealthy for Sensitive Groups)
88 (Unhealthy)
57 (Unhealthy for Sensitive Groups)
60 (Unhealthy for Sensitive Groups)
129 (Very Unhealthy)
69 (Unhealthy for Sensitive Groups)
69 (Unhealthy for Sensitive Groups)
83 (Unhealthy)
63 (Unhealthy for Sensitive Groups)
34 (Moderate)
41 (Moderate)
40 (Moderate)
68 (Unhealthy for Sensitive Groups)
91 (Unhealthy)
87 (Unhealthy)
98 (Unhealthy)
115 (Very Unhealthy)
65 (Unhealthy for Sensitive Groups)
82 (Unhealthy)
61 (Unhealthy for Sensitive Groups)
so2
18 (Good)
20 (Good)
15 (Good)
13 (Good)
21 (Good)
17 (Good)
19 (Good)
17 (Good)
17 (Good)
9.2 (Good)
8.3 (Good)
12 (Good)
16 (Good)
18 (Good)
20 (Good)
24 (Good)
24 (Good)
19 (Good)
20 (Good)
24 (Good)
data source »
宏伟区
Friday, May 27, 2022, 12:00 PM
PM10 6.7 (Good)
particulate matter (PM10) suspended dust
PM2,5 1.7 (Good)
particulate matter (PM2.5) dust
CO 100 (Good)
carbon monoxide (CO)
NO2 7.6 (Good)
nitrogen dioxide (NO2)
O3 0.02 (Good)
ozone (O3)
SO2 8.6 (Good)
sulfur dioxide (SO2)
宏伟区
index
2022-05-27
pm10
32
pm25
24
co
468
no2
21
o3
32
so2
4.6
宏伟区
2018-10 2020-05

index
2020-05
2020-04
2020-03
2020-02
2020-01
2019-12
2019-11
2019-10
2019-09
2019-08
2019-07
2019-06
2019-05
2019-04
2019-03
2019-02
2019-01
2018-12
2018-11
2018-10
pm25
20
40
28
44
108
46
31
31
23
17
20
20
25
34
48
65
59
34
46
30
co
791
805
711
873
1
1
883
1
785
675
737
736
739
828
835
1
1
907
1
849
no2
19
26
19
21
43
29
33
34
23
14
11
16
17
24
29
33
40
30
36
27
o3
127
129
102
83
65
55
58
95
108
93
155
146
144
116
106
82
62
51
61
83
pm10
56
88
57
60
129
69
69
83
63
34
41
40
68
91
87
98
115
65
82
61
so2
18
20
15
13
21
17
19
17
17
9.2
8.3
12
16
18
20
24
24
19
20
24
* Pollution data source:
https://openaq.org
(ChinaAQIData)
The data is licensed under CC-By 4.0
PM10 7 (Good)
PM2,5 2 (Good)
CO 100 (Good)
NO2 8 (Good)
O3 0 (Good)
SO2 9 (Good)
Data on air pollution from recent days in Tianjingyuan
| index | 2022-05-27 |
|---|---|
| pm10 | 32 Moderate |
| pm25 | 24 Moderate |
| co | 468 Good |
| no2 | 21 Good |
| o3 | 32 Good |
| so2 | 5 Good |

| index | 2020-05 | 2020-04 | 2020-03 | 2020-02 | 2020-01 | 2019-12 | 2019-11 | 2019-10 | 2019-09 | 2019-08 | 2019-07 | 2019-06 | 2019-05 | 2019-04 | 2019-03 | 2019-02 | 2019-01 | 2018-12 | 2018-11 | 2018-10 |
|---|---|---|---|---|---|---|---|---|---|---|---|---|---|---|---|---|---|---|---|---|
| pm25 | 20 (Moderate) | 40 (Unhealthy for Sensitive Groups) | 28 (Moderate) | 44 (Unhealthy for Sensitive Groups) | 108 (Very Unhealthy) | 46 (Unhealthy for Sensitive Groups) | 31 (Moderate) | 31 (Moderate) | 23 (Moderate) | 17 (Moderate) | 20 (Moderate) | 20 (Moderate) | 25 (Moderate) | 34 (Moderate) | 48 (Unhealthy for Sensitive Groups) | 65 (Unhealthy) | 59 (Unhealthy) | 34 (Moderate) | 46 (Unhealthy for Sensitive Groups) | 30 (Moderate) |
| co | 791 (Good) | 805 (Good) | 711 (Good) | 873 (Good) | 1 (Good) | 1 (Good) | 883 (Good) | 1 (Good) | 785 (Good) | 675 (Good) | 737 (Good) | 736 (Good) | 739 (Good) | 828 (Good) | 835 (Good) | 1 (Good) | 1 (Good) | 907 (Good) | 1 (Good) | 849 (Good) |
| no2 | 19 (Good) | 26 (Good) | 19 (Good) | 21 (Good) | 43 (Moderate) | 29 (Good) | 33 (Good) | 34 (Good) | 23 (Good) | 14 (Good) | 11 (Good) | 16 (Good) | 17 (Good) | 24 (Good) | 29 (Good) | 33 (Good) | 40 (Good) | 30 (Good) | 36 (Good) | 27 (Good) |
| o3 | 127 (Unhealthy for Sensitive Groups) | 129 (Unhealthy for Sensitive Groups) | 102 (Moderate) | 83 (Moderate) | 65 (Good) | 55 (Good) | 58 (Good) | 95 (Moderate) | 108 (Moderate) | 93 (Moderate) | 155 (Unhealthy) | 146 (Unhealthy for Sensitive Groups) | 144 (Unhealthy for Sensitive Groups) | 116 (Moderate) | 106 (Moderate) | 82 (Moderate) | 62 (Good) | 51 (Good) | 61 (Good) | 83 (Moderate) |
| pm10 | 56 (Unhealthy for Sensitive Groups) | 88 (Unhealthy) | 57 (Unhealthy for Sensitive Groups) | 60 (Unhealthy for Sensitive Groups) | 129 (Very Unhealthy) | 69 (Unhealthy for Sensitive Groups) | 69 (Unhealthy for Sensitive Groups) | 83 (Unhealthy) | 63 (Unhealthy for Sensitive Groups) | 34 (Moderate) | 41 (Moderate) | 40 (Moderate) | 68 (Unhealthy for Sensitive Groups) | 91 (Unhealthy) | 87 (Unhealthy) | 98 (Unhealthy) | 115 (Very Unhealthy) | 65 (Unhealthy for Sensitive Groups) | 82 (Unhealthy) | 61 (Unhealthy for Sensitive Groups) |
| so2 | 18 (Good) | 20 (Good) | 15 (Good) | 13 (Good) | 21 (Good) | 17 (Good) | 19 (Good) | 17 (Good) | 17 (Good) | 9.2 (Good) | 8.3 (Good) | 12 (Good) | 16 (Good) | 18 (Good) | 20 (Good) | 24 (Good) | 24 (Good) | 19 (Good) | 20 (Good) | 24 (Good) |
PM10 6.7 (Good)
particulate matter (PM10) suspended dustPM2,5 1.7 (Good)
particulate matter (PM2.5) dustCO 100 (Good)
carbon monoxide (CO)NO2 7.6 (Good)
nitrogen dioxide (NO2)O3 0.02 (Good)
ozone (O3)SO2 8.6 (Good)
sulfur dioxide (SO2)宏伟区
| index | 2022-05-27 |
|---|---|
| pm10 | 32 |
| pm25 | 24 |
| co | 468 |
| no2 | 21 |
| o3 | 32 |
| so2 | 4.6 |
宏伟区
| index | 2020-05 | 2020-04 | 2020-03 | 2020-02 | 2020-01 | 2019-12 | 2019-11 | 2019-10 | 2019-09 | 2019-08 | 2019-07 | 2019-06 | 2019-05 | 2019-04 | 2019-03 | 2019-02 | 2019-01 | 2018-12 | 2018-11 | 2018-10 |
|---|---|---|---|---|---|---|---|---|---|---|---|---|---|---|---|---|---|---|---|---|
| pm25 | 20 | 40 | 28 | 44 | 108 | 46 | 31 | 31 | 23 | 17 | 20 | 20 | 25 | 34 | 48 | 65 | 59 | 34 | 46 | 30 |
| co | 791 | 805 | 711 | 873 | 1 | 1 | 883 | 1 | 785 | 675 | 737 | 736 | 739 | 828 | 835 | 1 | 1 | 907 | 1 | 849 |
| no2 | 19 | 26 | 19 | 21 | 43 | 29 | 33 | 34 | 23 | 14 | 11 | 16 | 17 | 24 | 29 | 33 | 40 | 30 | 36 | 27 |
| o3 | 127 | 129 | 102 | 83 | 65 | 55 | 58 | 95 | 108 | 93 | 155 | 146 | 144 | 116 | 106 | 82 | 62 | 51 | 61 | 83 |
| pm10 | 56 | 88 | 57 | 60 | 129 | 69 | 69 | 83 | 63 | 34 | 41 | 40 | 68 | 91 | 87 | 98 | 115 | 65 | 82 | 61 |
| so2 | 18 | 20 | 15 | 13 | 21 | 17 | 19 | 17 | 17 | 9.2 | 8.3 | 12 | 16 | 18 | 20 | 24 | 24 | 19 | 20 | 24 |