Air Pollution in Xuwangzicun: Real-time Air Quality Index and smog alert.
Pollution and air quality forecast for Xuwangzicun. Today is Tuesday, June 16, 2026. The following air pollution values have been recorded for Xuwangzicun:- particulate matter (PM10) suspended dust - 7 (Good)
- particulate matter (PM2.5) dust - 2 (Good)
- carbon monoxide (CO) - 100 (Good)
- nitrogen dioxide (NO2) - 8 (Good)
- ozone (O3) - 0 (Good)
- sulfur dioxide (SO2) - 9 (Good)

What is the air quality in Xuwangzicun today? Is the air polluted in Xuwangzicun?. Is there smog?
What is the level of PM10 today in Xuwangzicun? (particulate matter (PM10) suspended dust)
The current level of particulate matter PM10 in Xuwangzicun is:
7 (Good)
The highest PM10 values usually occur in month: 170 (January 2020).
The lowest value of particulate matter PM10 pollution in Xuwangzicun is usually recorded in: August (41).
What is the current level of PM2.5 in Xuwangzicun? (particulate matter (PM2.5) dust)
Today's PM2.5 level is:
2 (Good)
For comparison, the highest level of PM2.5 in Xuwangzicun in the last 7 days was: 24 (Friday, May 27, 2022) and the lowest: 24 (Friday, May 27, 2022).
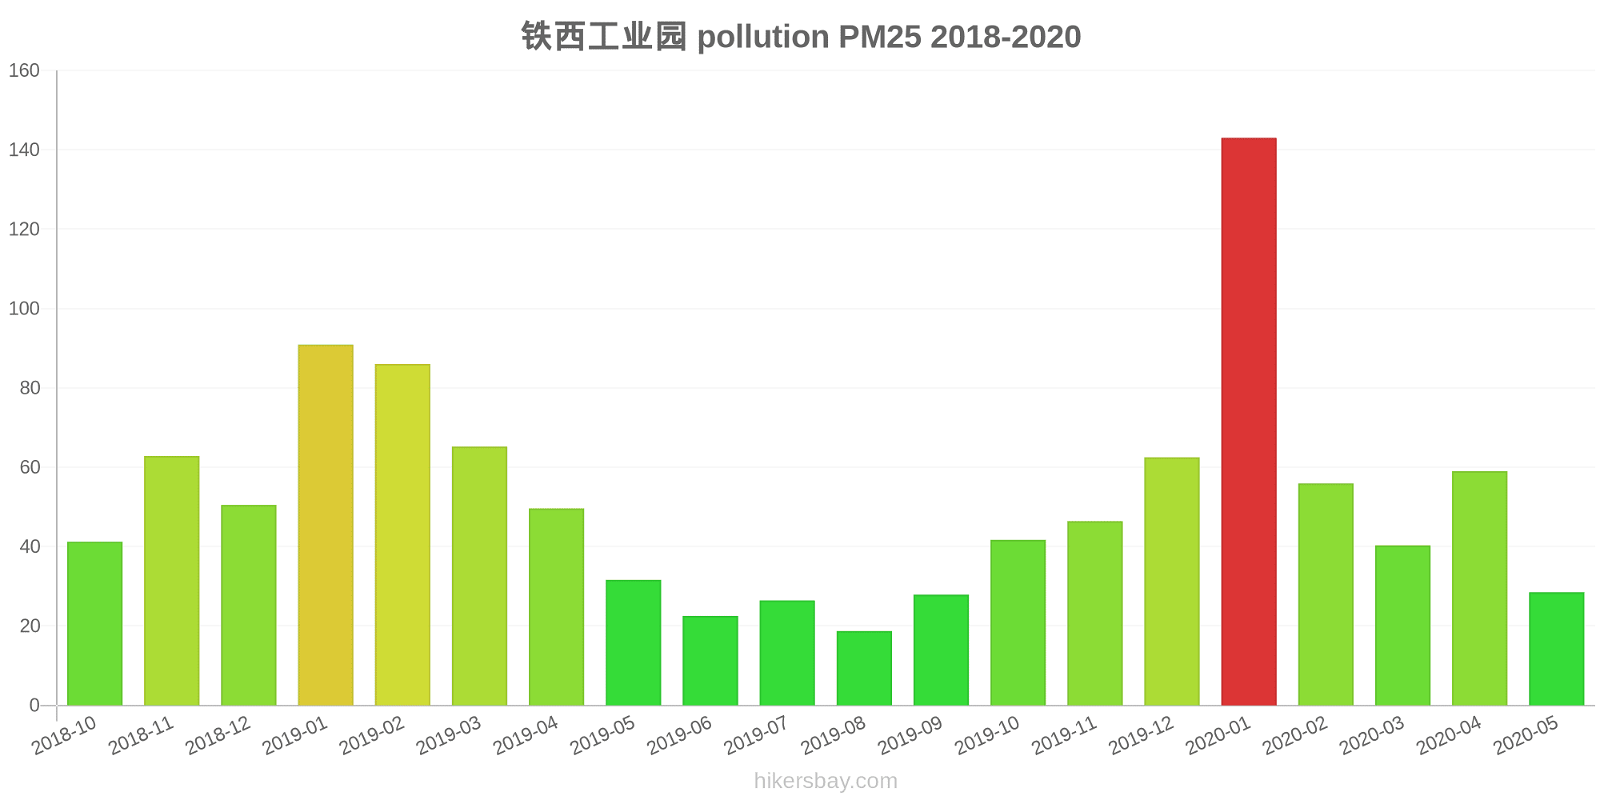
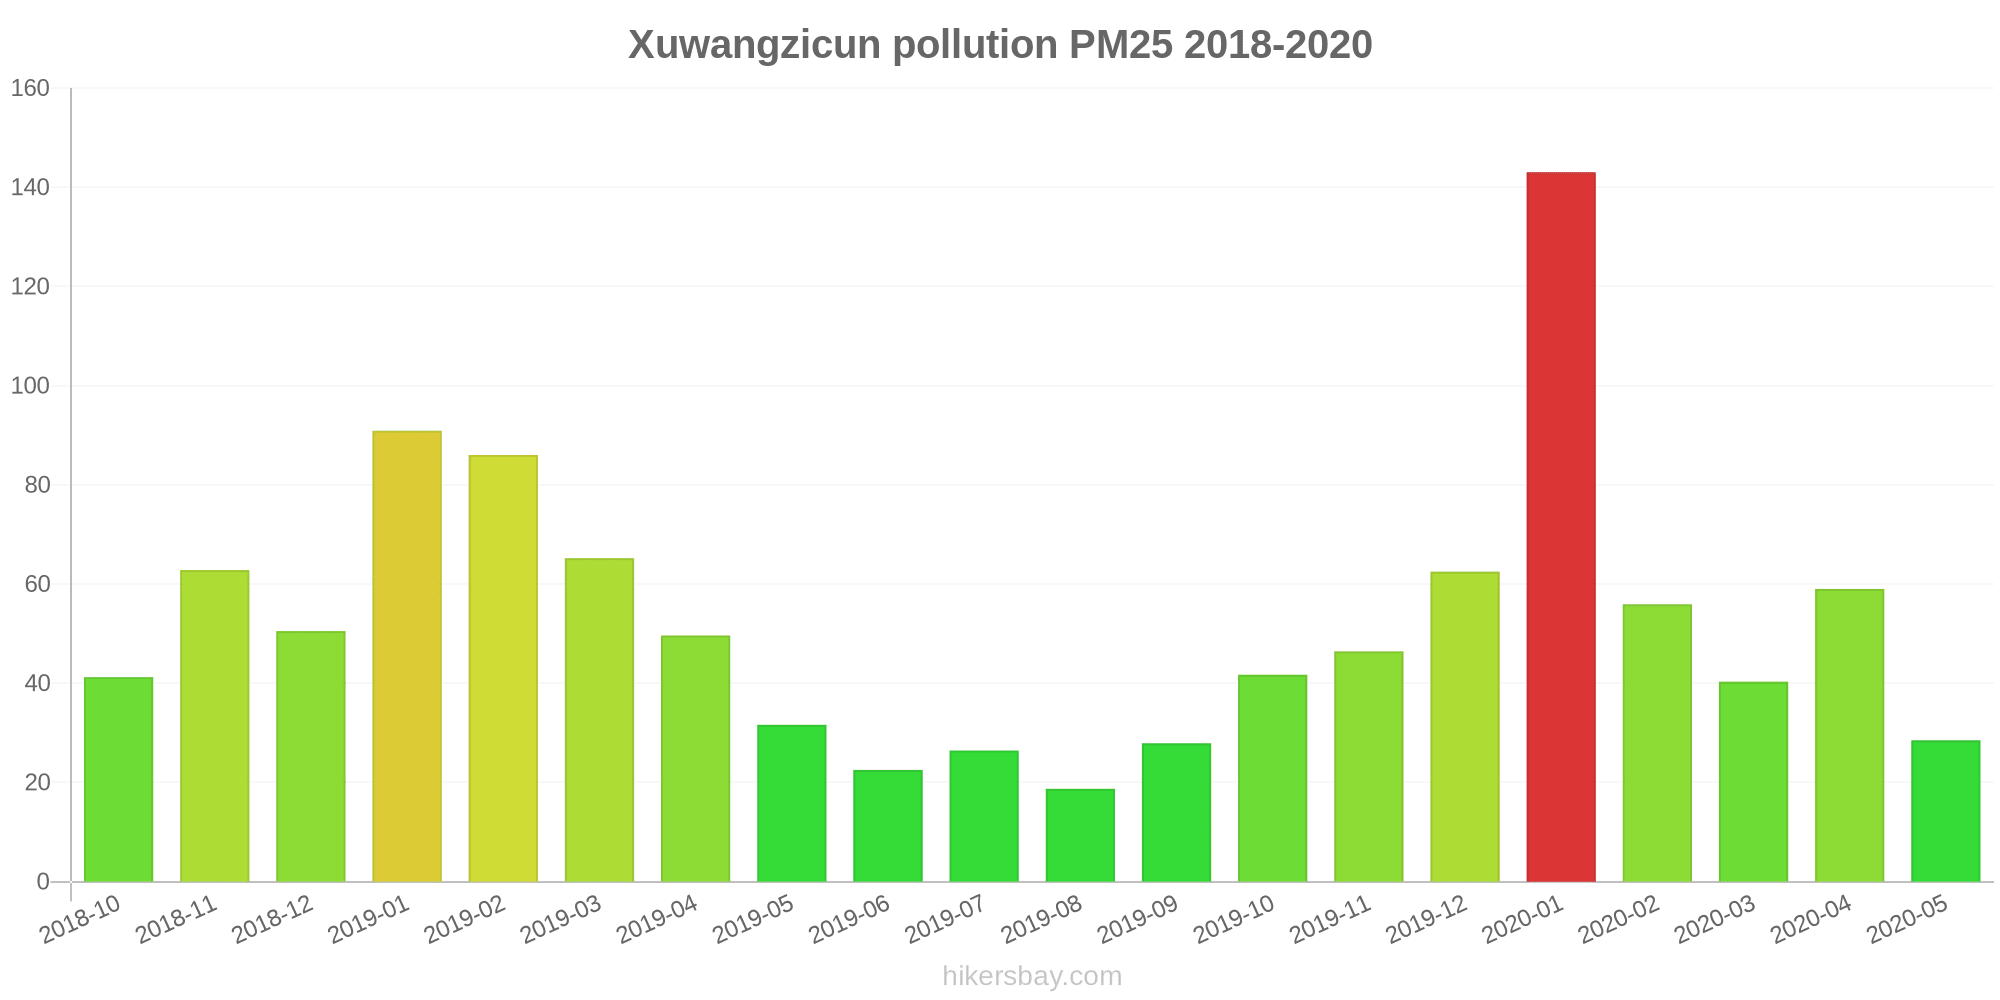
The highest PM2.5 values were recorded: 143 (January 2020).
The lowest level of particulate matter PM2.5 pollution occurs in month: August (19).
How high is the CO level? (carbon monoxide (CO))
100 (Good)
How high is the level of NO2? (nitrogen dioxide (NO2))
8 (Good)
How is the O3 level today in Xuwangzicun? (ozone (O3))
0 (Good)
What is the level of SO2 pollution? (sulfur dioxide (SO2))
9 (Good)
Current data Friday, May 27, 2022, 12:00 PM
PM10 7 (Good)
PM2,5 2 (Good)
CO 100 (Good)
NO2 8 (Good)
O3 0 (Good)
SO2 9 (Good)
Data on air pollution from recent days in Xuwangzicun
index
2022-05-27
pm10
32
Moderate
pm25
24
Moderate
co
468
Good
no2
21
Good
o3
32
Good
so2
5
Good
data source »
Air pollution in Xuwangzicun from October 2018 to May 2020

index
2020-05
2020-04
2020-03
2020-02
2020-01
2019-12
2019-11
2019-10
2019-09
2019-08
2019-07
2019-06
2019-05
2019-04
2019-03
2019-02
2019-01
2018-12
2018-11
2018-10
pm25
29 (Moderate)
59 (Unhealthy)
40 (Unhealthy for Sensitive Groups)
56 (Unhealthy)
143 (Very bad Hazardous)
63 (Unhealthy)
46 (Unhealthy for Sensitive Groups)
42 (Unhealthy for Sensitive Groups)
28 (Moderate)
19 (Moderate)
26 (Moderate)
23 (Moderate)
32 (Moderate)
50 (Unhealthy for Sensitive Groups)
65 (Unhealthy)
86 (Very Unhealthy)
91 (Very Unhealthy)
51 (Unhealthy for Sensitive Groups)
63 (Unhealthy)
41 (Unhealthy for Sensitive Groups)
co
728 (Good)
1 (Good)
959 (Good)
1 (Good)
2 (Good)
1 (Good)
1 (Good)
1 (Good)
1 (Good)
961 (Good)
1 (Good)
934 (Good)
972 (Good)
957 (Good)
1 (Good)
1 (Good)
1 (Good)
1 (Good)
1 (Good)
1 (Good)
no2
20 (Good)
31 (Good)
27 (Good)
27 (Good)
49 (Moderate)
33 (Good)
36 (Good)
36 (Good)
30 (Good)
18 (Good)
19 (Good)
24 (Good)
25 (Good)
32 (Good)
34 (Good)
37 (Good)
42 (Moderate)
34 (Good)
37 (Good)
28 (Good)
o3
117 (Moderate)
122 (Unhealthy for Sensitive Groups)
92 (Moderate)
77 (Moderate)
63 (Good)
51 (Good)
54 (Good)
83 (Moderate)
99 (Moderate)
93 (Moderate)
136 (Unhealthy for Sensitive Groups)
129 (Unhealthy for Sensitive Groups)
135 (Unhealthy for Sensitive Groups)
104 (Moderate)
97 (Moderate)
71 (Moderate)
53 (Good)
48 (Good)
59 (Good)
76 (Moderate)
pm10
55 (Unhealthy for Sensitive Groups)
123 (Very Unhealthy)
78 (Unhealthy for Sensitive Groups)
79 (Unhealthy for Sensitive Groups)
170 (Very bad Hazardous)
92 (Unhealthy)
86 (Unhealthy)
102 (Unhealthy)
71 (Unhealthy for Sensitive Groups)
41 (Moderate)
53 (Unhealthy for Sensitive Groups)
50 (Unhealthy for Sensitive Groups)
81 (Unhealthy)
110 (Very Unhealthy)
106 (Unhealthy)
112 (Very Unhealthy)
137 (Very Unhealthy)
81 (Unhealthy)
99 (Unhealthy)
74 (Unhealthy for Sensitive Groups)
so2
14 (Good)
18 (Good)
12 (Good)
12 (Good)
23 (Good)
17 (Good)
19 (Good)
16 (Good)
16 (Good)
11 (Good)
13 (Good)
14 (Good)
19 (Good)
21 (Good)
20 (Good)
20 (Good)
23 (Good)
23 (Good)
21 (Good)
16 (Good)
data source »
铁西工业园
Friday, May 27, 2022, 12:00 PM
PM10 6.7 (Good)
particulate matter (PM10) suspended dust
PM2,5 1.7 (Good)
particulate matter (PM2.5) dust
CO 100 (Good)
carbon monoxide (CO)
NO2 7.6 (Good)
nitrogen dioxide (NO2)
O3 0.02 (Good)
ozone (O3)
SO2 8.6 (Good)
sulfur dioxide (SO2)
铁西工业园
index
2022-05-27
pm10
32
pm25
24
co
468
no2
21
o3
32
so2
4.6
铁西工业园
2018-10 2020-05
index
2020-05
2020-04
2020-03
2020-02
2020-01
2019-12
2019-11
2019-10
2019-09
2019-08
2019-07
2019-06
2019-05
2019-04
2019-03
2019-02
2019-01
2018-12
2018-11
2018-10
pm25
29
59
40
56
143
63
46
42
28
19
26
23
32
50
65
86
91
51
63
41
co
728
1
959
1
2
1
1
1
1
961
1
934
972
957
1
1
1
1
1
1
no2
20
31
27
27
49
33
36
36
30
18
19
24
25
32
34
37
42
34
37
28
o3
117
122
92
77
63
51
54
83
99
93
136
129
135
104
97
71
53
48
59
76
pm10
55
123
78
79
170
92
86
102
71
41
53
50
81
110
106
112
137
81
99
74
so2
14
18
12
12
23
17
19
16
16
11
13
14
19
21
20
20
23
23
21
16
* Pollution data source:
https://openaq.org
(ChinaAQIData)
The data is licensed under CC-By 4.0
PM10 7 (Good)
PM2,5 2 (Good)
CO 100 (Good)
NO2 8 (Good)
O3 0 (Good)
SO2 9 (Good)
Data on air pollution from recent days in Xuwangzicun
| index | 2022-05-27 |
|---|---|
| pm10 | 32 Moderate |
| pm25 | 24 Moderate |
| co | 468 Good |
| no2 | 21 Good |
| o3 | 32 Good |
| so2 | 5 Good |
| index | 2020-05 | 2020-04 | 2020-03 | 2020-02 | 2020-01 | 2019-12 | 2019-11 | 2019-10 | 2019-09 | 2019-08 | 2019-07 | 2019-06 | 2019-05 | 2019-04 | 2019-03 | 2019-02 | 2019-01 | 2018-12 | 2018-11 | 2018-10 |
|---|---|---|---|---|---|---|---|---|---|---|---|---|---|---|---|---|---|---|---|---|
| pm25 | 29 (Moderate) | 59 (Unhealthy) | 40 (Unhealthy for Sensitive Groups) | 56 (Unhealthy) | 143 (Very bad Hazardous) | 63 (Unhealthy) | 46 (Unhealthy for Sensitive Groups) | 42 (Unhealthy for Sensitive Groups) | 28 (Moderate) | 19 (Moderate) | 26 (Moderate) | 23 (Moderate) | 32 (Moderate) | 50 (Unhealthy for Sensitive Groups) | 65 (Unhealthy) | 86 (Very Unhealthy) | 91 (Very Unhealthy) | 51 (Unhealthy for Sensitive Groups) | 63 (Unhealthy) | 41 (Unhealthy for Sensitive Groups) |
| co | 728 (Good) | 1 (Good) | 959 (Good) | 1 (Good) | 2 (Good) | 1 (Good) | 1 (Good) | 1 (Good) | 1 (Good) | 961 (Good) | 1 (Good) | 934 (Good) | 972 (Good) | 957 (Good) | 1 (Good) | 1 (Good) | 1 (Good) | 1 (Good) | 1 (Good) | 1 (Good) |
| no2 | 20 (Good) | 31 (Good) | 27 (Good) | 27 (Good) | 49 (Moderate) | 33 (Good) | 36 (Good) | 36 (Good) | 30 (Good) | 18 (Good) | 19 (Good) | 24 (Good) | 25 (Good) | 32 (Good) | 34 (Good) | 37 (Good) | 42 (Moderate) | 34 (Good) | 37 (Good) | 28 (Good) |
| o3 | 117 (Moderate) | 122 (Unhealthy for Sensitive Groups) | 92 (Moderate) | 77 (Moderate) | 63 (Good) | 51 (Good) | 54 (Good) | 83 (Moderate) | 99 (Moderate) | 93 (Moderate) | 136 (Unhealthy for Sensitive Groups) | 129 (Unhealthy for Sensitive Groups) | 135 (Unhealthy for Sensitive Groups) | 104 (Moderate) | 97 (Moderate) | 71 (Moderate) | 53 (Good) | 48 (Good) | 59 (Good) | 76 (Moderate) |
| pm10 | 55 (Unhealthy for Sensitive Groups) | 123 (Very Unhealthy) | 78 (Unhealthy for Sensitive Groups) | 79 (Unhealthy for Sensitive Groups) | 170 (Very bad Hazardous) | 92 (Unhealthy) | 86 (Unhealthy) | 102 (Unhealthy) | 71 (Unhealthy for Sensitive Groups) | 41 (Moderate) | 53 (Unhealthy for Sensitive Groups) | 50 (Unhealthy for Sensitive Groups) | 81 (Unhealthy) | 110 (Very Unhealthy) | 106 (Unhealthy) | 112 (Very Unhealthy) | 137 (Very Unhealthy) | 81 (Unhealthy) | 99 (Unhealthy) | 74 (Unhealthy for Sensitive Groups) |
| so2 | 14 (Good) | 18 (Good) | 12 (Good) | 12 (Good) | 23 (Good) | 17 (Good) | 19 (Good) | 16 (Good) | 16 (Good) | 11 (Good) | 13 (Good) | 14 (Good) | 19 (Good) | 21 (Good) | 20 (Good) | 20 (Good) | 23 (Good) | 23 (Good) | 21 (Good) | 16 (Good) |
PM10 6.7 (Good)
particulate matter (PM10) suspended dustPM2,5 1.7 (Good)
particulate matter (PM2.5) dustCO 100 (Good)
carbon monoxide (CO)NO2 7.6 (Good)
nitrogen dioxide (NO2)O3 0.02 (Good)
ozone (O3)SO2 8.6 (Good)
sulfur dioxide (SO2)铁西工业园
| index | 2022-05-27 |
|---|---|
| pm10 | 32 |
| pm25 | 24 |
| co | 468 |
| no2 | 21 |
| o3 | 32 |
| so2 | 4.6 |
铁西工业园

| index | 2020-05 | 2020-04 | 2020-03 | 2020-02 | 2020-01 | 2019-12 | 2019-11 | 2019-10 | 2019-09 | 2019-08 | 2019-07 | 2019-06 | 2019-05 | 2019-04 | 2019-03 | 2019-02 | 2019-01 | 2018-12 | 2018-11 | 2018-10 |
|---|---|---|---|---|---|---|---|---|---|---|---|---|---|---|---|---|---|---|---|---|
| pm25 | 29 | 59 | 40 | 56 | 143 | 63 | 46 | 42 | 28 | 19 | 26 | 23 | 32 | 50 | 65 | 86 | 91 | 51 | 63 | 41 |
| co | 728 | 1 | 959 | 1 | 2 | 1 | 1 | 1 | 1 | 961 | 1 | 934 | 972 | 957 | 1 | 1 | 1 | 1 | 1 | 1 |
| no2 | 20 | 31 | 27 | 27 | 49 | 33 | 36 | 36 | 30 | 18 | 19 | 24 | 25 | 32 | 34 | 37 | 42 | 34 | 37 | 28 |
| o3 | 117 | 122 | 92 | 77 | 63 | 51 | 54 | 83 | 99 | 93 | 136 | 129 | 135 | 104 | 97 | 71 | 53 | 48 | 59 | 76 |
| pm10 | 55 | 123 | 78 | 79 | 170 | 92 | 86 | 102 | 71 | 41 | 53 | 50 | 81 | 110 | 106 | 112 | 137 | 81 | 99 | 74 |
| so2 | 14 | 18 | 12 | 12 | 23 | 17 | 19 | 16 | 16 | 11 | 13 | 14 | 19 | 21 | 20 | 20 | 23 | 23 | 21 | 16 |