Air Pollution in Bayan Nur: Real-time Air Quality Index and smog alert.
Pollution and air quality forecast for Bayan Nur. Today is Tuesday, June 16, 2026. The following air pollution values have been recorded for Bayan Nur:- particulate matter (PM10) suspended dust - 7 (Good)
- particulate matter (PM2.5) dust - 2 (Good)
- carbon monoxide (CO) - 100 (Good)
- nitrogen dioxide (NO2) - 8 (Good)
- ozone (O3) - 0 (Good)
- sulfur dioxide (SO2) - 9 (Good)

What is the air quality in Bayan Nur today? Is the air polluted in Bayan Nur?. Is there smog?
What is the level of PM10 today in Bayan Nur? (particulate matter (PM10) suspended dust)
The current level of particulate matter PM10 in Bayan Nur is:
7 (Good)
The highest PM10 values usually occur in month: 171 (January 2020).
The lowest value of particulate matter PM10 pollution in Bayan Nur is usually recorded in: August (33).
What is the current level of PM2.5 in Bayan Nur? (particulate matter (PM2.5) dust)
Today's PM2.5 level is:
2 (Good)
For comparison, the highest level of PM2.5 in Bayan Nur in the last 7 days was: 24 (Friday, May 27, 2022) and the lowest: 24 (Friday, May 27, 2022).
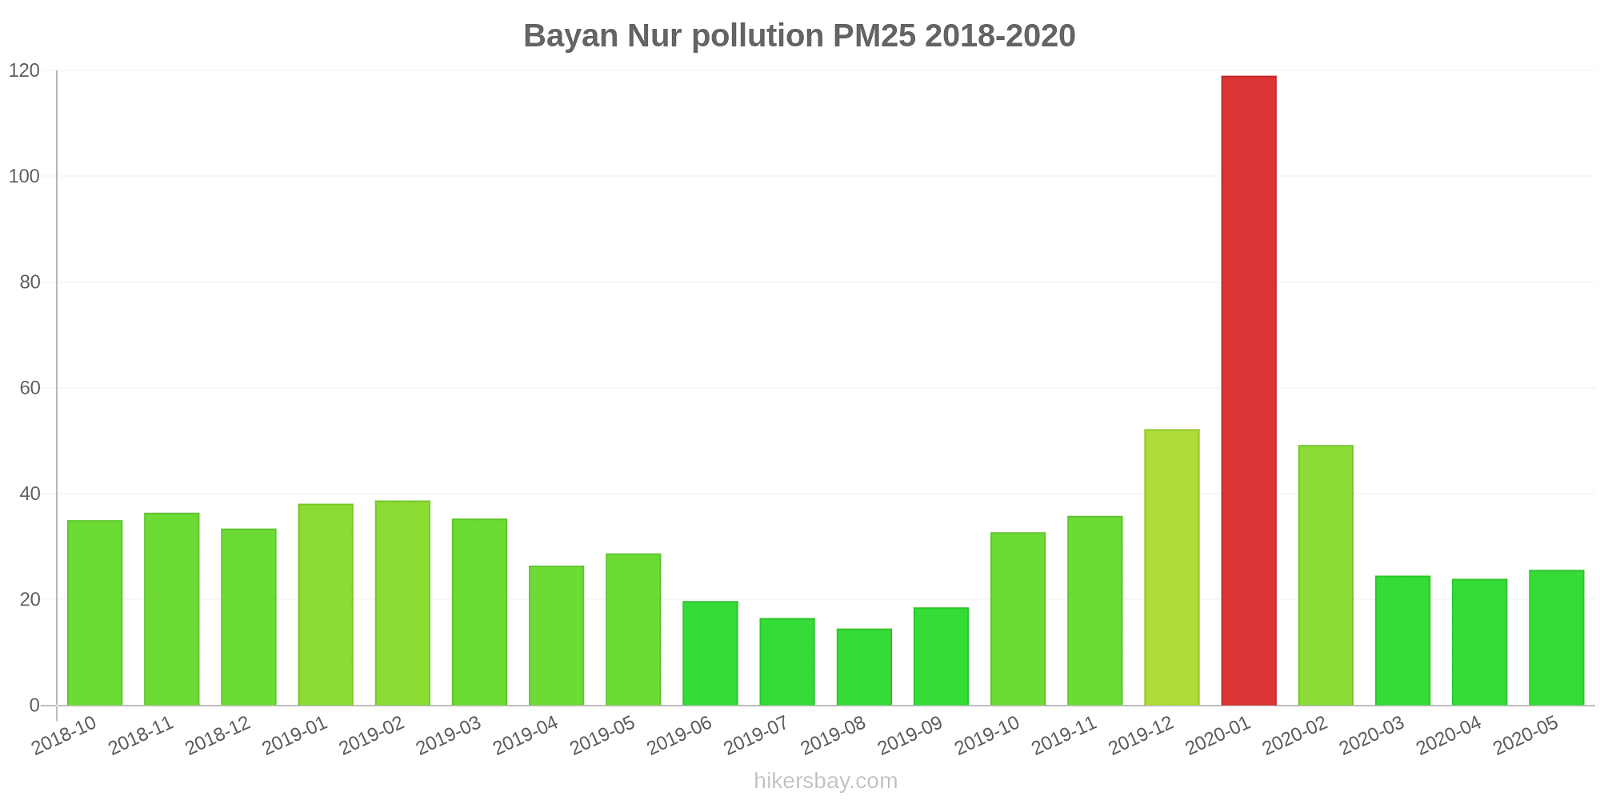
The highest PM2.5 values were recorded: 119 (January 2020).
The lowest level of particulate matter PM2.5 pollution occurs in month: August (15).
How high is the CO level? (carbon monoxide (CO))
100 (Good)
How high is the level of NO2? (nitrogen dioxide (NO2))
8 (Good)
How is the O3 level today in Bayan Nur? (ozone (O3))
0 (Good)
What is the level of SO2 pollution? (sulfur dioxide (SO2))
9 (Good)
Current data Friday, May 27, 2022, 12:00 PM
PM10 7 (Good)
PM2,5 2 (Good)
CO 100 (Good)
NO2 8 (Good)
O3 0 (Good)
SO2 9 (Good)
Data on air pollution from recent days in Bayan Nur
index
2022-05-27
pm10
32
Moderate
pm25
24
Moderate
co
468
Good
no2
21
Good
o3
32
Good
so2
5
Good
data source »
Air pollution in Bayan Nur from October 2018 to May 2020
index
2020-05
2020-04
2020-03
2020-02
2020-01
2019-12
2019-11
2019-10
2019-09
2019-08
2019-07
2019-06
2019-05
2019-04
2019-03
2019-02
2019-01
2018-12
2018-11
2018-10
pm25
26 (Moderate)
24 (Moderate)
25 (Moderate)
49 (Unhealthy for Sensitive Groups)
119 (Very bad Hazardous)
52 (Unhealthy for Sensitive Groups)
36 (Unhealthy for Sensitive Groups)
33 (Moderate)
19 (Moderate)
15 (Moderate)
17 (Moderate)
20 (Moderate)
29 (Moderate)
26 (Moderate)
35 (Unhealthy for Sensitive Groups)
39 (Unhealthy for Sensitive Groups)
38 (Unhealthy for Sensitive Groups)
33 (Moderate)
36 (Unhealthy for Sensitive Groups)
35 (Unhealthy for Sensitive Groups)
co
614 (Good)
585 (Good)
593 (Good)
786 (Good)
1 (Good)
1 (Good)
814 (Good)
594 (Good)
590 (Good)
587 (Good)
590 (Good)
701 (Good)
656 (Good)
595 (Good)
675 (Good)
755 (Good)
743 (Good)
628 (Good)
552 (Good)
467 (Good)
no2
14 (Good)
21 (Good)
15 (Good)
19 (Good)
43 (Moderate)
29 (Good)
25 (Good)
20 (Good)
18 (Good)
16 (Good)
18 (Good)
14 (Good)
14 (Good)
24 (Good)
23 (Good)
26 (Good)
31 (Good)
23 (Good)
24 (Good)
22 (Good)
o3
115 (Moderate)
118 (Moderate)
97 (Moderate)
92 (Moderate)
70 (Moderate)
76 (Moderate)
81 (Moderate)
100 (Moderate)
137 (Unhealthy for Sensitive Groups)
131 (Unhealthy for Sensitive Groups)
149 (Unhealthy for Sensitive Groups)
141 (Unhealthy for Sensitive Groups)
134 (Unhealthy for Sensitive Groups)
122 (Unhealthy for Sensitive Groups)
100 (Moderate)
82 (Moderate)
64 (Good)
65 (Good)
78 (Moderate)
87 (Moderate)
pm10
86 (Unhealthy)
68 (Unhealthy for Sensitive Groups)
78 (Unhealthy for Sensitive Groups)
107 (Unhealthy)
171 (Very bad Hazardous)
97 (Unhealthy)
97 (Unhealthy)
77 (Unhealthy for Sensitive Groups)
37 (Moderate)
33 (Moderate)
45 (Moderate)
59 (Unhealthy for Sensitive Groups)
93 (Unhealthy)
94 (Unhealthy)
82 (Unhealthy)
88 (Unhealthy)
71 (Unhealthy for Sensitive Groups)
79 (Unhealthy for Sensitive Groups)
104 (Unhealthy)
74 (Unhealthy for Sensitive Groups)
so2
11 (Good)
11 (Good)
12 (Good)
16 (Good)
28 (Good)
17 (Good)
13 (Good)
7.7 (Good)
6.8 (Good)
7.5 (Good)
9.3 (Good)
8.9 (Good)
8.4 (Good)
13 (Good)
14 (Good)
21 (Good)
24 (Good)
19 (Good)
13 (Good)
8 (Good)
data source »
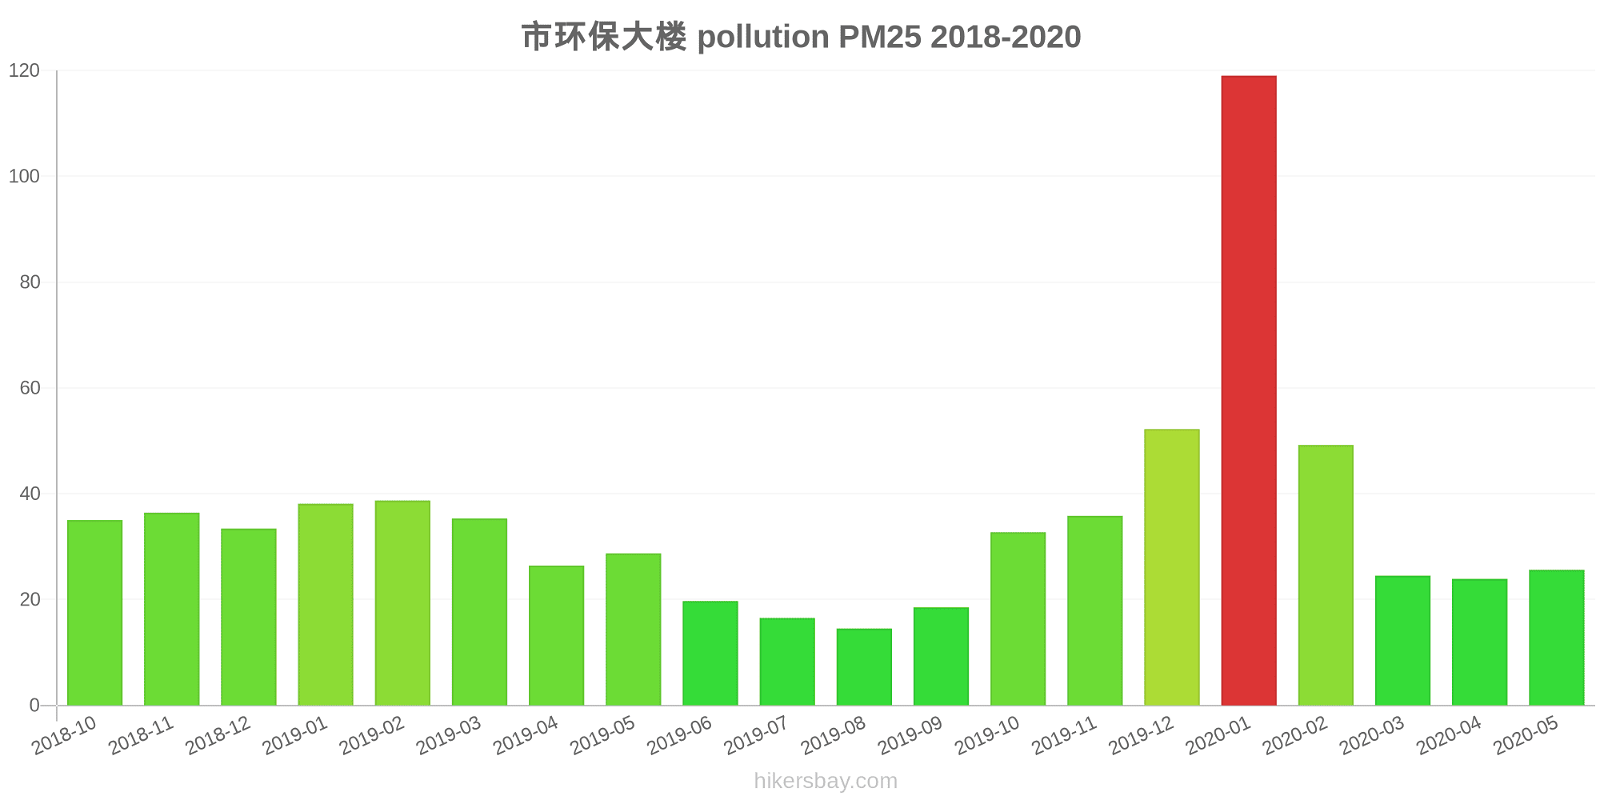
市环保大楼
Friday, May 27, 2022, 12:00 PM
PM10 6.7 (Good)
particulate matter (PM10) suspended dust
PM2,5 1.7 (Good)
particulate matter (PM2.5) dust
CO 100 (Good)
carbon monoxide (CO)
NO2 7.6 (Good)
nitrogen dioxide (NO2)
O3 0.02 (Good)
ozone (O3)
SO2 8.6 (Good)
sulfur dioxide (SO2)
市环保大楼
index
2022-05-27
pm10
32
pm25
24
co
468
no2
21
o3
32
so2
4.6
市环保大楼
2018-10 2020-05
index
2020-05
2020-04
2020-03
2020-02
2020-01
2019-12
2019-11
2019-10
2019-09
2019-08
2019-07
2019-06
2019-05
2019-04
2019-03
2019-02
2019-01
2018-12
2018-11
2018-10
pm25
26
24
25
49
119
52
36
33
19
15
17
20
29
26
35
39
38
33
36
35
co
614
585
593
786
1
1
814
594
590
587
590
701
656
595
675
755
743
628
552
467
no2
14
21
15
19
43
29
25
20
18
16
18
14
14
24
23
26
31
23
24
22
o3
115
118
97
92
70
76
81
100
137
131
149
141
134
122
100
82
64
65
78
87
pm10
86
68
78
107
171
97
97
77
37
33
45
59
93
94
82
88
71
79
104
74
so2
11
11
12
16
28
17
13
7.7
6.8
7.5
9.3
8.9
8.4
13
14
21
24
19
13
8
* Pollution data source:
https://openaq.org
(ChinaAQIData)
The data is licensed under CC-By 4.0
PM10 7 (Good)
PM2,5 2 (Good)
CO 100 (Good)
NO2 8 (Good)
O3 0 (Good)
SO2 9 (Good)
Data on air pollution from recent days in Bayan Nur
| index | 2022-05-27 |
|---|---|
| pm10 | 32 Moderate |
| pm25 | 24 Moderate |
| co | 468 Good |
| no2 | 21 Good |
| o3 | 32 Good |
| so2 | 5 Good |

| index | 2020-05 | 2020-04 | 2020-03 | 2020-02 | 2020-01 | 2019-12 | 2019-11 | 2019-10 | 2019-09 | 2019-08 | 2019-07 | 2019-06 | 2019-05 | 2019-04 | 2019-03 | 2019-02 | 2019-01 | 2018-12 | 2018-11 | 2018-10 |
|---|---|---|---|---|---|---|---|---|---|---|---|---|---|---|---|---|---|---|---|---|
| pm25 | 26 (Moderate) | 24 (Moderate) | 25 (Moderate) | 49 (Unhealthy for Sensitive Groups) | 119 (Very bad Hazardous) | 52 (Unhealthy for Sensitive Groups) | 36 (Unhealthy for Sensitive Groups) | 33 (Moderate) | 19 (Moderate) | 15 (Moderate) | 17 (Moderate) | 20 (Moderate) | 29 (Moderate) | 26 (Moderate) | 35 (Unhealthy for Sensitive Groups) | 39 (Unhealthy for Sensitive Groups) | 38 (Unhealthy for Sensitive Groups) | 33 (Moderate) | 36 (Unhealthy for Sensitive Groups) | 35 (Unhealthy for Sensitive Groups) |
| co | 614 (Good) | 585 (Good) | 593 (Good) | 786 (Good) | 1 (Good) | 1 (Good) | 814 (Good) | 594 (Good) | 590 (Good) | 587 (Good) | 590 (Good) | 701 (Good) | 656 (Good) | 595 (Good) | 675 (Good) | 755 (Good) | 743 (Good) | 628 (Good) | 552 (Good) | 467 (Good) |
| no2 | 14 (Good) | 21 (Good) | 15 (Good) | 19 (Good) | 43 (Moderate) | 29 (Good) | 25 (Good) | 20 (Good) | 18 (Good) | 16 (Good) | 18 (Good) | 14 (Good) | 14 (Good) | 24 (Good) | 23 (Good) | 26 (Good) | 31 (Good) | 23 (Good) | 24 (Good) | 22 (Good) |
| o3 | 115 (Moderate) | 118 (Moderate) | 97 (Moderate) | 92 (Moderate) | 70 (Moderate) | 76 (Moderate) | 81 (Moderate) | 100 (Moderate) | 137 (Unhealthy for Sensitive Groups) | 131 (Unhealthy for Sensitive Groups) | 149 (Unhealthy for Sensitive Groups) | 141 (Unhealthy for Sensitive Groups) | 134 (Unhealthy for Sensitive Groups) | 122 (Unhealthy for Sensitive Groups) | 100 (Moderate) | 82 (Moderate) | 64 (Good) | 65 (Good) | 78 (Moderate) | 87 (Moderate) |
| pm10 | 86 (Unhealthy) | 68 (Unhealthy for Sensitive Groups) | 78 (Unhealthy for Sensitive Groups) | 107 (Unhealthy) | 171 (Very bad Hazardous) | 97 (Unhealthy) | 97 (Unhealthy) | 77 (Unhealthy for Sensitive Groups) | 37 (Moderate) | 33 (Moderate) | 45 (Moderate) | 59 (Unhealthy for Sensitive Groups) | 93 (Unhealthy) | 94 (Unhealthy) | 82 (Unhealthy) | 88 (Unhealthy) | 71 (Unhealthy for Sensitive Groups) | 79 (Unhealthy for Sensitive Groups) | 104 (Unhealthy) | 74 (Unhealthy for Sensitive Groups) |
| so2 | 11 (Good) | 11 (Good) | 12 (Good) | 16 (Good) | 28 (Good) | 17 (Good) | 13 (Good) | 7.7 (Good) | 6.8 (Good) | 7.5 (Good) | 9.3 (Good) | 8.9 (Good) | 8.4 (Good) | 13 (Good) | 14 (Good) | 21 (Good) | 24 (Good) | 19 (Good) | 13 (Good) | 8 (Good) |
PM10 6.7 (Good)
particulate matter (PM10) suspended dustPM2,5 1.7 (Good)
particulate matter (PM2.5) dustCO 100 (Good)
carbon monoxide (CO)NO2 7.6 (Good)
nitrogen dioxide (NO2)O3 0.02 (Good)
ozone (O3)SO2 8.6 (Good)
sulfur dioxide (SO2)市环保大楼
| index | 2022-05-27 |
|---|---|
| pm10 | 32 |
| pm25 | 24 |
| co | 468 |
| no2 | 21 |
| o3 | 32 |
| so2 | 4.6 |
市环保大楼

| index | 2020-05 | 2020-04 | 2020-03 | 2020-02 | 2020-01 | 2019-12 | 2019-11 | 2019-10 | 2019-09 | 2019-08 | 2019-07 | 2019-06 | 2019-05 | 2019-04 | 2019-03 | 2019-02 | 2019-01 | 2018-12 | 2018-11 | 2018-10 |
|---|---|---|---|---|---|---|---|---|---|---|---|---|---|---|---|---|---|---|---|---|
| pm25 | 26 | 24 | 25 | 49 | 119 | 52 | 36 | 33 | 19 | 15 | 17 | 20 | 29 | 26 | 35 | 39 | 38 | 33 | 36 | 35 |
| co | 614 | 585 | 593 | 786 | 1 | 1 | 814 | 594 | 590 | 587 | 590 | 701 | 656 | 595 | 675 | 755 | 743 | 628 | 552 | 467 |
| no2 | 14 | 21 | 15 | 19 | 43 | 29 | 25 | 20 | 18 | 16 | 18 | 14 | 14 | 24 | 23 | 26 | 31 | 23 | 24 | 22 |
| o3 | 115 | 118 | 97 | 92 | 70 | 76 | 81 | 100 | 137 | 131 | 149 | 141 | 134 | 122 | 100 | 82 | 64 | 65 | 78 | 87 |
| pm10 | 86 | 68 | 78 | 107 | 171 | 97 | 97 | 77 | 37 | 33 | 45 | 59 | 93 | 94 | 82 | 88 | 71 | 79 | 104 | 74 |
| so2 | 11 | 11 | 12 | 16 | 28 | 17 | 13 | 7.7 | 6.8 | 7.5 | 9.3 | 8.9 | 8.4 | 13 | 14 | 21 | 24 | 19 | 13 | 8 |