Air Pollution in Qingni: Real-time Air Quality Index and smog alert.
Pollution and air quality forecast for Qingni. Today is Tuesday, June 16, 2026. The following air pollution values have been recorded for Qingni:- particulate matter (PM10) suspended dust - 7 (Good)
- particulate matter (PM2.5) dust - 2 (Good)
- carbon monoxide (CO) - 100 (Good)
- nitrogen dioxide (NO2) - 8 (Good)
- ozone (O3) - 0 (Good)
- sulfur dioxide (SO2) - 9 (Good)

What is the air quality in Qingni today? Is the air polluted in Qingni?. Is there smog?
What is the level of PM10 today in Qingni? (particulate matter (PM10) suspended dust)
The current level of particulate matter PM10 in Qingni is:
7 (Good)
The highest PM10 values usually occur in month: 102 (March 2019).
The lowest value of particulate matter PM10 pollution in Qingni is usually recorded in: August (28).
What is the current level of PM2.5 in Qingni? (particulate matter (PM2.5) dust)
Today's PM2.5 level is:
2 (Good)
For comparison, the highest level of PM2.5 in Qingni in the last 7 days was: 24 (Friday, May 27, 2022) and the lowest: 24 (Friday, May 27, 2022).
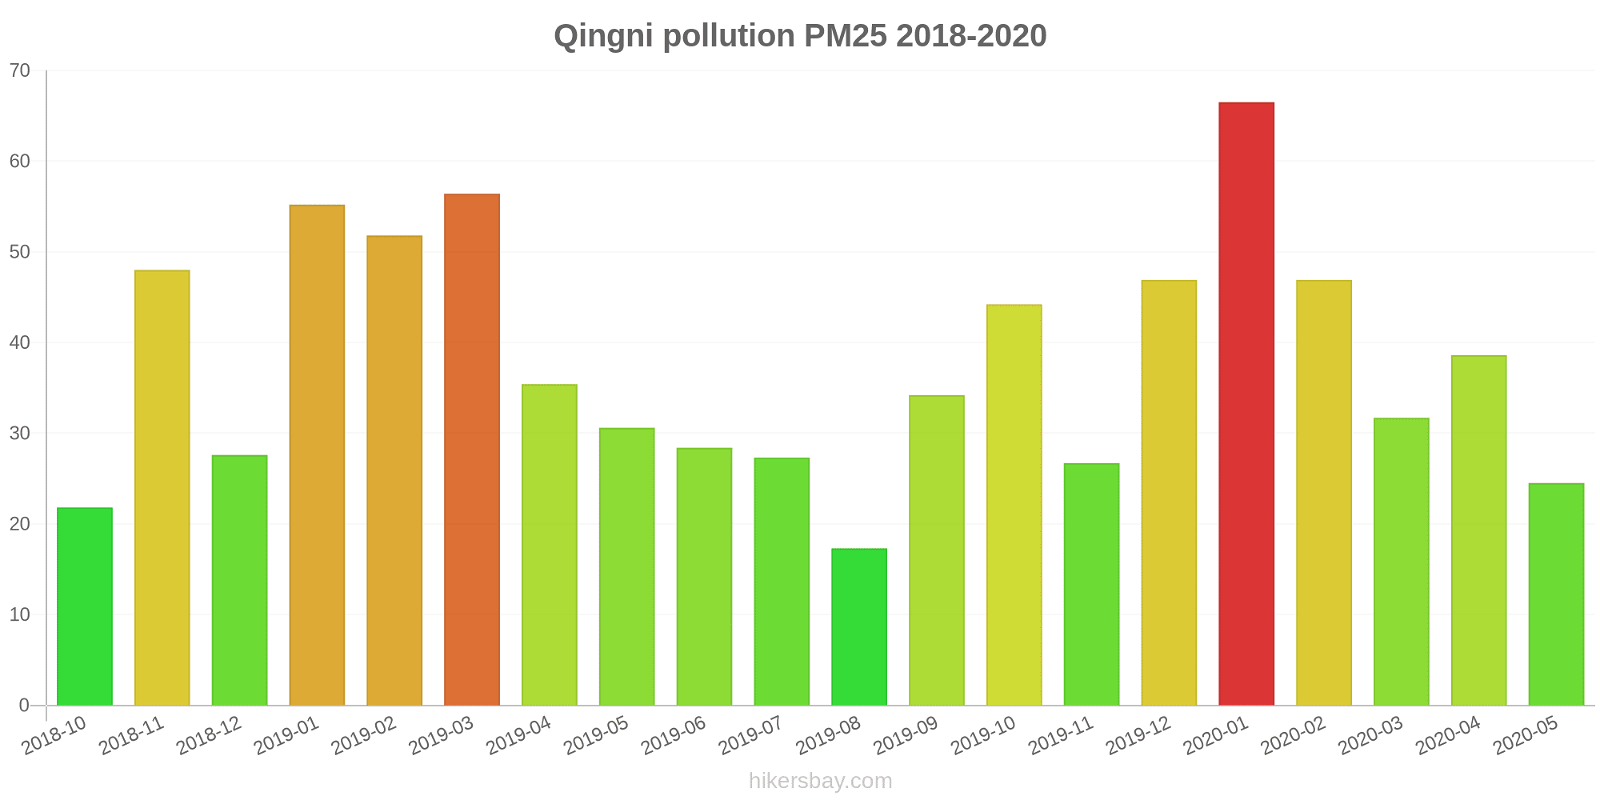
The highest PM2.5 values were recorded: 67 (January 2020).
The lowest level of particulate matter PM2.5 pollution occurs in month: August (17).
How high is the CO level? (carbon monoxide (CO))
100 (Good)
How high is the level of NO2? (nitrogen dioxide (NO2))
8 (Good)
How is the O3 level today in Qingni? (ozone (O3))
0 (Good)
What is the level of SO2 pollution? (sulfur dioxide (SO2))
9 (Good)
Current data Friday, May 27, 2022, 12:00 PM
PM10 7 (Good)
PM2,5 2 (Good)
CO 100 (Good)
NO2 8 (Good)
O3 0 (Good)
SO2 9 (Good)
Data on air pollution from recent days in Qingni
index
2022-05-27
pm10
32
Moderate
pm25
24
Moderate
co
468
Good
no2
21
Good
o3
32
Good
so2
5
Good
data source »
Air pollution in Qingni from October 2018 to May 2020
index
2020-05
2020-04
2020-03
2020-02
2020-01
2019-12
2019-11
2019-10
2019-09
2019-08
2019-07
2019-06
2019-05
2019-04
2019-03
2019-02
2019-01
2018-12
2018-11
2018-10
pm25
25 (Moderate)
39 (Unhealthy for Sensitive Groups)
32 (Moderate)
47 (Unhealthy for Sensitive Groups)
67 (Unhealthy)
47 (Unhealthy for Sensitive Groups)
27 (Moderate)
44 (Unhealthy for Sensitive Groups)
34 (Moderate)
17 (Moderate)
27 (Moderate)
28 (Moderate)
31 (Moderate)
35 (Unhealthy for Sensitive Groups)
56 (Unhealthy)
52 (Unhealthy for Sensitive Groups)
55 (Unhealthy)
28 (Moderate)
48 (Unhealthy for Sensitive Groups)
22 (Moderate)
co
416 (Good)
711 (Good)
632 (Good)
718 (Good)
1 (Good)
846 (Good)
700 (Good)
765 (Good)
727 (Good)
687 (Good)
582 (Good)
403 (Good)
426 (Good)
467 (Good)
737 (Good)
1 (Good)
1 (Good)
859 (Good)
1 (Good)
803 (Good)
no2
20 (Good)
25 (Good)
27 (Good)
22 (Good)
43 (Moderate)
38 (Good)
35 (Good)
32 (Good)
26 (Good)
16 (Good)
12 (Good)
19 (Good)
26 (Good)
33 (Good)
46 (Moderate)
40 (Moderate)
49 (Moderate)
30 (Good)
41 (Moderate)
32 (Good)
o3
130 (Unhealthy for Sensitive Groups)
132 (Unhealthy for Sensitive Groups)
97 (Moderate)
82 (Moderate)
63 (Good)
60 (Good)
65 (Good)
109 (Moderate)
144 (Unhealthy for Sensitive Groups)
123 (Unhealthy for Sensitive Groups)
149 (Unhealthy for Sensitive Groups)
150 (Unhealthy)
154 (Unhealthy)
116 (Moderate)
105 (Moderate)
80 (Moderate)
56 (Good)
58 (Good)
73 (Moderate)
89 (Moderate)
pm10
40 (Moderate)
66 (Unhealthy for Sensitive Groups)
54 (Unhealthy for Sensitive Groups)
62 (Unhealthy for Sensitive Groups)
83 (Unhealthy)
67 (Unhealthy for Sensitive Groups)
53 (Unhealthy for Sensitive Groups)
73 (Unhealthy for Sensitive Groups)
44 (Moderate)
28 (Moderate)
32 (Moderate)
56 (Unhealthy for Sensitive Groups)
74 (Unhealthy for Sensitive Groups)
79 (Unhealthy for Sensitive Groups)
102 (Unhealthy)
89 (Unhealthy)
95 (Unhealthy)
55 (Unhealthy for Sensitive Groups)
90 (Unhealthy)
43 (Moderate)
so2
9.2 (Good)
11 (Good)
15 (Good)
15 (Good)
23 (Good)
16 (Good)
13 (Good)
9.7 (Good)
9.8 (Good)
6 (Good)
5.5 (Good)
6.7 (Good)
12 (Good)
11 (Good)
17 (Good)
23 (Good)
24 (Good)
17 (Good)
17 (Good)
10 (Good)
data source »
Quality of life in Qingni
Green and Parks in the City
Qingni
63%
Mongolia: 27%
Bhutan: 82%
Hong Kong: 52%
Myanmar: 33%
particulate matter PM2.5
Qingni
39 (Unhealthy for Sensitive Groups)
Pleasure of spending time in the city
Qingni
50%
Mongolia: 22%
Bhutan: 61%
Hong Kong: 43%
Myanmar: 24%
particulate matter PM10
Qingni
67 (Unhealthy for Sensitive Groups)
Air Pollution
Qingni
63%
Mongolia: 87%
Bhutan: 45%
Hong Kong: 67%
Myanmar: 83%
Garbage Disposal
Qingni
62%
Mongolia: 27%
Bhutan: 47%
Hong Kong: 52%
Myanmar: 12%
Availability and quality of drinking water
Qingni
54%
Mongolia: 46%
Bhutan: 64%
Hong Kong: 66%
Myanmar: 34%
Cleanliness and tidiness
Qingni
58%
Mongolia: 29%
Bhutan: 57%
Hong Kong: 54%
Myanmar: 18%
Noise and Light pollution
Qingni
48%
Mongolia: 48%
Bhutan: 55%
Hong Kong: 66%
Myanmar: 52%
Water Pollution
Qingni
50%
Mongolia: 68%
Bhutan: 56%
Hong Kong: 53%
Myanmar: 74%
Source: Numbeo
青泥洼桥
Friday, May 27, 2022, 12:00 PM
PM10 6.7 (Good)
particulate matter (PM10) suspended dust
PM2,5 1.7 (Good)
particulate matter (PM2.5) dust
CO 100 (Good)
carbon monoxide (CO)
NO2 7.6 (Good)
nitrogen dioxide (NO2)
O3 0.02 (Good)
ozone (O3)
SO2 8.6 (Good)
sulfur dioxide (SO2)
青泥洼桥
index
2022-05-27
pm10
32
pm25
24
co
468
no2
21
o3
32
so2
4.6
青泥洼桥
2018-10 2020-05
index
2020-05
2020-04
2020-03
2020-02
2020-01
2019-12
2019-11
2019-10
2019-09
2019-08
2019-07
2019-06
2019-05
2019-04
2019-03
2019-02
2019-01
2018-12
2018-11
2018-10
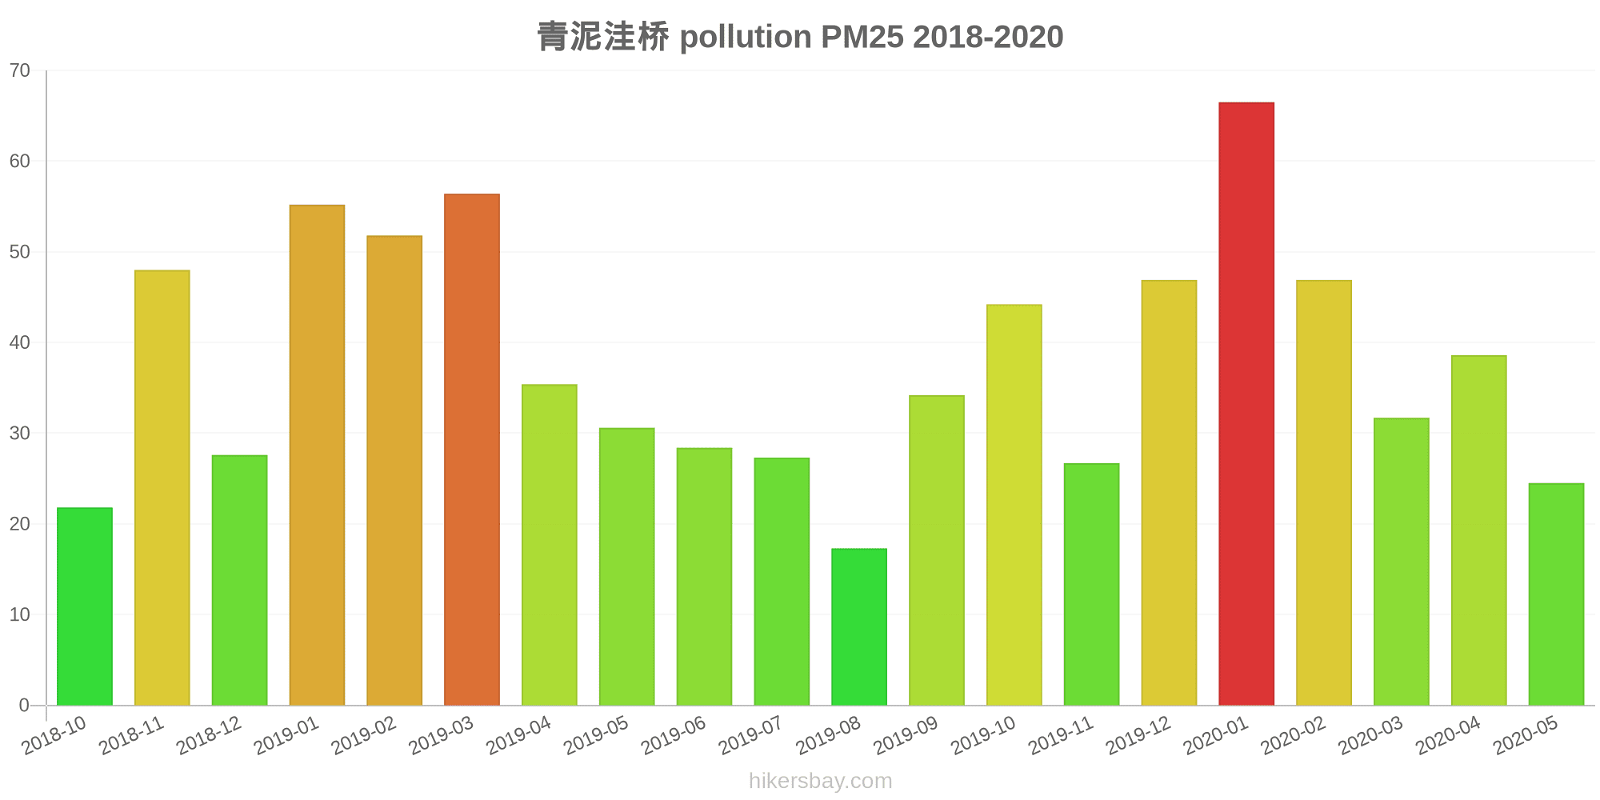
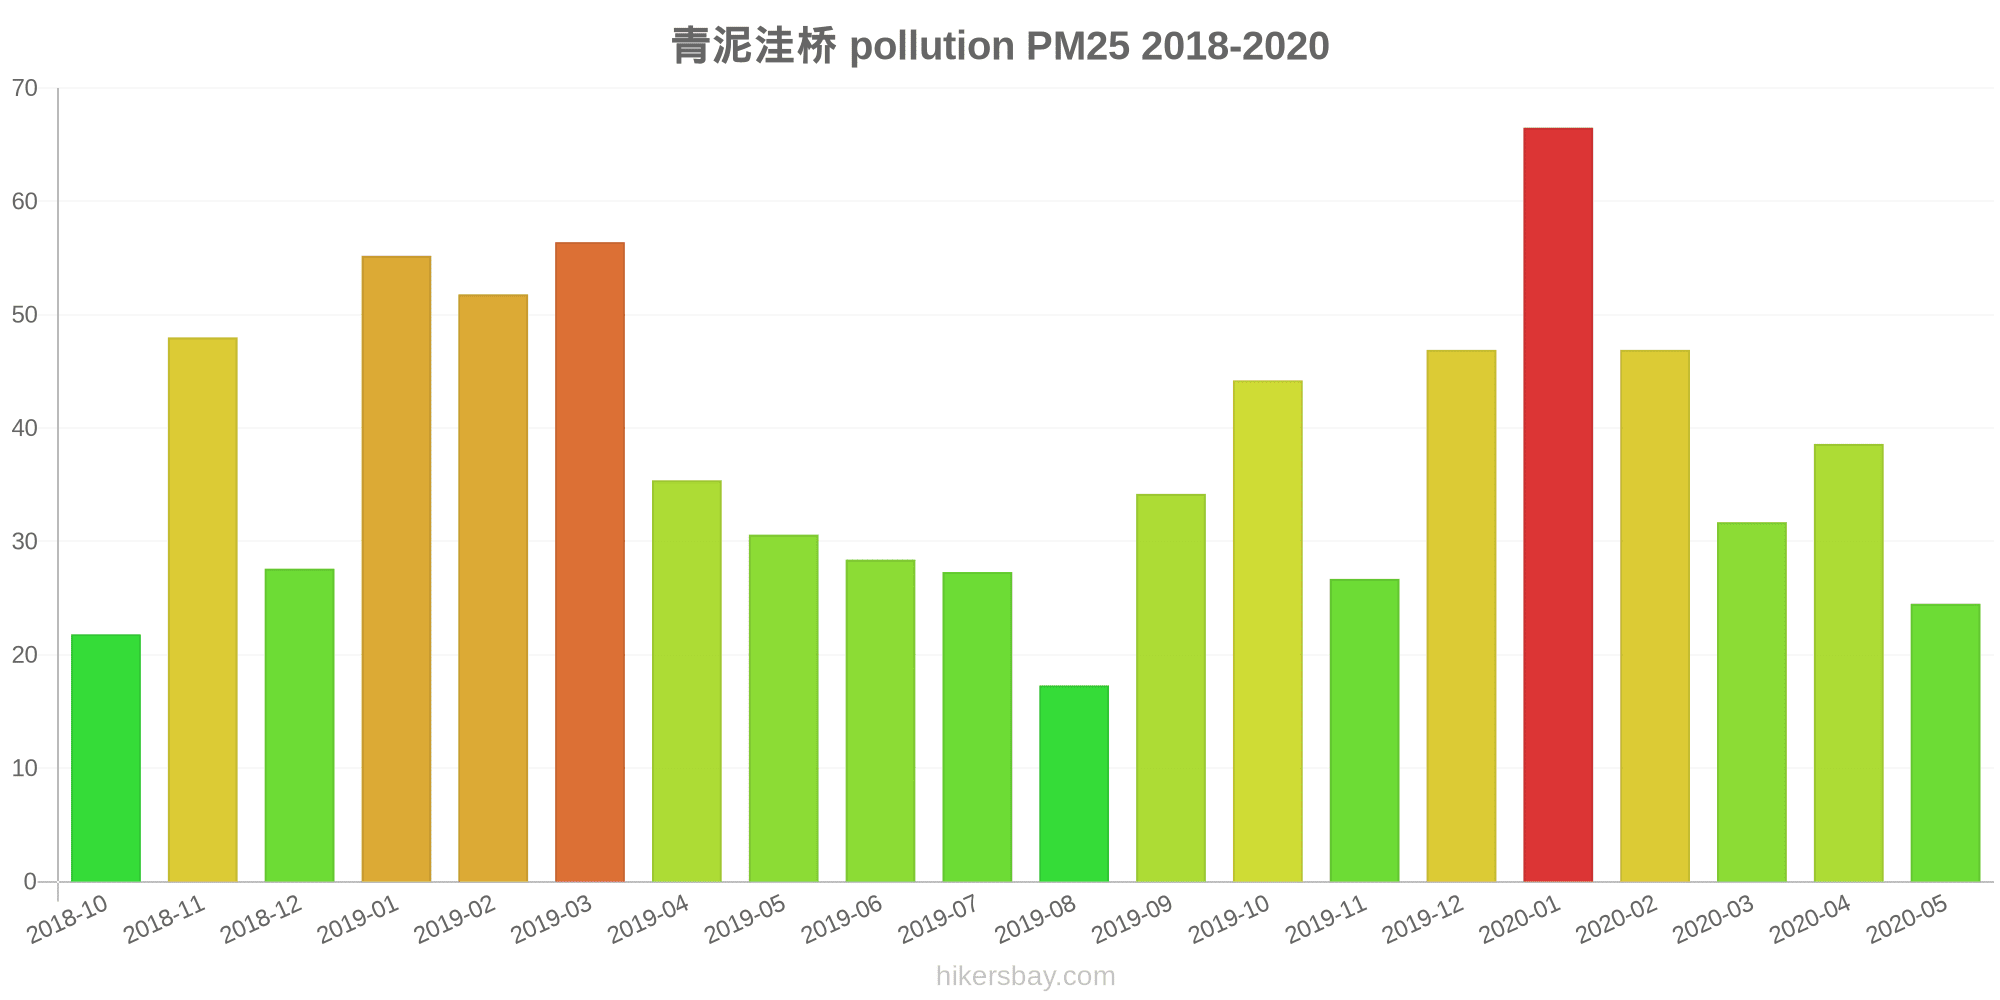
pm25
25
39
32
47
67
47
27
44
34
17
27
28
31
35
56
52
55
28
48
22
co
416
711
632
718
1
846
700
765
727
687
582
403
426
467
737
1
1
859
1
803
no2
20
25
27
22
43
38
35
32
26
16
12
19
26
33
46
40
49
30
41
32
o3
130
132
97
82
63
60
65
109
144
123
149
150
154
116
105
80
56
58
73
89
pm10
40
66
54
62
83
67
53
73
44
28
32
56
74
79
102
89
95
55
90
43
so2
9.2
11
15
15
23
16
13
9.7
9.8
6
5.5
6.7
12
11
17
23
24
17
17
10
* Pollution data source:
https://openaq.org
(ChinaAQIData)
The data is licensed under CC-By 4.0
PM10 7 (Good)
PM2,5 2 (Good)
CO 100 (Good)
NO2 8 (Good)
O3 0 (Good)
SO2 9 (Good)
Data on air pollution from recent days in Qingni
| index | 2022-05-27 |
|---|---|
| pm10 | 32 Moderate |
| pm25 | 24 Moderate |
| co | 468 Good |
| no2 | 21 Good |
| o3 | 32 Good |
| so2 | 5 Good |

| index | 2020-05 | 2020-04 | 2020-03 | 2020-02 | 2020-01 | 2019-12 | 2019-11 | 2019-10 | 2019-09 | 2019-08 | 2019-07 | 2019-06 | 2019-05 | 2019-04 | 2019-03 | 2019-02 | 2019-01 | 2018-12 | 2018-11 | 2018-10 |
|---|---|---|---|---|---|---|---|---|---|---|---|---|---|---|---|---|---|---|---|---|
| pm25 | 25 (Moderate) | 39 (Unhealthy for Sensitive Groups) | 32 (Moderate) | 47 (Unhealthy for Sensitive Groups) | 67 (Unhealthy) | 47 (Unhealthy for Sensitive Groups) | 27 (Moderate) | 44 (Unhealthy for Sensitive Groups) | 34 (Moderate) | 17 (Moderate) | 27 (Moderate) | 28 (Moderate) | 31 (Moderate) | 35 (Unhealthy for Sensitive Groups) | 56 (Unhealthy) | 52 (Unhealthy for Sensitive Groups) | 55 (Unhealthy) | 28 (Moderate) | 48 (Unhealthy for Sensitive Groups) | 22 (Moderate) |
| co | 416 (Good) | 711 (Good) | 632 (Good) | 718 (Good) | 1 (Good) | 846 (Good) | 700 (Good) | 765 (Good) | 727 (Good) | 687 (Good) | 582 (Good) | 403 (Good) | 426 (Good) | 467 (Good) | 737 (Good) | 1 (Good) | 1 (Good) | 859 (Good) | 1 (Good) | 803 (Good) |
| no2 | 20 (Good) | 25 (Good) | 27 (Good) | 22 (Good) | 43 (Moderate) | 38 (Good) | 35 (Good) | 32 (Good) | 26 (Good) | 16 (Good) | 12 (Good) | 19 (Good) | 26 (Good) | 33 (Good) | 46 (Moderate) | 40 (Moderate) | 49 (Moderate) | 30 (Good) | 41 (Moderate) | 32 (Good) |
| o3 | 130 (Unhealthy for Sensitive Groups) | 132 (Unhealthy for Sensitive Groups) | 97 (Moderate) | 82 (Moderate) | 63 (Good) | 60 (Good) | 65 (Good) | 109 (Moderate) | 144 (Unhealthy for Sensitive Groups) | 123 (Unhealthy for Sensitive Groups) | 149 (Unhealthy for Sensitive Groups) | 150 (Unhealthy) | 154 (Unhealthy) | 116 (Moderate) | 105 (Moderate) | 80 (Moderate) | 56 (Good) | 58 (Good) | 73 (Moderate) | 89 (Moderate) |
| pm10 | 40 (Moderate) | 66 (Unhealthy for Sensitive Groups) | 54 (Unhealthy for Sensitive Groups) | 62 (Unhealthy for Sensitive Groups) | 83 (Unhealthy) | 67 (Unhealthy for Sensitive Groups) | 53 (Unhealthy for Sensitive Groups) | 73 (Unhealthy for Sensitive Groups) | 44 (Moderate) | 28 (Moderate) | 32 (Moderate) | 56 (Unhealthy for Sensitive Groups) | 74 (Unhealthy for Sensitive Groups) | 79 (Unhealthy for Sensitive Groups) | 102 (Unhealthy) | 89 (Unhealthy) | 95 (Unhealthy) | 55 (Unhealthy for Sensitive Groups) | 90 (Unhealthy) | 43 (Moderate) |
| so2 | 9.2 (Good) | 11 (Good) | 15 (Good) | 15 (Good) | 23 (Good) | 16 (Good) | 13 (Good) | 9.7 (Good) | 9.8 (Good) | 6 (Good) | 5.5 (Good) | 6.7 (Good) | 12 (Good) | 11 (Good) | 17 (Good) | 23 (Good) | 24 (Good) | 17 (Good) | 17 (Good) | 10 (Good) |
Green and Parks in the City
Qingni 63%
Mongolia: 27% Bhutan: 82% Hong Kong: 52% Myanmar: 33%particulate matter PM2.5
Qingni 39 (Unhealthy for Sensitive Groups)
Pleasure of spending time in the city
Qingni 50%
Mongolia: 22% Bhutan: 61% Hong Kong: 43% Myanmar: 24%particulate matter PM10
Qingni 67 (Unhealthy for Sensitive Groups)
Air Pollution
Qingni 63%
Mongolia: 87% Bhutan: 45% Hong Kong: 67% Myanmar: 83%Garbage Disposal
Qingni 62%
Mongolia: 27% Bhutan: 47% Hong Kong: 52% Myanmar: 12%Availability and quality of drinking water
Qingni 54%
Mongolia: 46% Bhutan: 64% Hong Kong: 66% Myanmar: 34%Cleanliness and tidiness
Qingni 58%
Mongolia: 29% Bhutan: 57% Hong Kong: 54% Myanmar: 18%Noise and Light pollution
Qingni 48%
Mongolia: 48% Bhutan: 55% Hong Kong: 66% Myanmar: 52%Water Pollution
Qingni 50%
Mongolia: 68% Bhutan: 56% Hong Kong: 53% Myanmar: 74%PM10 6.7 (Good)
particulate matter (PM10) suspended dustPM2,5 1.7 (Good)
particulate matter (PM2.5) dustCO 100 (Good)
carbon monoxide (CO)NO2 7.6 (Good)
nitrogen dioxide (NO2)O3 0.02 (Good)
ozone (O3)SO2 8.6 (Good)
sulfur dioxide (SO2)青泥洼桥
| index | 2022-05-27 |
|---|---|
| pm10 | 32 |
| pm25 | 24 |
| co | 468 |
| no2 | 21 |
| o3 | 32 |
| so2 | 4.6 |
青泥洼桥
| index | 2020-05 | 2020-04 | 2020-03 | 2020-02 | 2020-01 | 2019-12 | 2019-11 | 2019-10 | 2019-09 | 2019-08 | 2019-07 | 2019-06 | 2019-05 | 2019-04 | 2019-03 | 2019-02 | 2019-01 | 2018-12 | 2018-11 | 2018-10 |
|---|---|---|---|---|---|---|---|---|---|---|---|---|---|---|---|---|---|---|---|---|
| pm25 | 25 | 39 | 32 | 47 | 67 | 47 | 27 | 44 | 34 | 17 | 27 | 28 | 31 | 35 | 56 | 52 | 55 | 28 | 48 | 22 |
| co | 416 | 711 | 632 | 718 | 1 | 846 | 700 | 765 | 727 | 687 | 582 | 403 | 426 | 467 | 737 | 1 | 1 | 859 | 1 | 803 |
| no2 | 20 | 25 | 27 | 22 | 43 | 38 | 35 | 32 | 26 | 16 | 12 | 19 | 26 | 33 | 46 | 40 | 49 | 30 | 41 | 32 |
| o3 | 130 | 132 | 97 | 82 | 63 | 60 | 65 | 109 | 144 | 123 | 149 | 150 | 154 | 116 | 105 | 80 | 56 | 58 | 73 | 89 |
| pm10 | 40 | 66 | 54 | 62 | 83 | 67 | 53 | 73 | 44 | 28 | 32 | 56 | 74 | 79 | 102 | 89 | 95 | 55 | 90 | 43 |
| so2 | 9.2 | 11 | 15 | 15 | 23 | 16 | 13 | 9.7 | 9.8 | 6 | 5.5 | 6.7 | 12 | 11 | 17 | 23 | 24 | 17 | 17 | 10 |