Air Pollution in Beishan: Real-time Air Quality Index and smog alert.
Pollution and air quality forecast for Beishan. Today is Tuesday, June 16, 2026. The following air pollution values have been recorded for Beishan:- particulate matter (PM10) suspended dust - 7 (Good)
- particulate matter (PM2.5) dust - 2 (Good)
- carbon monoxide (CO) - 100 (Good)
- nitrogen dioxide (NO2) - 8 (Good)
- ozone (O3) - 0 (Good)
- sulfur dioxide (SO2) - 9 (Good)

What is the air quality in Beishan today? Is the air polluted in Beishan?. Is there smog?
What is the level of PM10 today in Beishan? (particulate matter (PM10) suspended dust)
The current level of particulate matter PM10 in Beishan is:
7 (Good)
The highest PM10 values usually occur in month: 96 (March 2019).
The lowest value of particulate matter PM10 pollution in Beishan is usually recorded in: August (33).
What is the current level of PM2.5 in Beishan? (particulate matter (PM2.5) dust)
Today's PM2.5 level is:
2 (Good)
For comparison, the highest level of PM2.5 in Beishan in the last 7 days was: 24 (Friday, May 27, 2022) and the lowest: 24 (Friday, May 27, 2022).
The highest PM2.5 values were recorded: 62 (January 2020).
The lowest level of particulate matter PM2.5 pollution occurs in month: August (17).
How high is the CO level? (carbon monoxide (CO))
100 (Good)
How high is the level of NO2? (nitrogen dioxide (NO2))
8 (Good)
How is the O3 level today in Beishan? (ozone (O3))
0 (Good)
What is the level of SO2 pollution? (sulfur dioxide (SO2))
9 (Good)
Current data Friday, May 27, 2022, 12:00 PM
PM10 7 (Good)
PM2,5 2 (Good)
CO 100 (Good)
NO2 8 (Good)
O3 0 (Good)
SO2 9 (Good)
Data on air pollution from recent days in Beishan
index
2022-05-27
pm10
32
Moderate
pm25
24
Moderate
co
468
Good
no2
21
Good
o3
32
Good
so2
5
Good
data source »
Air pollution in Beishan from October 2018 to May 2020

index
2020-05
2020-04
2020-03
2020-02
2020-01
2019-12
2019-11
2019-10
2019-09
2019-08
2019-07
2019-06
2019-05
2019-04
2019-03
2019-02
2019-01
2018-12
2018-11
2018-10
pm25
25 (Moderate)
38 (Unhealthy for Sensitive Groups)
31 (Moderate)
45 (Unhealthy for Sensitive Groups)
62 (Unhealthy)
45 (Unhealthy for Sensitive Groups)
28 (Moderate)
44 (Unhealthy for Sensitive Groups)
32 (Moderate)
17 (Moderate)
24 (Moderate)
28 (Moderate)
31 (Moderate)
34 (Moderate)
56 (Unhealthy)
50 (Unhealthy for Sensitive Groups)
53 (Unhealthy for Sensitive Groups)
30 (Moderate)
48 (Unhealthy for Sensitive Groups)
28 (Moderate)
co
491 (Good)
527 (Good)
513 (Good)
622 (Good)
740 (Good)
570 (Good)
434 (Good)
534 (Good)
489 (Good)
424 (Good)
559 (Good)
486 (Good)
522 (Good)
548 (Good)
726 (Good)
902 (Good)
838 (Good)
679 (Good)
805 (Good)
563 (Good)
no2
32 (Good)
32 (Good)
31 (Good)
27 (Good)
39 (Good)
41 (Moderate)
32 (Good)
32 (Good)
31 (Good)
20 (Good)
23 (Good)
24 (Good)
29 (Good)
34 (Good)
43 (Moderate)
36 (Good)
44 (Moderate)
32 (Good)
46 (Moderate)
31 (Good)
o3
122 (Unhealthy for Sensitive Groups)
137 (Unhealthy for Sensitive Groups)
101 (Moderate)
86 (Moderate)
69 (Good)
53 (Good)
60 (Good)
95 (Moderate)
130 (Unhealthy for Sensitive Groups)
116 (Moderate)
134 (Unhealthy for Sensitive Groups)
128 (Unhealthy for Sensitive Groups)
148 (Unhealthy for Sensitive Groups)
120 (Unhealthy for Sensitive Groups)
108 (Moderate)
81 (Moderate)
61 (Good)
62 (Good)
77 (Moderate)
91 (Moderate)
pm10
51 (Unhealthy for Sensitive Groups)
74 (Unhealthy for Sensitive Groups)
59 (Unhealthy for Sensitive Groups)
74 (Unhealthy for Sensitive Groups)
88 (Unhealthy)
69 (Unhealthy for Sensitive Groups)
57 (Unhealthy for Sensitive Groups)
82 (Unhealthy)
56 (Unhealthy for Sensitive Groups)
33 (Moderate)
47 (Moderate)
55 (Unhealthy for Sensitive Groups)
78 (Unhealthy for Sensitive Groups)
80 (Unhealthy for Sensitive Groups)
96 (Unhealthy)
79 (Unhealthy for Sensitive Groups)
87 (Unhealthy)
58 (Unhealthy for Sensitive Groups)
84 (Unhealthy)
51 (Unhealthy for Sensitive Groups)
so2
9.9 (Good)
11 (Good)
15 (Good)
15 (Good)
18 (Good)
17 (Good)
11 (Good)
7.2 (Good)
7.3 (Good)
5.6 (Good)
5.1 (Good)
5.5 (Good)
8.5 (Good)
8 (Good)
15 (Good)
24 (Good)
28 (Good)
17 (Good)
19 (Good)
7.4 (Good)
data source »
甘井子
Friday, May 27, 2022, 12:00 PM
PM10 6.7 (Good)
particulate matter (PM10) suspended dust
PM2,5 1.7 (Good)
particulate matter (PM2.5) dust
CO 100 (Good)
carbon monoxide (CO)
NO2 7.6 (Good)
nitrogen dioxide (NO2)
O3 0.02 (Good)
ozone (O3)
SO2 8.6 (Good)
sulfur dioxide (SO2)
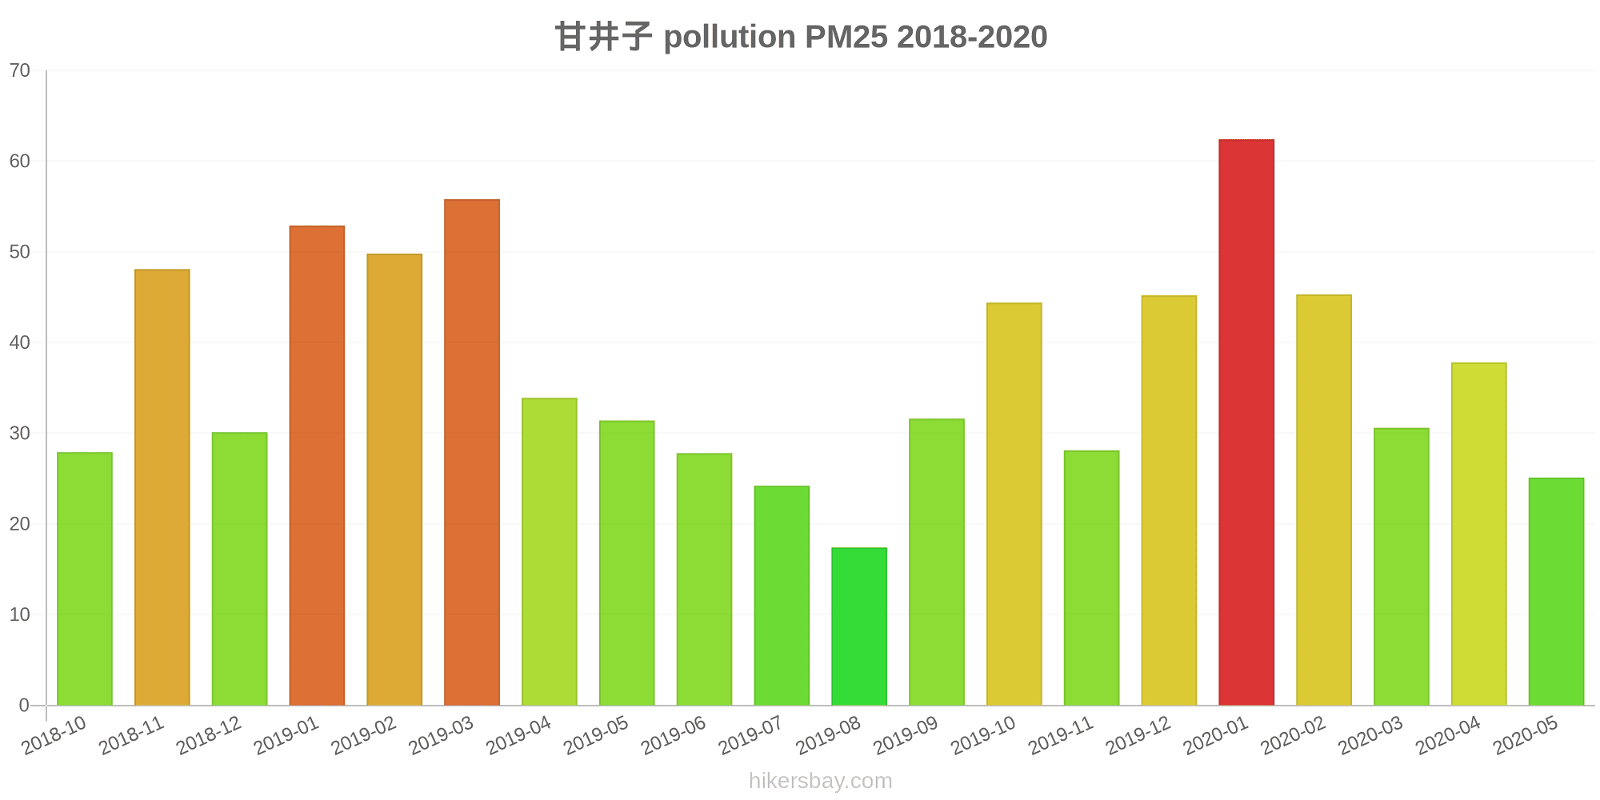
甘井子
index
2022-05-27
pm10
32
pm25
24
co
468
no2
21
o3
32
so2
4.6
甘井子
2018-10 2020-05
index
2020-05
2020-04
2020-03
2020-02
2020-01
2019-12
2019-11
2019-10
2019-09
2019-08
2019-07
2019-06
2019-05
2019-04
2019-03
2019-02
2019-01
2018-12
2018-11
2018-10
pm25
25
38
31
45
62
45
28
44
32
17
24
28
31
34
56
50
53
30
48
28
co
491
527
513
622
740
570
434
534
489
424
559
486
522
548
726
902
838
679
805
563
no2
32
32
31
27
39
41
32
32
31
20
23
24
29
34
43
36
44
32
46
31
o3
122
137
101
86
69
53
60
95
130
116
134
128
148
120
108
81
61
62
77
91
pm10
51
74
59
74
88
69
57
82
56
33
47
55
78
80
96
79
87
58
84
51
so2
9.9
11
15
15
18
17
11
7.2
7.3
5.6
5.1
5.5
8.5
8
15
24
28
17
19
7.4
* Pollution data source:
https://openaq.org
(ChinaAQIData)
The data is licensed under CC-By 4.0
PM10 7 (Good)
PM2,5 2 (Good)
CO 100 (Good)
NO2 8 (Good)
O3 0 (Good)
SO2 9 (Good)
Data on air pollution from recent days in Beishan
| index | 2022-05-27 |
|---|---|
| pm10 | 32 Moderate |
| pm25 | 24 Moderate |
| co | 468 Good |
| no2 | 21 Good |
| o3 | 32 Good |
| so2 | 5 Good |

| index | 2020-05 | 2020-04 | 2020-03 | 2020-02 | 2020-01 | 2019-12 | 2019-11 | 2019-10 | 2019-09 | 2019-08 | 2019-07 | 2019-06 | 2019-05 | 2019-04 | 2019-03 | 2019-02 | 2019-01 | 2018-12 | 2018-11 | 2018-10 |
|---|---|---|---|---|---|---|---|---|---|---|---|---|---|---|---|---|---|---|---|---|
| pm25 | 25 (Moderate) | 38 (Unhealthy for Sensitive Groups) | 31 (Moderate) | 45 (Unhealthy for Sensitive Groups) | 62 (Unhealthy) | 45 (Unhealthy for Sensitive Groups) | 28 (Moderate) | 44 (Unhealthy for Sensitive Groups) | 32 (Moderate) | 17 (Moderate) | 24 (Moderate) | 28 (Moderate) | 31 (Moderate) | 34 (Moderate) | 56 (Unhealthy) | 50 (Unhealthy for Sensitive Groups) | 53 (Unhealthy for Sensitive Groups) | 30 (Moderate) | 48 (Unhealthy for Sensitive Groups) | 28 (Moderate) |
| co | 491 (Good) | 527 (Good) | 513 (Good) | 622 (Good) | 740 (Good) | 570 (Good) | 434 (Good) | 534 (Good) | 489 (Good) | 424 (Good) | 559 (Good) | 486 (Good) | 522 (Good) | 548 (Good) | 726 (Good) | 902 (Good) | 838 (Good) | 679 (Good) | 805 (Good) | 563 (Good) |
| no2 | 32 (Good) | 32 (Good) | 31 (Good) | 27 (Good) | 39 (Good) | 41 (Moderate) | 32 (Good) | 32 (Good) | 31 (Good) | 20 (Good) | 23 (Good) | 24 (Good) | 29 (Good) | 34 (Good) | 43 (Moderate) | 36 (Good) | 44 (Moderate) | 32 (Good) | 46 (Moderate) | 31 (Good) |
| o3 | 122 (Unhealthy for Sensitive Groups) | 137 (Unhealthy for Sensitive Groups) | 101 (Moderate) | 86 (Moderate) | 69 (Good) | 53 (Good) | 60 (Good) | 95 (Moderate) | 130 (Unhealthy for Sensitive Groups) | 116 (Moderate) | 134 (Unhealthy for Sensitive Groups) | 128 (Unhealthy for Sensitive Groups) | 148 (Unhealthy for Sensitive Groups) | 120 (Unhealthy for Sensitive Groups) | 108 (Moderate) | 81 (Moderate) | 61 (Good) | 62 (Good) | 77 (Moderate) | 91 (Moderate) |
| pm10 | 51 (Unhealthy for Sensitive Groups) | 74 (Unhealthy for Sensitive Groups) | 59 (Unhealthy for Sensitive Groups) | 74 (Unhealthy for Sensitive Groups) | 88 (Unhealthy) | 69 (Unhealthy for Sensitive Groups) | 57 (Unhealthy for Sensitive Groups) | 82 (Unhealthy) | 56 (Unhealthy for Sensitive Groups) | 33 (Moderate) | 47 (Moderate) | 55 (Unhealthy for Sensitive Groups) | 78 (Unhealthy for Sensitive Groups) | 80 (Unhealthy for Sensitive Groups) | 96 (Unhealthy) | 79 (Unhealthy for Sensitive Groups) | 87 (Unhealthy) | 58 (Unhealthy for Sensitive Groups) | 84 (Unhealthy) | 51 (Unhealthy for Sensitive Groups) |
| so2 | 9.9 (Good) | 11 (Good) | 15 (Good) | 15 (Good) | 18 (Good) | 17 (Good) | 11 (Good) | 7.2 (Good) | 7.3 (Good) | 5.6 (Good) | 5.1 (Good) | 5.5 (Good) | 8.5 (Good) | 8 (Good) | 15 (Good) | 24 (Good) | 28 (Good) | 17 (Good) | 19 (Good) | 7.4 (Good) |
PM10 6.7 (Good)
particulate matter (PM10) suspended dustPM2,5 1.7 (Good)
particulate matter (PM2.5) dustCO 100 (Good)
carbon monoxide (CO)NO2 7.6 (Good)
nitrogen dioxide (NO2)O3 0.02 (Good)
ozone (O3)SO2 8.6 (Good)
sulfur dioxide (SO2)甘井子
| index | 2022-05-27 |
|---|---|
| pm10 | 32 |
| pm25 | 24 |
| co | 468 |
| no2 | 21 |
| o3 | 32 |
| so2 | 4.6 |
甘井子

| index | 2020-05 | 2020-04 | 2020-03 | 2020-02 | 2020-01 | 2019-12 | 2019-11 | 2019-10 | 2019-09 | 2019-08 | 2019-07 | 2019-06 | 2019-05 | 2019-04 | 2019-03 | 2019-02 | 2019-01 | 2018-12 | 2018-11 | 2018-10 |
|---|---|---|---|---|---|---|---|---|---|---|---|---|---|---|---|---|---|---|---|---|
| pm25 | 25 | 38 | 31 | 45 | 62 | 45 | 28 | 44 | 32 | 17 | 24 | 28 | 31 | 34 | 56 | 50 | 53 | 30 | 48 | 28 |
| co | 491 | 527 | 513 | 622 | 740 | 570 | 434 | 534 | 489 | 424 | 559 | 486 | 522 | 548 | 726 | 902 | 838 | 679 | 805 | 563 |
| no2 | 32 | 32 | 31 | 27 | 39 | 41 | 32 | 32 | 31 | 20 | 23 | 24 | 29 | 34 | 43 | 36 | 44 | 32 | 46 | 31 |
| o3 | 122 | 137 | 101 | 86 | 69 | 53 | 60 | 95 | 130 | 116 | 134 | 128 | 148 | 120 | 108 | 81 | 61 | 62 | 77 | 91 |
| pm10 | 51 | 74 | 59 | 74 | 88 | 69 | 57 | 82 | 56 | 33 | 47 | 55 | 78 | 80 | 96 | 79 | 87 | 58 | 84 | 51 |
| so2 | 9.9 | 11 | 15 | 15 | 18 | 17 | 11 | 7.2 | 7.3 | 5.6 | 5.1 | 5.5 | 8.5 | 8 | 15 | 24 | 28 | 17 | 19 | 7.4 |