Air Pollution in Yangwang: Real-time Air Quality Index and smog alert.
Pollution and air quality forecast for Yangwang. Today is Wednesday, June 10, 2026. The following air pollution values have been recorded for Yangwang:- particulate matter (PM2.5) dust - 61 (Unhealthy)
- nitrogen dioxide (NO2) - 22 (Good)
- particulate matter (PM10) suspended dust - 69 (Unhealthy for Sensitive Groups)
- carbon monoxide (CO) - 219 (Good)
- ozone (O3) - 0 (Good)
- sulfur dioxide (SO2) - 8 (Good)

What is the air quality in Yangwang today? Is the air polluted in Yangwang?. Is there smog?
What is the current level of PM2.5 in Yangwang? (particulate matter (PM2.5) dust)
Today's PM2.5 level is:
61 (Unhealthy)
For comparison, the highest level of PM2.5 in Yangwang in the last 7 days was: 28 (Friday, May 27, 2022) and the lowest: 28 (Friday, May 27, 2022).
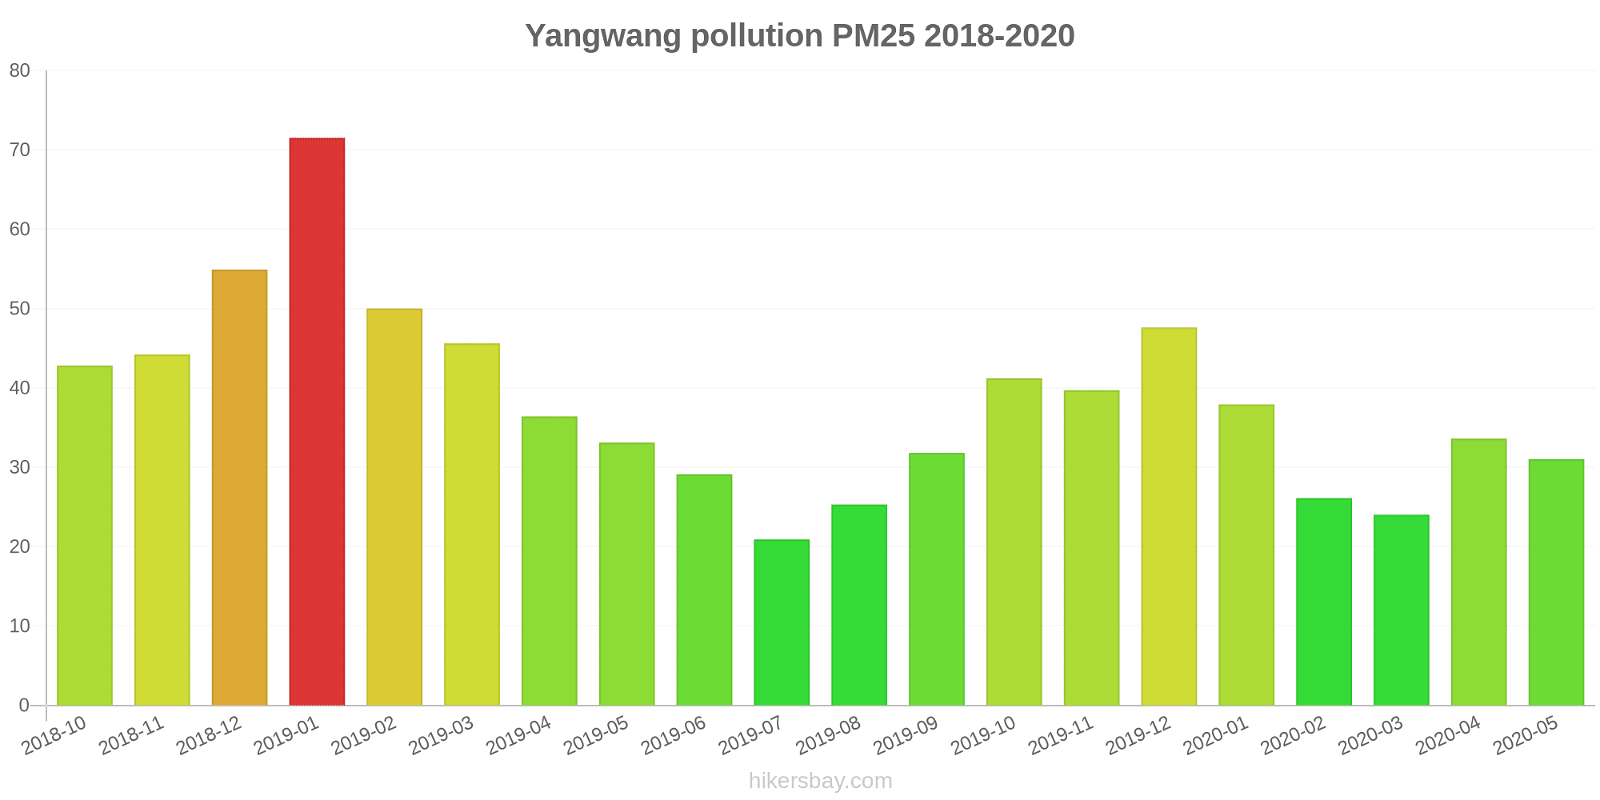
The highest PM2.5 values were recorded: 72 (January 2019).
The lowest level of particulate matter PM2.5 pollution occurs in month: July (21).
How high is the level of NO2? (nitrogen dioxide (NO2))
22 (Good)
What is the level of PM10 today in Yangwang? (particulate matter (PM10) suspended dust)
The current level of particulate matter PM10 in Yangwang is:
69 (Unhealthy for Sensitive Groups)
The highest PM10 values usually occur in month: 109 (January 2019).
The lowest value of particulate matter PM10 pollution in Yangwang is usually recorded in: July (35).
How high is the CO level? (carbon monoxide (CO))
219 (Good)
How is the O3 level today in Yangwang? (ozone (O3))
0 (Good)
What is the level of SO2 pollution? (sulfur dioxide (SO2))
8 (Good)
Current data Friday, May 27, 2022, 3:00 PM
PM2,5 61 (Unhealthy)
NO2 22 (Good)
PM10 69 (Unhealthy for Sensitive Groups)
CO 219 (Good)
O3 0 (Good)
SO2 8 (Good)
Data on air pollution from recent days in Yangwang
index
2022-05-27
pm25
28
Moderate
no2
22
Good
pm10
35
Moderate
co
579
Good
o3
22
Good
so2
5
Good
data source »
Air pollution in Yangwang from October 2018 to May 2020
index
2020-05
2020-04
2020-03
2020-02
2020-01
2019-12
2019-11
2019-10
2019-09
2019-08
2019-07
2019-06
2019-05
2019-04
2019-03
2019-02
2019-01
2018-12
2018-11
2018-10
pm25
31 (Moderate)
34 (Moderate)
24 (Moderate)
26 (Moderate)
38 (Unhealthy for Sensitive Groups)
48 (Unhealthy for Sensitive Groups)
40 (Unhealthy for Sensitive Groups)
41 (Unhealthy for Sensitive Groups)
32 (Moderate)
25 (Moderate)
21 (Moderate)
29 (Moderate)
33 (Moderate)
36 (Unhealthy for Sensitive Groups)
46 (Unhealthy for Sensitive Groups)
50 (Unhealthy for Sensitive Groups)
72 (Unhealthy)
55 (Unhealthy for Sensitive Groups)
44 (Unhealthy for Sensitive Groups)
43 (Unhealthy for Sensitive Groups)
co
734 (Good)
641 (Good)
596 (Good)
595 (Good)
921 (Good)
984 (Good)
741 (Good)
840 (Good)
672 (Good)
642 (Good)
584 (Good)
636 (Good)
581 (Good)
694 (Good)
743 (Good)
837 (Good)
1 (Good)
941 (Good)
849 (Good)
899 (Good)
no2
28 (Good)
41 (Moderate)
34 (Good)
17 (Good)
33 (Good)
61 (Moderate)
53 (Moderate)
45 (Moderate)
31 (Good)
19 (Good)
19 (Good)
26 (Good)
32 (Good)
40 (Moderate)
44 (Moderate)
32 (Good)
53 (Moderate)
53 (Moderate)
51 (Moderate)
48 (Moderate)
o3
159 (Unhealthy)
149 (Unhealthy for Sensitive Groups)
102 (Moderate)
95 (Moderate)
64 (Good)
58 (Good)
87 (Moderate)
117 (Moderate)
146 (Unhealthy for Sensitive Groups)
142 (Unhealthy for Sensitive Groups)
119 (Moderate)
150 (Unhealthy)
158 (Unhealthy)
132 (Unhealthy for Sensitive Groups)
115 (Moderate)
70 (Moderate)
58 (Good)
42 (Good)
73 (Moderate)
117 (Moderate)
pm10
51 (Unhealthy for Sensitive Groups)
67 (Unhealthy for Sensitive Groups)
44 (Moderate)
40 (Moderate)
54 (Unhealthy for Sensitive Groups)
83 (Unhealthy)
82 (Unhealthy)
77 (Unhealthy for Sensitive Groups)
54 (Unhealthy for Sensitive Groups)
41 (Moderate)
35 (Moderate)
43 (Moderate)
61 (Unhealthy for Sensitive Groups)
63 (Unhealthy for Sensitive Groups)
78 (Unhealthy for Sensitive Groups)
68 (Unhealthy for Sensitive Groups)
109 (Unhealthy)
89 (Unhealthy)
68 (Unhealthy for Sensitive Groups)
75 (Unhealthy for Sensitive Groups)
so2
4.4 (Good)
5.5 (Good)
4.1 (Good)
4 (Good)
5.1 (Good)
8.1 (Good)
8.6 (Good)
9.3 (Good)
7.8 (Good)
5.5 (Good)
5.5 (Good)
6.9 (Good)
9.7 (Good)
12 (Good)
11 (Good)
7.3 (Good)
9.4 (Good)
9 (Good)
12 (Good)
13 (Good)
data source »
袍江站
Friday, May 27, 2022, 3:00 PM
PM2,5 61 (Unhealthy)
particulate matter (PM2.5) dust
NO2 22 (Good)
nitrogen dioxide (NO2)
PM10 69 (Unhealthy for Sensitive Groups)
particulate matter (PM10) suspended dust
CO 219 (Good)
carbon monoxide (CO)
O3 0.05 (Good)
ozone (O3)
SO2 7.7 (Good)
sulfur dioxide (SO2)
袍江站
index
2022-05-27
pm25
28
no2
22
pm10
35
co
579
o3
22
so2
4.6
袍江站
2018-10 2020-05

index
2020-05
2020-04
2020-03
2020-02
2020-01
2019-12
2019-11
2019-10
2019-09
2019-08
2019-07
2019-06
2019-05
2019-04
2019-03
2019-02
2019-01
2018-12
2018-11
2018-10
pm25
31
34
24
26
38
48
40
41
32
25
21
29
33
36
46
50
72
55
44
43
co
734
641
596
595
921
984
741
840
672
642
584
636
581
694
743
837
1
941
849
899
no2
28
41
34
17
33
61
53
45
31
19
19
26
32
40
44
32
53
53
51
48
o3
159
149
102
95
64
58
87
117
146
142
119
150
158
132
115
70
58
42
73
117
pm10
51
67
44
40
54
83
82
77
54
41
35
43
61
63
78
68
109
89
68
75
so2
4.4
5.5
4.1
4
5.1
8.1
8.6
9.3
7.8
5.5
5.5
6.9
9.7
12
11
7.3
9.4
9
12
13
* Pollution data source:
https://openaq.org
(ChinaAQIData)
The data is licensed under CC-By 4.0
PM2,5 61 (Unhealthy)
NO2 22 (Good)
PM10 69 (Unhealthy for Sensitive Groups)
CO 219 (Good)
O3 0 (Good)
SO2 8 (Good)
Data on air pollution from recent days in Yangwang
| index | 2022-05-27 |
|---|---|
| pm25 | 28 Moderate |
| no2 | 22 Good |
| pm10 | 35 Moderate |
| co | 579 Good |
| o3 | 22 Good |
| so2 | 5 Good |

| index | 2020-05 | 2020-04 | 2020-03 | 2020-02 | 2020-01 | 2019-12 | 2019-11 | 2019-10 | 2019-09 | 2019-08 | 2019-07 | 2019-06 | 2019-05 | 2019-04 | 2019-03 | 2019-02 | 2019-01 | 2018-12 | 2018-11 | 2018-10 |
|---|---|---|---|---|---|---|---|---|---|---|---|---|---|---|---|---|---|---|---|---|
| pm25 | 31 (Moderate) | 34 (Moderate) | 24 (Moderate) | 26 (Moderate) | 38 (Unhealthy for Sensitive Groups) | 48 (Unhealthy for Sensitive Groups) | 40 (Unhealthy for Sensitive Groups) | 41 (Unhealthy for Sensitive Groups) | 32 (Moderate) | 25 (Moderate) | 21 (Moderate) | 29 (Moderate) | 33 (Moderate) | 36 (Unhealthy for Sensitive Groups) | 46 (Unhealthy for Sensitive Groups) | 50 (Unhealthy for Sensitive Groups) | 72 (Unhealthy) | 55 (Unhealthy for Sensitive Groups) | 44 (Unhealthy for Sensitive Groups) | 43 (Unhealthy for Sensitive Groups) |
| co | 734 (Good) | 641 (Good) | 596 (Good) | 595 (Good) | 921 (Good) | 984 (Good) | 741 (Good) | 840 (Good) | 672 (Good) | 642 (Good) | 584 (Good) | 636 (Good) | 581 (Good) | 694 (Good) | 743 (Good) | 837 (Good) | 1 (Good) | 941 (Good) | 849 (Good) | 899 (Good) |
| no2 | 28 (Good) | 41 (Moderate) | 34 (Good) | 17 (Good) | 33 (Good) | 61 (Moderate) | 53 (Moderate) | 45 (Moderate) | 31 (Good) | 19 (Good) | 19 (Good) | 26 (Good) | 32 (Good) | 40 (Moderate) | 44 (Moderate) | 32 (Good) | 53 (Moderate) | 53 (Moderate) | 51 (Moderate) | 48 (Moderate) |
| o3 | 159 (Unhealthy) | 149 (Unhealthy for Sensitive Groups) | 102 (Moderate) | 95 (Moderate) | 64 (Good) | 58 (Good) | 87 (Moderate) | 117 (Moderate) | 146 (Unhealthy for Sensitive Groups) | 142 (Unhealthy for Sensitive Groups) | 119 (Moderate) | 150 (Unhealthy) | 158 (Unhealthy) | 132 (Unhealthy for Sensitive Groups) | 115 (Moderate) | 70 (Moderate) | 58 (Good) | 42 (Good) | 73 (Moderate) | 117 (Moderate) |
| pm10 | 51 (Unhealthy for Sensitive Groups) | 67 (Unhealthy for Sensitive Groups) | 44 (Moderate) | 40 (Moderate) | 54 (Unhealthy for Sensitive Groups) | 83 (Unhealthy) | 82 (Unhealthy) | 77 (Unhealthy for Sensitive Groups) | 54 (Unhealthy for Sensitive Groups) | 41 (Moderate) | 35 (Moderate) | 43 (Moderate) | 61 (Unhealthy for Sensitive Groups) | 63 (Unhealthy for Sensitive Groups) | 78 (Unhealthy for Sensitive Groups) | 68 (Unhealthy for Sensitive Groups) | 109 (Unhealthy) | 89 (Unhealthy) | 68 (Unhealthy for Sensitive Groups) | 75 (Unhealthy for Sensitive Groups) |
| so2 | 4.4 (Good) | 5.5 (Good) | 4.1 (Good) | 4 (Good) | 5.1 (Good) | 8.1 (Good) | 8.6 (Good) | 9.3 (Good) | 7.8 (Good) | 5.5 (Good) | 5.5 (Good) | 6.9 (Good) | 9.7 (Good) | 12 (Good) | 11 (Good) | 7.3 (Good) | 9.4 (Good) | 9 (Good) | 12 (Good) | 13 (Good) |
PM2,5 61 (Unhealthy)
particulate matter (PM2.5) dustNO2 22 (Good)
nitrogen dioxide (NO2)PM10 69 (Unhealthy for Sensitive Groups)
particulate matter (PM10) suspended dustCO 219 (Good)
carbon monoxide (CO)O3 0.05 (Good)
ozone (O3)SO2 7.7 (Good)
sulfur dioxide (SO2)袍江站
| index | 2022-05-27 |
|---|---|
| pm25 | 28 |
| no2 | 22 |
| pm10 | 35 |
| co | 579 |
| o3 | 22 |
| so2 | 4.6 |
袍江站

| index | 2020-05 | 2020-04 | 2020-03 | 2020-02 | 2020-01 | 2019-12 | 2019-11 | 2019-10 | 2019-09 | 2019-08 | 2019-07 | 2019-06 | 2019-05 | 2019-04 | 2019-03 | 2019-02 | 2019-01 | 2018-12 | 2018-11 | 2018-10 |
|---|---|---|---|---|---|---|---|---|---|---|---|---|---|---|---|---|---|---|---|---|
| pm25 | 31 | 34 | 24 | 26 | 38 | 48 | 40 | 41 | 32 | 25 | 21 | 29 | 33 | 36 | 46 | 50 | 72 | 55 | 44 | 43 |
| co | 734 | 641 | 596 | 595 | 921 | 984 | 741 | 840 | 672 | 642 | 584 | 636 | 581 | 694 | 743 | 837 | 1 | 941 | 849 | 899 |
| no2 | 28 | 41 | 34 | 17 | 33 | 61 | 53 | 45 | 31 | 19 | 19 | 26 | 32 | 40 | 44 | 32 | 53 | 53 | 51 | 48 |
| o3 | 159 | 149 | 102 | 95 | 64 | 58 | 87 | 117 | 146 | 142 | 119 | 150 | 158 | 132 | 115 | 70 | 58 | 42 | 73 | 117 |
| pm10 | 51 | 67 | 44 | 40 | 54 | 83 | 82 | 77 | 54 | 41 | 35 | 43 | 61 | 63 | 78 | 68 | 109 | 89 | 68 | 75 |
| so2 | 4.4 | 5.5 | 4.1 | 4 | 5.1 | 8.1 | 8.6 | 9.3 | 7.8 | 5.5 | 5.5 | 6.9 | 9.7 | 12 | 11 | 7.3 | 9.4 | 9 | 12 | 13 |