Air Pollution in Danshancun: Real-time Air Quality Index and smog alert.
Pollution and air quality forecast for Danshancun. Today is Wednesday, June 10, 2026. The following air pollution values have been recorded for Danshancun:- particulate matter (PM2.5) dust - 61 (Unhealthy)
- nitrogen dioxide (NO2) - 22 (Good)
- particulate matter (PM10) suspended dust - 69 (Unhealthy for Sensitive Groups)
- carbon monoxide (CO) - 219 (Good)
- ozone (O3) - 0 (Good)
- sulfur dioxide (SO2) - 8 (Good)

What is the air quality in Danshancun today? Is the air polluted in Danshancun?. Is there smog?
What is the current level of PM2.5 in Danshancun? (particulate matter (PM2.5) dust)
Today's PM2.5 level is:
61 (Unhealthy)
For comparison, the highest level of PM2.5 in Danshancun in the last 7 days was: 28 (Friday, May 27, 2022) and the lowest: 28 (Friday, May 27, 2022).
The highest PM2.5 values were recorded: 64 (January 2019).
The lowest level of particulate matter PM2.5 pollution occurs in month: July (21).
How high is the level of NO2? (nitrogen dioxide (NO2))
22 (Good)
What is the level of PM10 today in Danshancun? (particulate matter (PM10) suspended dust)
The current level of particulate matter PM10 in Danshancun is:
69 (Unhealthy for Sensitive Groups)
The highest PM10 values usually occur in month: 88 (January 2019).
The lowest value of particulate matter PM10 pollution in Danshancun is usually recorded in: July (34).
How high is the CO level? (carbon monoxide (CO))
219 (Good)
How is the O3 level today in Danshancun? (ozone (O3))
0 (Good)
What is the level of SO2 pollution? (sulfur dioxide (SO2))
8 (Good)
Current data Friday, May 27, 2022, 3:00 PM
PM2,5 61 (Unhealthy)
NO2 22 (Good)
PM10 69 (Unhealthy for Sensitive Groups)
CO 219 (Good)
O3 0 (Good)
SO2 8 (Good)
Data on air pollution from recent days in Danshancun
index
2022-05-27
pm25
28
Moderate
no2
22
Good
pm10
35
Moderate
co
579
Good
o3
22
Good
so2
5
Good
data source »
Air pollution in Danshancun from October 2018 to May 2020
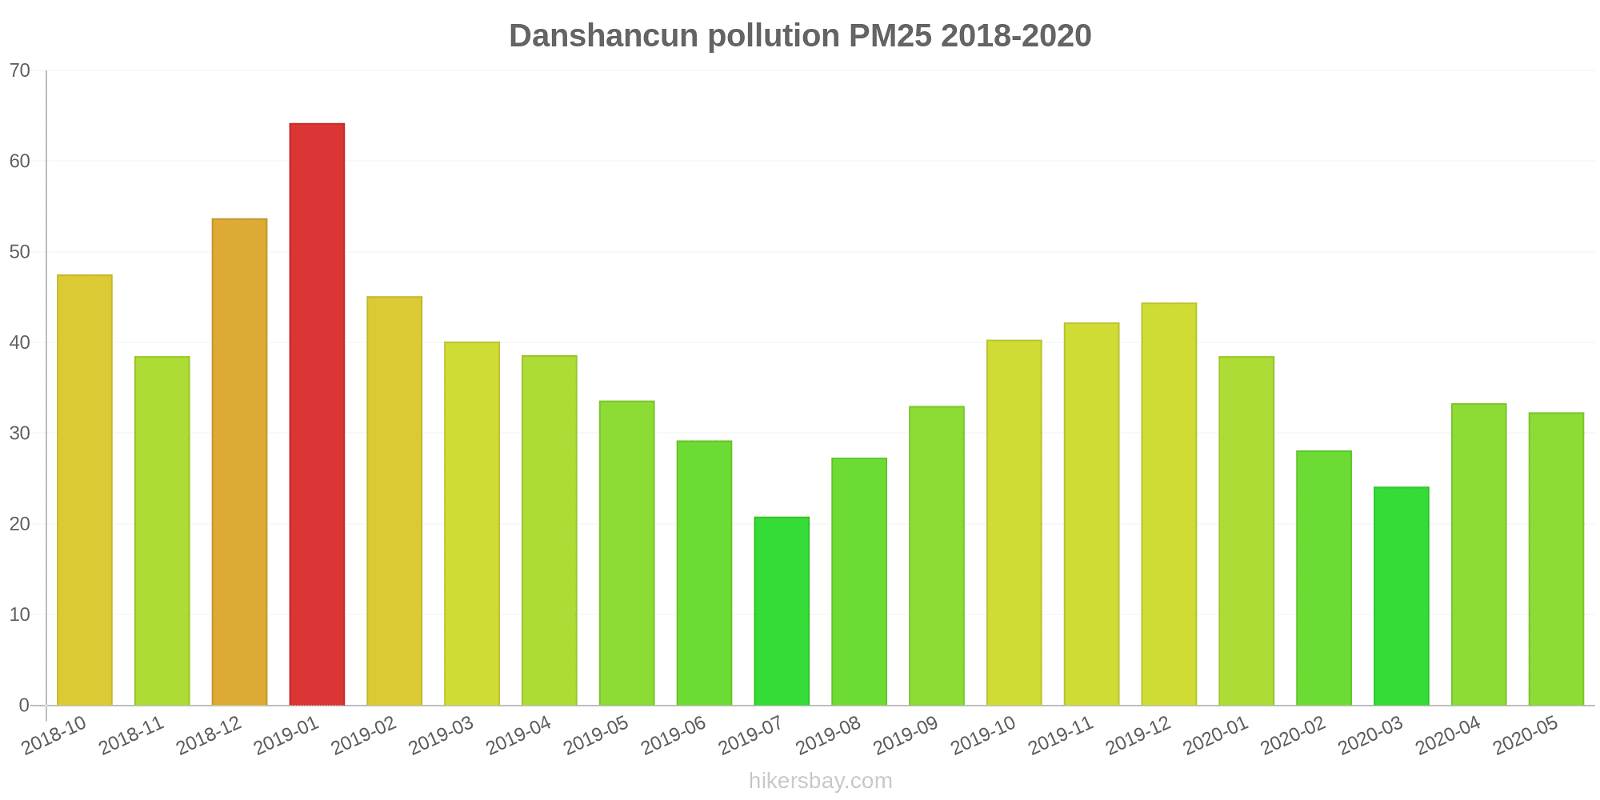
index
2020-05
2020-04
2020-03
2020-02
2020-01
2019-12
2019-11
2019-10
2019-09
2019-08
2019-07
2019-06
2019-05
2019-04
2019-03
2019-02
2019-01
2018-12
2018-11
2018-10
pm25
32 (Moderate)
33 (Moderate)
24 (Moderate)
28 (Moderate)
39 (Unhealthy for Sensitive Groups)
44 (Unhealthy for Sensitive Groups)
42 (Unhealthy for Sensitive Groups)
40 (Unhealthy for Sensitive Groups)
33 (Moderate)
27 (Moderate)
21 (Moderate)
29 (Moderate)
34 (Moderate)
39 (Unhealthy for Sensitive Groups)
40 (Unhealthy for Sensitive Groups)
45 (Unhealthy for Sensitive Groups)
64 (Unhealthy)
54 (Unhealthy for Sensitive Groups)
39 (Unhealthy for Sensitive Groups)
48 (Unhealthy for Sensitive Groups)
co
659 (Good)
628 (Good)
685 (Good)
651 (Good)
926 (Good)
994 (Good)
740 (Good)
789 (Good)
657 (Good)
538 (Good)
540 (Good)
621 (Good)
578 (Good)
657 (Good)
657 (Good)
861 (Good)
950 (Good)
999 (Good)
840 (Good)
940 (Good)
no2
21 (Good)
29 (Good)
26 (Good)
13 (Good)
31 (Good)
51 (Moderate)
37 (Good)
31 (Good)
20 (Good)
12 (Good)
10 (Good)
15 (Good)
21 (Good)
29 (Good)
34 (Good)
27 (Good)
43 (Moderate)
46 (Moderate)
39 (Good)
38 (Good)
o3
151 (Unhealthy)
155 (Unhealthy)
101 (Moderate)
95 (Moderate)
68 (Good)
59 (Good)
86 (Moderate)
113 (Moderate)
148 (Unhealthy for Sensitive Groups)
145 (Unhealthy for Sensitive Groups)
115 (Moderate)
142 (Unhealthy for Sensitive Groups)
157 (Unhealthy)
128 (Unhealthy for Sensitive Groups)
104 (Moderate)
69 (Good)
55 (Good)
40 (Good)
71 (Moderate)
114 (Moderate)
pm10
52 (Unhealthy for Sensitive Groups)
65 (Unhealthy for Sensitive Groups)
43 (Moderate)
40 (Moderate)
52 (Unhealthy for Sensitive Groups)
76 (Unhealthy for Sensitive Groups)
82 (Unhealthy)
72 (Unhealthy for Sensitive Groups)
51 (Unhealthy for Sensitive Groups)
44 (Moderate)
34 (Moderate)
44 (Moderate)
61 (Unhealthy for Sensitive Groups)
63 (Unhealthy for Sensitive Groups)
64 (Unhealthy for Sensitive Groups)
57 (Unhealthy for Sensitive Groups)
88 (Unhealthy)
87 (Unhealthy)
69 (Unhealthy for Sensitive Groups)
78 (Unhealthy for Sensitive Groups)
so2
3.9 (Good)
5.2 (Good)
3.8 (Good)
3 (Good)
3.5 (Good)
5.5 (Good)
5.2 (Good)
5.3 (Good)
4.7 (Good)
3.3 (Good)
4.5 (Good)
5.2 (Good)
7.5 (Good)
8.6 (Good)
8.4 (Good)
6.2 (Good)
8.8 (Good)
9.9 (Good)
7.8 (Good)
9.9 (Good)
data source »
树下王站
Friday, May 27, 2022, 3:00 PM
PM2,5 61 (Unhealthy)
particulate matter (PM2.5) dust
NO2 22 (Good)
nitrogen dioxide (NO2)
PM10 69 (Unhealthy for Sensitive Groups)
particulate matter (PM10) suspended dust
CO 219 (Good)
carbon monoxide (CO)
O3 0.05 (Good)
ozone (O3)
SO2 7.7 (Good)
sulfur dioxide (SO2)
树下王站
index
2022-05-27
pm25
28
no2
22
pm10
35
co
579
o3
22
so2
4.6
树下王站
2018-10 2020-05
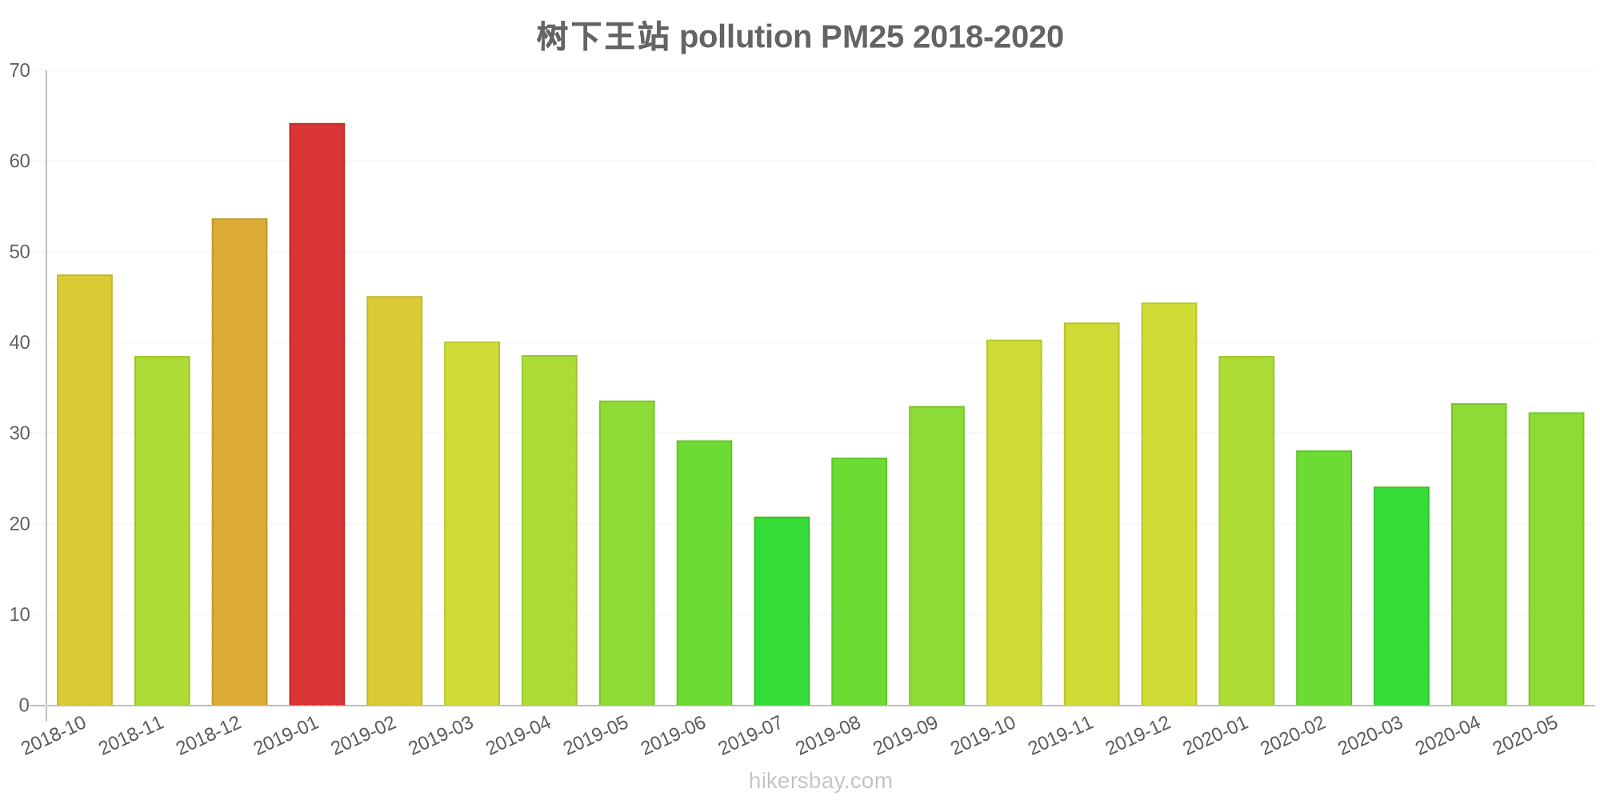
index
2020-05
2020-04
2020-03
2020-02
2020-01
2019-12
2019-11
2019-10
2019-09
2019-08
2019-07
2019-06
2019-05
2019-04
2019-03
2019-02
2019-01
2018-12
2018-11
2018-10
pm25
32
33
24
28
39
44
42
40
33
27
21
29
34
39
40
45
64
54
39
48
co
659
628
685
651
926
994
740
789
657
538
540
621
578
657
657
861
950
999
840
940
no2
21
29
26
13
31
51
37
31
20
12
10
15
21
29
34
27
43
46
39
38
o3
151
155
101
95
68
59
86
113
148
145
115
142
157
128
104
69
55
40
71
114
pm10
52
65
43
40
52
76
82
72
51
44
34
44
61
63
64
57
88
87
69
78
so2
3.9
5.2
3.8
3
3.5
5.5
5.2
5.3
4.7
3.3
4.5
5.2
7.5
8.6
8.4
6.2
8.8
9.9
7.8
9.9
* Pollution data source:
https://openaq.org
(ChinaAQIData)
The data is licensed under CC-By 4.0
PM2,5 61 (Unhealthy)
NO2 22 (Good)
PM10 69 (Unhealthy for Sensitive Groups)
CO 219 (Good)
O3 0 (Good)
SO2 8 (Good)
Data on air pollution from recent days in Danshancun
| index | 2022-05-27 |
|---|---|
| pm25 | 28 Moderate |
| no2 | 22 Good |
| pm10 | 35 Moderate |
| co | 579 Good |
| o3 | 22 Good |
| so2 | 5 Good |

| index | 2020-05 | 2020-04 | 2020-03 | 2020-02 | 2020-01 | 2019-12 | 2019-11 | 2019-10 | 2019-09 | 2019-08 | 2019-07 | 2019-06 | 2019-05 | 2019-04 | 2019-03 | 2019-02 | 2019-01 | 2018-12 | 2018-11 | 2018-10 |
|---|---|---|---|---|---|---|---|---|---|---|---|---|---|---|---|---|---|---|---|---|
| pm25 | 32 (Moderate) | 33 (Moderate) | 24 (Moderate) | 28 (Moderate) | 39 (Unhealthy for Sensitive Groups) | 44 (Unhealthy for Sensitive Groups) | 42 (Unhealthy for Sensitive Groups) | 40 (Unhealthy for Sensitive Groups) | 33 (Moderate) | 27 (Moderate) | 21 (Moderate) | 29 (Moderate) | 34 (Moderate) | 39 (Unhealthy for Sensitive Groups) | 40 (Unhealthy for Sensitive Groups) | 45 (Unhealthy for Sensitive Groups) | 64 (Unhealthy) | 54 (Unhealthy for Sensitive Groups) | 39 (Unhealthy for Sensitive Groups) | 48 (Unhealthy for Sensitive Groups) |
| co | 659 (Good) | 628 (Good) | 685 (Good) | 651 (Good) | 926 (Good) | 994 (Good) | 740 (Good) | 789 (Good) | 657 (Good) | 538 (Good) | 540 (Good) | 621 (Good) | 578 (Good) | 657 (Good) | 657 (Good) | 861 (Good) | 950 (Good) | 999 (Good) | 840 (Good) | 940 (Good) |
| no2 | 21 (Good) | 29 (Good) | 26 (Good) | 13 (Good) | 31 (Good) | 51 (Moderate) | 37 (Good) | 31 (Good) | 20 (Good) | 12 (Good) | 10 (Good) | 15 (Good) | 21 (Good) | 29 (Good) | 34 (Good) | 27 (Good) | 43 (Moderate) | 46 (Moderate) | 39 (Good) | 38 (Good) |
| o3 | 151 (Unhealthy) | 155 (Unhealthy) | 101 (Moderate) | 95 (Moderate) | 68 (Good) | 59 (Good) | 86 (Moderate) | 113 (Moderate) | 148 (Unhealthy for Sensitive Groups) | 145 (Unhealthy for Sensitive Groups) | 115 (Moderate) | 142 (Unhealthy for Sensitive Groups) | 157 (Unhealthy) | 128 (Unhealthy for Sensitive Groups) | 104 (Moderate) | 69 (Good) | 55 (Good) | 40 (Good) | 71 (Moderate) | 114 (Moderate) |
| pm10 | 52 (Unhealthy for Sensitive Groups) | 65 (Unhealthy for Sensitive Groups) | 43 (Moderate) | 40 (Moderate) | 52 (Unhealthy for Sensitive Groups) | 76 (Unhealthy for Sensitive Groups) | 82 (Unhealthy) | 72 (Unhealthy for Sensitive Groups) | 51 (Unhealthy for Sensitive Groups) | 44 (Moderate) | 34 (Moderate) | 44 (Moderate) | 61 (Unhealthy for Sensitive Groups) | 63 (Unhealthy for Sensitive Groups) | 64 (Unhealthy for Sensitive Groups) | 57 (Unhealthy for Sensitive Groups) | 88 (Unhealthy) | 87 (Unhealthy) | 69 (Unhealthy for Sensitive Groups) | 78 (Unhealthy for Sensitive Groups) |
| so2 | 3.9 (Good) | 5.2 (Good) | 3.8 (Good) | 3 (Good) | 3.5 (Good) | 5.5 (Good) | 5.2 (Good) | 5.3 (Good) | 4.7 (Good) | 3.3 (Good) | 4.5 (Good) | 5.2 (Good) | 7.5 (Good) | 8.6 (Good) | 8.4 (Good) | 6.2 (Good) | 8.8 (Good) | 9.9 (Good) | 7.8 (Good) | 9.9 (Good) |
PM2,5 61 (Unhealthy)
particulate matter (PM2.5) dustNO2 22 (Good)
nitrogen dioxide (NO2)PM10 69 (Unhealthy for Sensitive Groups)
particulate matter (PM10) suspended dustCO 219 (Good)
carbon monoxide (CO)O3 0.05 (Good)
ozone (O3)SO2 7.7 (Good)
sulfur dioxide (SO2)树下王站
| index | 2022-05-27 |
|---|---|
| pm25 | 28 |
| no2 | 22 |
| pm10 | 35 |
| co | 579 |
| o3 | 22 |
| so2 | 4.6 |
树下王站

| index | 2020-05 | 2020-04 | 2020-03 | 2020-02 | 2020-01 | 2019-12 | 2019-11 | 2019-10 | 2019-09 | 2019-08 | 2019-07 | 2019-06 | 2019-05 | 2019-04 | 2019-03 | 2019-02 | 2019-01 | 2018-12 | 2018-11 | 2018-10 |
|---|---|---|---|---|---|---|---|---|---|---|---|---|---|---|---|---|---|---|---|---|
| pm25 | 32 | 33 | 24 | 28 | 39 | 44 | 42 | 40 | 33 | 27 | 21 | 29 | 34 | 39 | 40 | 45 | 64 | 54 | 39 | 48 |
| co | 659 | 628 | 685 | 651 | 926 | 994 | 740 | 789 | 657 | 538 | 540 | 621 | 578 | 657 | 657 | 861 | 950 | 999 | 840 | 940 |
| no2 | 21 | 29 | 26 | 13 | 31 | 51 | 37 | 31 | 20 | 12 | 10 | 15 | 21 | 29 | 34 | 27 | 43 | 46 | 39 | 38 |
| o3 | 151 | 155 | 101 | 95 | 68 | 59 | 86 | 113 | 148 | 145 | 115 | 142 | 157 | 128 | 104 | 69 | 55 | 40 | 71 | 114 |
| pm10 | 52 | 65 | 43 | 40 | 52 | 76 | 82 | 72 | 51 | 44 | 34 | 44 | 61 | 63 | 64 | 57 | 88 | 87 | 69 | 78 |
| so2 | 3.9 | 5.2 | 3.8 | 3 | 3.5 | 5.5 | 5.2 | 5.3 | 4.7 | 3.3 | 4.5 | 5.2 | 7.5 | 8.6 | 8.4 | 6.2 | 8.8 | 9.9 | 7.8 | 9.9 |