Air Pollution in Hengtan: Real-time Air Quality Index and smog alert.
Pollution and air quality forecast for Hengtan. Today is Wednesday, June 10, 2026. The following air pollution values have been recorded for Hengtan:- particulate matter (PM2.5) dust - 61 (Unhealthy)
- nitrogen dioxide (NO2) - 22 (Good)
- particulate matter (PM10) suspended dust - 69 (Unhealthy for Sensitive Groups)
- carbon monoxide (CO) - 219 (Good)
- ozone (O3) - 0 (Good)
- sulfur dioxide (SO2) - 8 (Good)

What is the air quality in Hengtan today? Is the air polluted in Hengtan?. Is there smog?
What is the current level of PM2.5 in Hengtan? (particulate matter (PM2.5) dust)
Today's PM2.5 level is:
61 (Unhealthy)
For comparison, the highest level of PM2.5 in Hengtan in the last 7 days was: 28 (Friday, May 27, 2022) and the lowest: 28 (Friday, May 27, 2022).
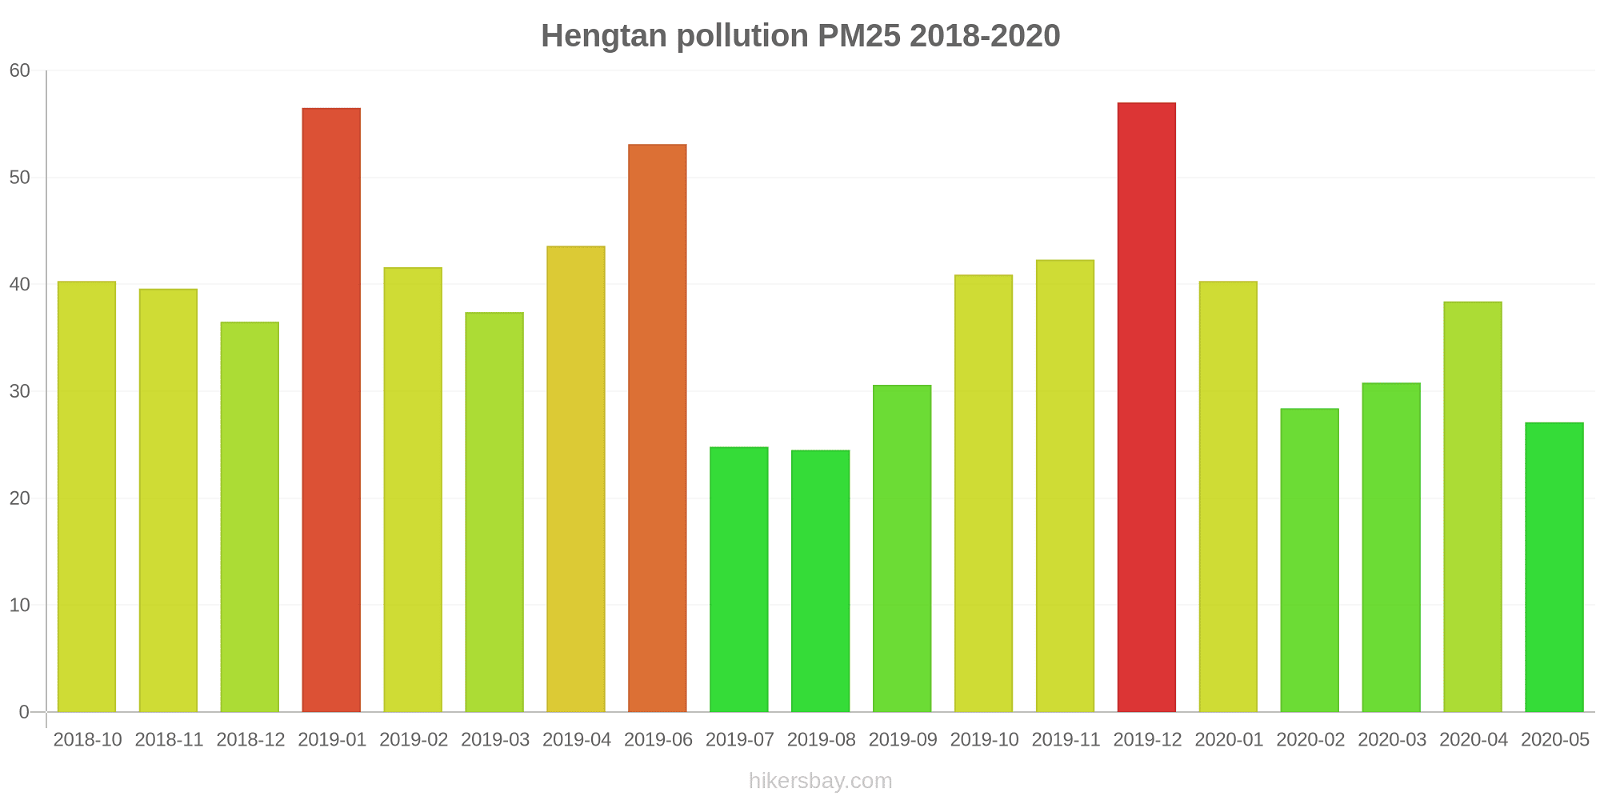
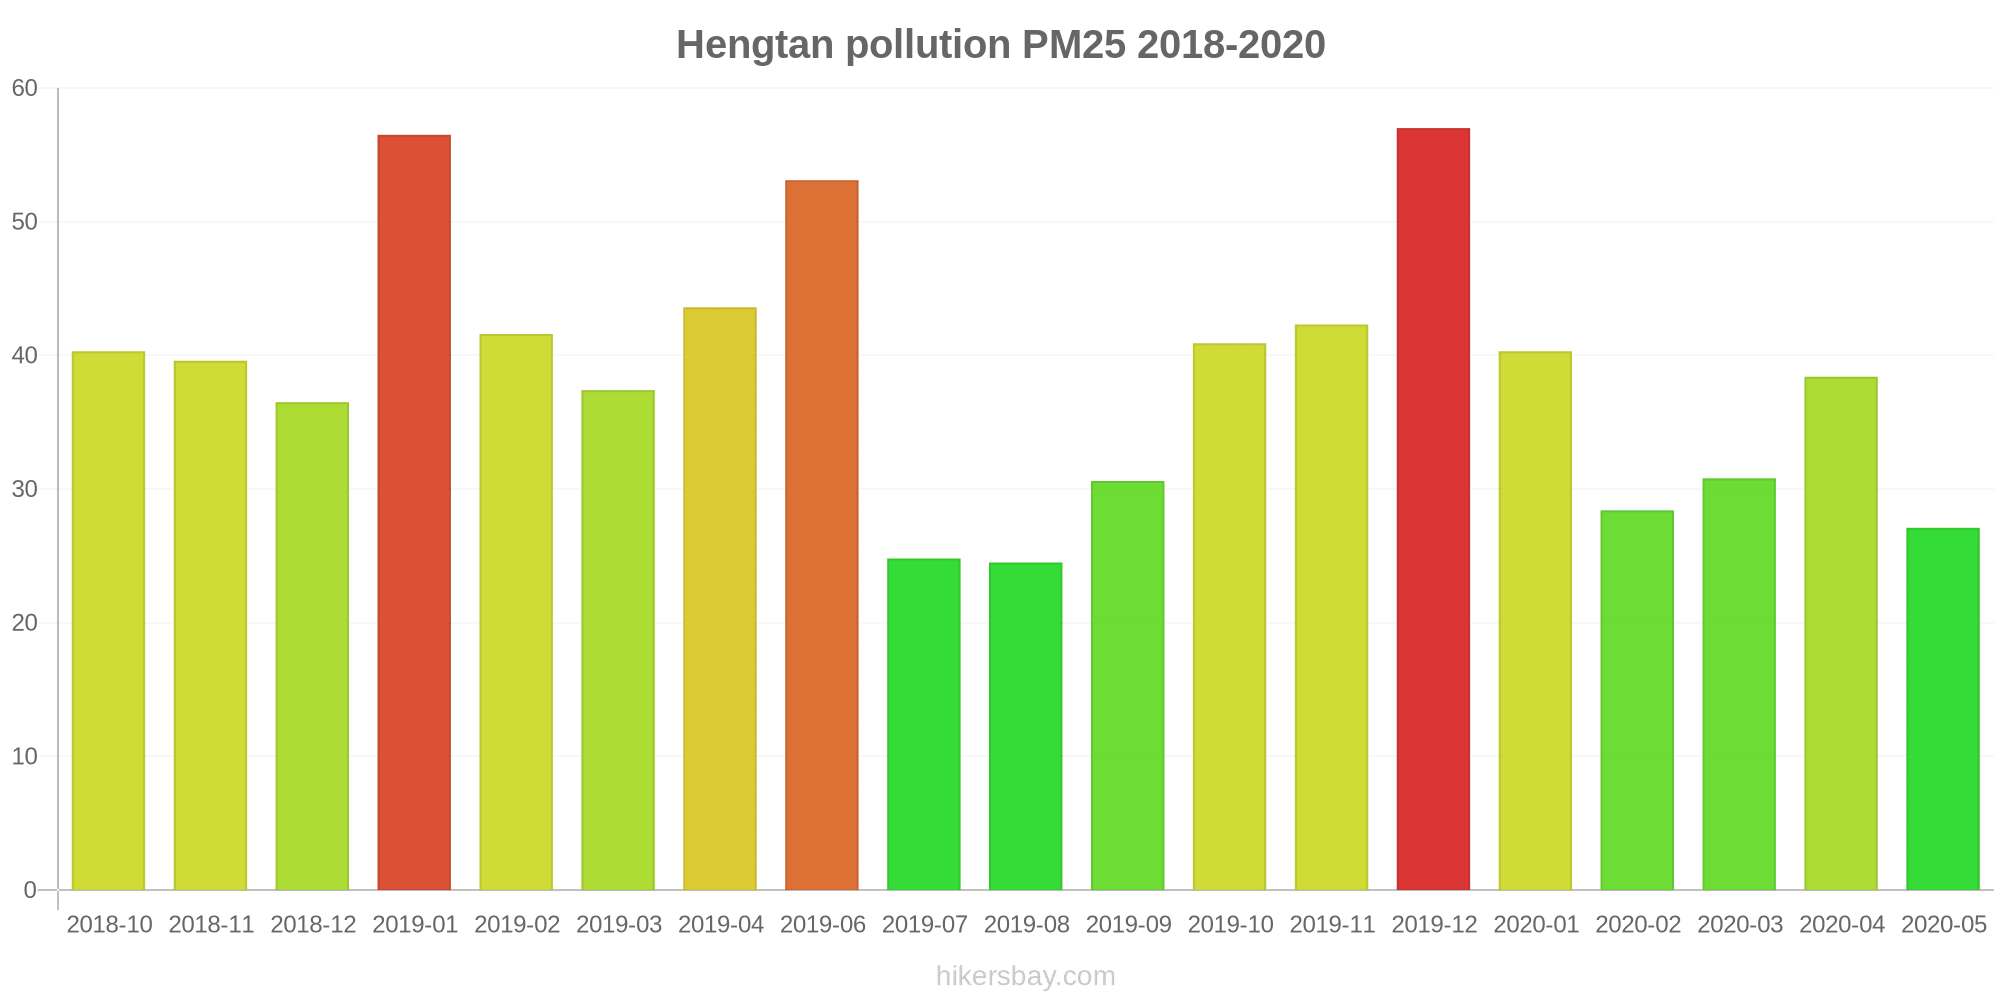
The highest PM2.5 values were recorded: 57 (December 2019).
The lowest level of particulate matter PM2.5 pollution occurs in month: August (25).
How high is the level of NO2? (nitrogen dioxide (NO2))
22 (Good)
What is the level of PM10 today in Hengtan? (particulate matter (PM10) suspended dust)
The current level of particulate matter PM10 in Hengtan is:
69 (Unhealthy for Sensitive Groups)
The highest PM10 values usually occur in month: 111 (January 2019).
The lowest value of particulate matter PM10 pollution in Hengtan is usually recorded in: February (41).
How high is the CO level? (carbon monoxide (CO))
219 (Good)
How is the O3 level today in Hengtan? (ozone (O3))
0 (Good)
What is the level of SO2 pollution? (sulfur dioxide (SO2))
8 (Good)
Current data Friday, May 27, 2022, 3:00 PM
PM2,5 61 (Unhealthy)
NO2 22 (Good)
PM10 69 (Unhealthy for Sensitive Groups)
CO 219 (Good)
O3 0 (Good)
SO2 8 (Good)
Data on air pollution from recent days in Hengtan
index
2022-05-27
pm25
28
Moderate
no2
22
Good
pm10
35
Moderate
co
579
Good
o3
22
Good
so2
5
Good
data source »
Air pollution in Hengtan from October 2018 to May 2020
index
2020-05
2020-04
2020-03
2020-02
2020-01
2019-12
2019-11
2019-10
2019-09
2019-08
2019-07
2019-06
2019-04
2019-03
2019-02
2019-01
2018-12
2018-11
2018-10
pm25
27 (Moderate)
38 (Unhealthy for Sensitive Groups)
31 (Moderate)
28 (Moderate)
40 (Unhealthy for Sensitive Groups)
57 (Unhealthy)
42 (Unhealthy for Sensitive Groups)
41 (Unhealthy for Sensitive Groups)
31 (Moderate)
25 (Moderate)
25 (Moderate)
53 (Unhealthy for Sensitive Groups)
44 (Unhealthy for Sensitive Groups)
37 (Unhealthy for Sensitive Groups)
42 (Unhealthy for Sensitive Groups)
57 (Unhealthy)
37 (Unhealthy for Sensitive Groups)
40 (Unhealthy for Sensitive Groups)
40 (Unhealthy for Sensitive Groups)
co
932 (Good)
779 (Good)
978 (Good)
1 (Good)
1 (Good)
1 (Good)
784 (Good)
887 (Good)
725 (Good)
611 (Good)
556 (Good)
918 (Good)
960 (Good)
917 (Good)
1 (Good)
1 (Good)
1 (Good)
820 (Good)
699 (Good)
no2
21 (Good)
31 (Good)
31 (Good)
14 (Good)
30 (Good)
45 (Moderate)
40 (Moderate)
31 (Good)
22 (Good)
21 (Good)
24 (Good)
34 (Good)
31 (Good)
32 (Good)
15 (Good)
19 (Good)
22 (Good)
38 (Good)
35 (Good)
o3
93 (Moderate)
76 (Moderate)
55 (Good)
53 (Good)
41 (Good)
40 (Good)
54 (Good)
67 (Good)
95 (Moderate)
76 (Moderate)
65 (Good)
135 (Unhealthy for Sensitive Groups)
121 (Unhealthy for Sensitive Groups)
89 (Moderate)
33 (Good)
32 (Good)
36 (Good)
69 (Good)
97 (Moderate)
pm10
58 (Unhealthy for Sensitive Groups)
81 (Unhealthy)
68 (Unhealthy for Sensitive Groups)
41 (Moderate)
57 (Unhealthy for Sensitive Groups)
81 (Unhealthy)
88 (Unhealthy)
92 (Unhealthy)
58 (Unhealthy for Sensitive Groups)
48 (Moderate)
47 (Moderate)
90 (Unhealthy)
82 (Unhealthy)
82 (Unhealthy)
66 (Unhealthy for Sensitive Groups)
111 (Very Unhealthy)
85 (Unhealthy)
77 (Unhealthy for Sensitive Groups)
83 (Unhealthy)
so2
7.1 (Good)
2.6 (Good)
2.2 (Good)
2.5 (Good)
2.6 (Good)
3.2 (Good)
2.5 (Good)
2.5 (Good)
3 (Good)
2.1 (Good)
2.4 (Good)
7.3 (Good)
8.8 (Good)
7.4 (Good)
3.2 (Good)
3 (Good)
3 (Good)
6.7 (Good)
5.2 (Good)
data source »
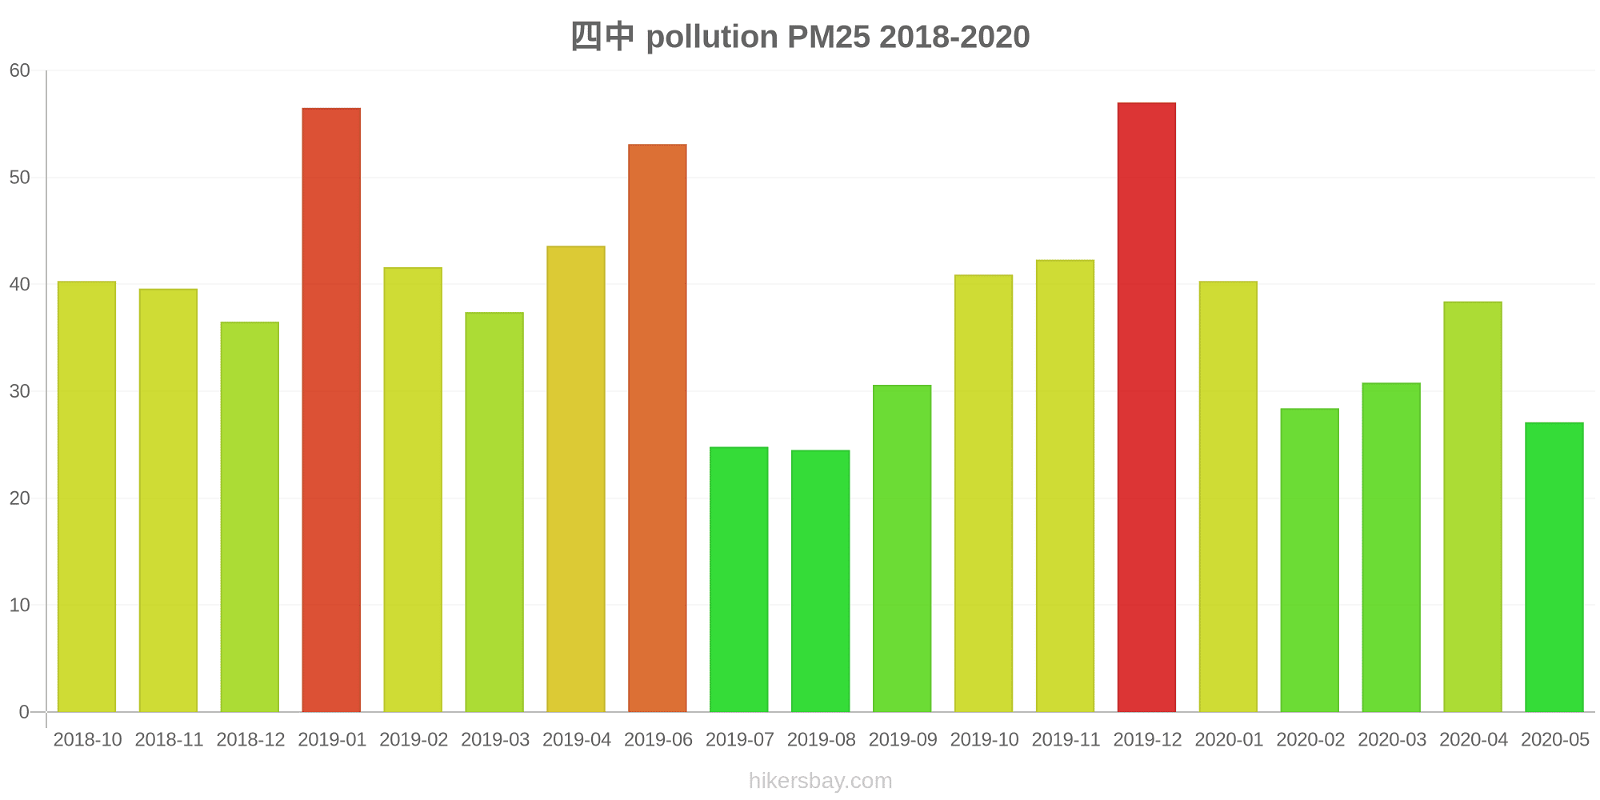
四中
Friday, May 27, 2022, 3:00 PM
PM2,5 61 (Unhealthy)
particulate matter (PM2.5) dust
NO2 22 (Good)
nitrogen dioxide (NO2)
PM10 69 (Unhealthy for Sensitive Groups)
particulate matter (PM10) suspended dust
CO 219 (Good)
carbon monoxide (CO)
O3 0.05 (Good)
ozone (O3)
SO2 7.7 (Good)
sulfur dioxide (SO2)
四中
index
2022-05-27
pm25
28
no2
22
pm10
35
co
579
o3
22
so2
4.6
四中
2018-10 2020-05
index
2020-05
2020-04
2020-03
2020-02
2020-01
2019-12
2019-11
2019-10
2019-09
2019-08
2019-07
2019-06
2019-04
2019-03
2019-02
2019-01
2018-12
2018-11
2018-10
pm25
27
38
31
28
40
57
42
41
31
25
25
53
44
37
42
57
37
40
40
co
932
779
978
1
1
1
784
887
725
611
556
918
960
917
1
1
1
820
699
no2
21
31
31
14
30
45
40
31
22
21
24
34
31
32
15
19
22
38
35
o3
93
76
55
53
41
40
54
67
95
76
65
135
121
89
33
32
36
69
97
pm10
58
81
68
41
57
81
88
92
58
48
47
90
82
82
66
111
85
77
83
so2
7.1
2.6
2.2
2.5
2.6
3.2
2.5
2.5
3
2.1
2.4
7.3
8.8
7.4
3.2
3
3
6.7
5.2
* Pollution data source:
https://openaq.org
(ChinaAQIData)
The data is licensed under CC-By 4.0
PM2,5 61 (Unhealthy)
NO2 22 (Good)
PM10 69 (Unhealthy for Sensitive Groups)
CO 219 (Good)
O3 0 (Good)
SO2 8 (Good)
Data on air pollution from recent days in Hengtan
| index | 2022-05-27 |
|---|---|
| pm25 | 28 Moderate |
| no2 | 22 Good |
| pm10 | 35 Moderate |
| co | 579 Good |
| o3 | 22 Good |
| so2 | 5 Good |
| index | 2020-05 | 2020-04 | 2020-03 | 2020-02 | 2020-01 | 2019-12 | 2019-11 | 2019-10 | 2019-09 | 2019-08 | 2019-07 | 2019-06 | 2019-04 | 2019-03 | 2019-02 | 2019-01 | 2018-12 | 2018-11 | 2018-10 |
|---|---|---|---|---|---|---|---|---|---|---|---|---|---|---|---|---|---|---|---|
| pm25 | 27 (Moderate) | 38 (Unhealthy for Sensitive Groups) | 31 (Moderate) | 28 (Moderate) | 40 (Unhealthy for Sensitive Groups) | 57 (Unhealthy) | 42 (Unhealthy for Sensitive Groups) | 41 (Unhealthy for Sensitive Groups) | 31 (Moderate) | 25 (Moderate) | 25 (Moderate) | 53 (Unhealthy for Sensitive Groups) | 44 (Unhealthy for Sensitive Groups) | 37 (Unhealthy for Sensitive Groups) | 42 (Unhealthy for Sensitive Groups) | 57 (Unhealthy) | 37 (Unhealthy for Sensitive Groups) | 40 (Unhealthy for Sensitive Groups) | 40 (Unhealthy for Sensitive Groups) |
| co | 932 (Good) | 779 (Good) | 978 (Good) | 1 (Good) | 1 (Good) | 1 (Good) | 784 (Good) | 887 (Good) | 725 (Good) | 611 (Good) | 556 (Good) | 918 (Good) | 960 (Good) | 917 (Good) | 1 (Good) | 1 (Good) | 1 (Good) | 820 (Good) | 699 (Good) |
| no2 | 21 (Good) | 31 (Good) | 31 (Good) | 14 (Good) | 30 (Good) | 45 (Moderate) | 40 (Moderate) | 31 (Good) | 22 (Good) | 21 (Good) | 24 (Good) | 34 (Good) | 31 (Good) | 32 (Good) | 15 (Good) | 19 (Good) | 22 (Good) | 38 (Good) | 35 (Good) |
| o3 | 93 (Moderate) | 76 (Moderate) | 55 (Good) | 53 (Good) | 41 (Good) | 40 (Good) | 54 (Good) | 67 (Good) | 95 (Moderate) | 76 (Moderate) | 65 (Good) | 135 (Unhealthy for Sensitive Groups) | 121 (Unhealthy for Sensitive Groups) | 89 (Moderate) | 33 (Good) | 32 (Good) | 36 (Good) | 69 (Good) | 97 (Moderate) |
| pm10 | 58 (Unhealthy for Sensitive Groups) | 81 (Unhealthy) | 68 (Unhealthy for Sensitive Groups) | 41 (Moderate) | 57 (Unhealthy for Sensitive Groups) | 81 (Unhealthy) | 88 (Unhealthy) | 92 (Unhealthy) | 58 (Unhealthy for Sensitive Groups) | 48 (Moderate) | 47 (Moderate) | 90 (Unhealthy) | 82 (Unhealthy) | 82 (Unhealthy) | 66 (Unhealthy for Sensitive Groups) | 111 (Very Unhealthy) | 85 (Unhealthy) | 77 (Unhealthy for Sensitive Groups) | 83 (Unhealthy) |
| so2 | 7.1 (Good) | 2.6 (Good) | 2.2 (Good) | 2.5 (Good) | 2.6 (Good) | 3.2 (Good) | 2.5 (Good) | 2.5 (Good) | 3 (Good) | 2.1 (Good) | 2.4 (Good) | 7.3 (Good) | 8.8 (Good) | 7.4 (Good) | 3.2 (Good) | 3 (Good) | 3 (Good) | 6.7 (Good) | 5.2 (Good) |
PM2,5 61 (Unhealthy)
particulate matter (PM2.5) dustNO2 22 (Good)
nitrogen dioxide (NO2)PM10 69 (Unhealthy for Sensitive Groups)
particulate matter (PM10) suspended dustCO 219 (Good)
carbon monoxide (CO)O3 0.05 (Good)
ozone (O3)SO2 7.7 (Good)
sulfur dioxide (SO2)四中
| index | 2022-05-27 |
|---|---|
| pm25 | 28 |
| no2 | 22 |
| pm10 | 35 |
| co | 579 |
| o3 | 22 |
| so2 | 4.6 |
四中

| index | 2020-05 | 2020-04 | 2020-03 | 2020-02 | 2020-01 | 2019-12 | 2019-11 | 2019-10 | 2019-09 | 2019-08 | 2019-07 | 2019-06 | 2019-04 | 2019-03 | 2019-02 | 2019-01 | 2018-12 | 2018-11 | 2018-10 |
|---|---|---|---|---|---|---|---|---|---|---|---|---|---|---|---|---|---|---|---|
| pm25 | 27 | 38 | 31 | 28 | 40 | 57 | 42 | 41 | 31 | 25 | 25 | 53 | 44 | 37 | 42 | 57 | 37 | 40 | 40 |
| co | 932 | 779 | 978 | 1 | 1 | 1 | 784 | 887 | 725 | 611 | 556 | 918 | 960 | 917 | 1 | 1 | 1 | 820 | 699 |
| no2 | 21 | 31 | 31 | 14 | 30 | 45 | 40 | 31 | 22 | 21 | 24 | 34 | 31 | 32 | 15 | 19 | 22 | 38 | 35 |
| o3 | 93 | 76 | 55 | 53 | 41 | 40 | 54 | 67 | 95 | 76 | 65 | 135 | 121 | 89 | 33 | 32 | 36 | 69 | 97 |
| pm10 | 58 | 81 | 68 | 41 | 57 | 81 | 88 | 92 | 58 | 48 | 47 | 90 | 82 | 82 | 66 | 111 | 85 | 77 | 83 |
| so2 | 7.1 | 2.6 | 2.2 | 2.5 | 2.6 | 3.2 | 2.5 | 2.5 | 3 | 2.1 | 2.4 | 7.3 | 8.8 | 7.4 | 3.2 | 3 | 3 | 6.7 | 5.2 |