Air Pollution in Zhumucun: Real-time Air Quality Index and smog alert.
Pollution and air quality forecast for Zhumucun. Today is Wednesday, June 10, 2026. The following air pollution values have been recorded for Zhumucun:- particulate matter (PM2.5) dust - 22 (Moderate)
- carbon monoxide (CO) - 219 (Good)
- ozone (O3) - 0 (Good)
- nitrogen dioxide (NO2) - 7 (Good)
- particulate matter (PM10) suspended dust - 36 (Moderate)
- sulfur dioxide (SO2) - 8 (Good)

What is the air quality in Zhumucun today? Is the air polluted in Zhumucun?. Is there smog?
What is the current level of PM2.5 in Zhumucun? (particulate matter (PM2.5) dust)
Today's PM2.5 level is:
22 (Moderate)
For comparison, the highest level of PM2.5 in Zhumucun in the last 7 days was: 23 (Friday, May 27, 2022) and the lowest: 23 (Friday, May 27, 2022).
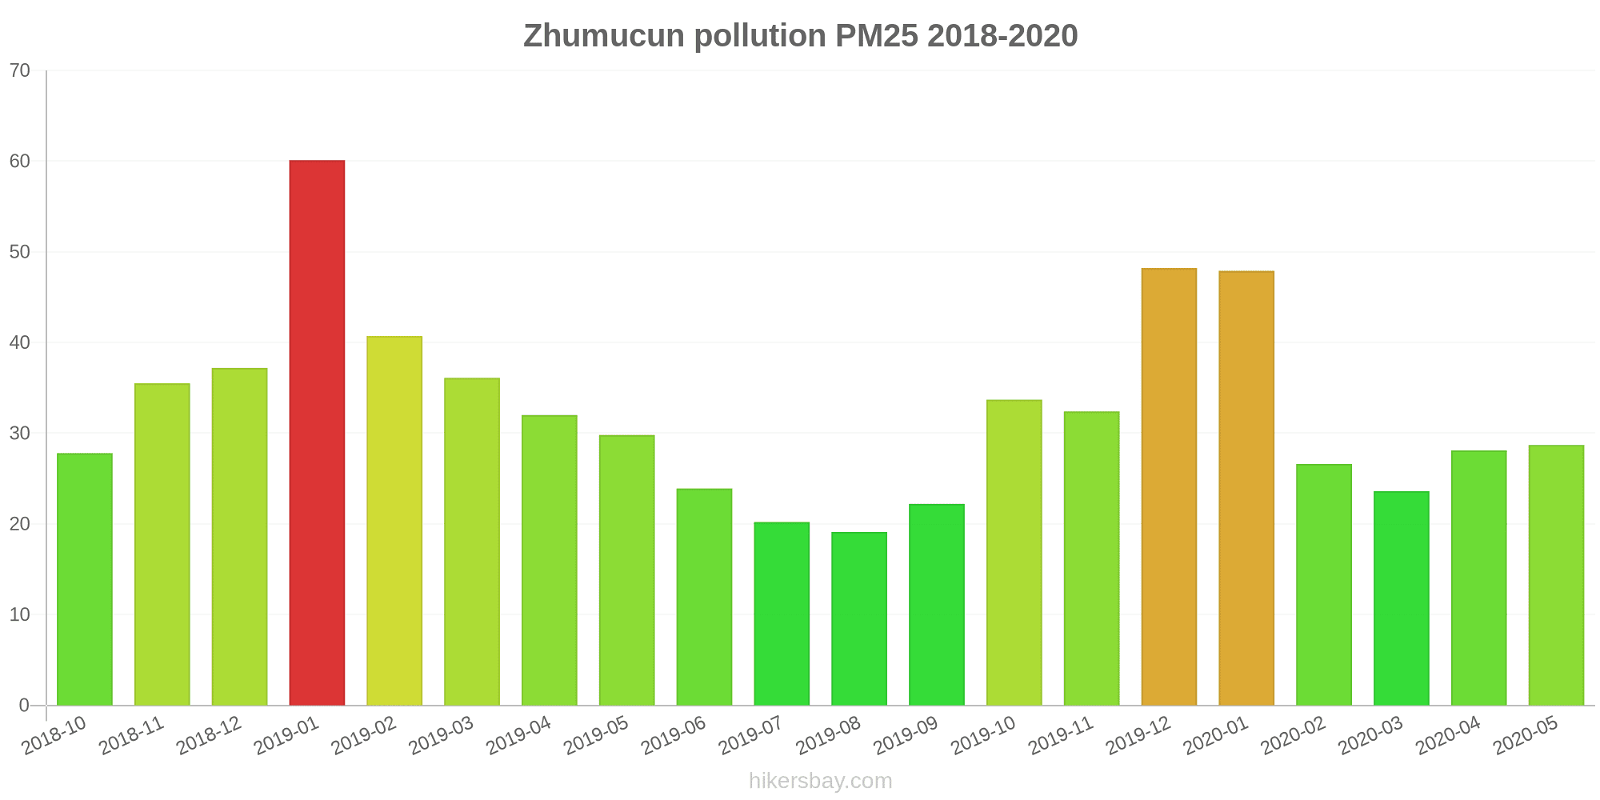
The highest PM2.5 values were recorded: 60 (January 2019).
The lowest level of particulate matter PM2.5 pollution occurs in month: August (19).
How high is the CO level? (carbon monoxide (CO))
219 (Good)
How is the O3 level today in Zhumucun? (ozone (O3))
0 (Good)
How high is the level of NO2? (nitrogen dioxide (NO2))
7 (Good)
What is the level of PM10 today in Zhumucun? (particulate matter (PM10) suspended dust)
The current level of particulate matter PM10 in Zhumucun is:
36 (Moderate)
The highest PM10 values usually occur in month: 88 (December 2019).
The lowest value of particulate matter PM10 pollution in Zhumucun is usually recorded in: August (36).
What is the level of SO2 pollution? (sulfur dioxide (SO2))
8 (Good)
Current data Friday, May 27, 2022, 3:00 PM
PM2,5 22 (Moderate)
CO 219 (Good)
O3 0 (Good)
NO2 7 (Good)
PM10 36 (Moderate)
SO2 8 (Good)
Data on air pollution from recent days in Zhumucun
index
2022-05-27
pm25
23
Moderate
co
475
Good
o3
25
Good
no2
21
Good
pm10
32
Moderate
so2
4
Good
data source »
Air pollution in Zhumucun from October 2018 to May 2020
index
2020-05
2020-04
2020-03
2020-02
2020-01
2019-12
2019-11
2019-10
2019-09
2019-08
2019-07
2019-06
2019-05
2019-04
2019-03
2019-02
2019-01
2018-12
2018-11
2018-10
pm25
29 (Moderate)
28 (Moderate)
24 (Moderate)
27 (Moderate)
48 (Unhealthy for Sensitive Groups)
48 (Unhealthy for Sensitive Groups)
32 (Moderate)
34 (Moderate)
22 (Moderate)
19 (Moderate)
20 (Moderate)
24 (Moderate)
30 (Moderate)
32 (Moderate)
36 (Unhealthy for Sensitive Groups)
41 (Unhealthy for Sensitive Groups)
60 (Unhealthy)
37 (Unhealthy for Sensitive Groups)
36 (Unhealthy for Sensitive Groups)
28 (Moderate)
co
724 (Good)
634 (Good)
621 (Good)
641 (Good)
958 (Good)
953 (Good)
858 (Good)
902 (Good)
750 (Good)
569 (Good)
530 (Good)
599 (Good)
600 (Good)
693 (Good)
725 (Good)
935 (Good)
1 (Good)
1 (Good)
671 (Good)
965 (Good)
no2
28 (Good)
35 (Good)
31 (Good)
17 (Good)
33 (Good)
56 (Moderate)
47 (Moderate)
41 (Moderate)
25 (Good)
18 (Good)
20 (Good)
21 (Good)
29 (Good)
33 (Good)
39 (Good)
27 (Good)
50 (Moderate)
44 (Moderate)
40 (Good)
34 (Good)
o3
155 (Unhealthy)
155 (Unhealthy)
104 (Moderate)
99 (Moderate)
70 (Good)
67 (Good)
103 (Moderate)
131 (Unhealthy for Sensitive Groups)
172 (Unhealthy)
159 (Unhealthy)
160 (Unhealthy)
181 (Very Unhealthy)
177 (Unhealthy)
143 (Unhealthy for Sensitive Groups)
127 (Unhealthy for Sensitive Groups)
83 (Moderate)
66 (Good)
57 (Good)
93 (Moderate)
141 (Unhealthy for Sensitive Groups)
pm10
62 (Unhealthy for Sensitive Groups)
74 (Unhealthy for Sensitive Groups)
54 (Unhealthy for Sensitive Groups)
48 (Moderate)
75 (Unhealthy for Sensitive Groups)
88 (Unhealthy)
80 (Unhealthy)
71 (Unhealthy for Sensitive Groups)
43 (Moderate)
36 (Moderate)
38 (Moderate)
42 (Moderate)
63 (Unhealthy for Sensitive Groups)
58 (Unhealthy for Sensitive Groups)
64 (Unhealthy for Sensitive Groups)
54 (Unhealthy for Sensitive Groups)
76 (Unhealthy for Sensitive Groups)
61 (Unhealthy for Sensitive Groups)
55 (Unhealthy for Sensitive Groups)
59 (Unhealthy for Sensitive Groups)
so2
5.2 (Good)
7.2 (Good)
5.5 (Good)
3.8 (Good)
5.2 (Good)
9 (Good)
9.4 (Good)
8.6 (Good)
6 (Good)
5.7 (Good)
4.9 (Good)
8.1 (Good)
10 (Good)
11 (Good)
13 (Good)
7 (Good)
12 (Good)
11 (Good)
12 (Good)
14 (Good)
data source »
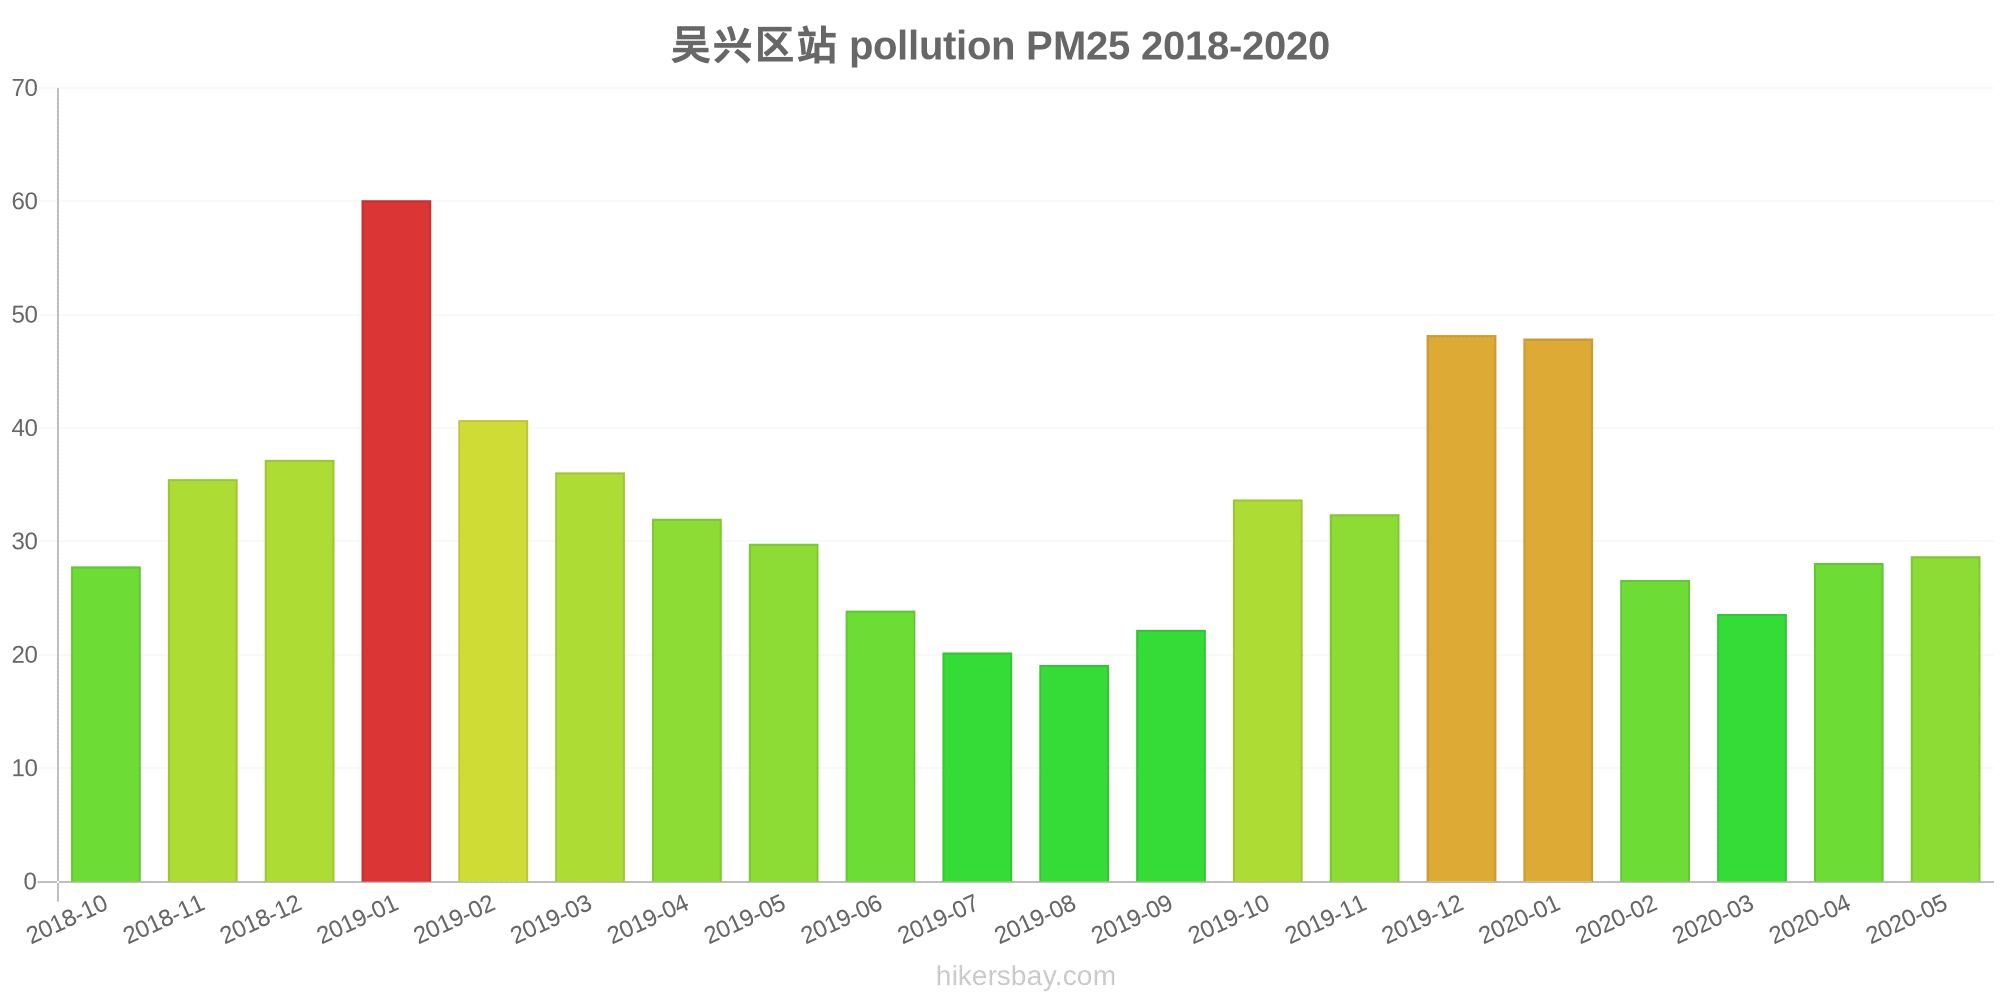
吴兴区站
Friday, May 27, 2022, 3:00 PM
PM2,5 22 (Moderate)
particulate matter (PM2.5) dust
CO 219 (Good)
carbon monoxide (CO)
O3 0.05 (Good)
ozone (O3)
NO2 7 (Good)
nitrogen dioxide (NO2)
PM10 36 (Moderate)
particulate matter (PM10) suspended dust
SO2 7.7 (Good)
sulfur dioxide (SO2)
吴兴区站
index
2022-05-27
pm25
23
co
475
o3
25
no2
21
pm10
32
so2
4.4
吴兴区站
2018-10 2020-05

index
2020-05
2020-04
2020-03
2020-02
2020-01
2019-12
2019-11
2019-10
2019-09
2019-08
2019-07
2019-06
2019-05
2019-04
2019-03
2019-02
2019-01
2018-12
2018-11
2018-10
pm25
29
28
24
27
48
48
32
34
22
19
20
24
30
32
36
41
60
37
36
28
co
724
634
621
641
958
953
858
902
750
569
530
599
600
693
725
935
1
1
671
965
no2
28
35
31
17
33
56
47
41
25
18
20
21
29
33
39
27
50
44
40
34
o3
155
155
104
99
70
67
103
131
172
159
160
181
177
143
127
83
66
57
93
141
pm10
62
74
54
48
75
88
80
71
43
36
38
42
63
58
64
54
76
61
55
59
so2
5.2
7.2
5.5
3.8
5.2
9
9.4
8.6
6
5.7
4.9
8.1
10
11
13
7
12
11
12
14
* Pollution data source:
https://openaq.org
(ChinaAQIData)
The data is licensed under CC-By 4.0
PM2,5 22 (Moderate)
CO 219 (Good)
O3 0 (Good)
NO2 7 (Good)
PM10 36 (Moderate)
SO2 8 (Good)
Data on air pollution from recent days in Zhumucun
| index | 2022-05-27 |
|---|---|
| pm25 | 23 Moderate |
| co | 475 Good |
| o3 | 25 Good |
| no2 | 21 Good |
| pm10 | 32 Moderate |
| so2 | 4 Good |

| index | 2020-05 | 2020-04 | 2020-03 | 2020-02 | 2020-01 | 2019-12 | 2019-11 | 2019-10 | 2019-09 | 2019-08 | 2019-07 | 2019-06 | 2019-05 | 2019-04 | 2019-03 | 2019-02 | 2019-01 | 2018-12 | 2018-11 | 2018-10 |
|---|---|---|---|---|---|---|---|---|---|---|---|---|---|---|---|---|---|---|---|---|
| pm25 | 29 (Moderate) | 28 (Moderate) | 24 (Moderate) | 27 (Moderate) | 48 (Unhealthy for Sensitive Groups) | 48 (Unhealthy for Sensitive Groups) | 32 (Moderate) | 34 (Moderate) | 22 (Moderate) | 19 (Moderate) | 20 (Moderate) | 24 (Moderate) | 30 (Moderate) | 32 (Moderate) | 36 (Unhealthy for Sensitive Groups) | 41 (Unhealthy for Sensitive Groups) | 60 (Unhealthy) | 37 (Unhealthy for Sensitive Groups) | 36 (Unhealthy for Sensitive Groups) | 28 (Moderate) |
| co | 724 (Good) | 634 (Good) | 621 (Good) | 641 (Good) | 958 (Good) | 953 (Good) | 858 (Good) | 902 (Good) | 750 (Good) | 569 (Good) | 530 (Good) | 599 (Good) | 600 (Good) | 693 (Good) | 725 (Good) | 935 (Good) | 1 (Good) | 1 (Good) | 671 (Good) | 965 (Good) |
| no2 | 28 (Good) | 35 (Good) | 31 (Good) | 17 (Good) | 33 (Good) | 56 (Moderate) | 47 (Moderate) | 41 (Moderate) | 25 (Good) | 18 (Good) | 20 (Good) | 21 (Good) | 29 (Good) | 33 (Good) | 39 (Good) | 27 (Good) | 50 (Moderate) | 44 (Moderate) | 40 (Good) | 34 (Good) |
| o3 | 155 (Unhealthy) | 155 (Unhealthy) | 104 (Moderate) | 99 (Moderate) | 70 (Good) | 67 (Good) | 103 (Moderate) | 131 (Unhealthy for Sensitive Groups) | 172 (Unhealthy) | 159 (Unhealthy) | 160 (Unhealthy) | 181 (Very Unhealthy) | 177 (Unhealthy) | 143 (Unhealthy for Sensitive Groups) | 127 (Unhealthy for Sensitive Groups) | 83 (Moderate) | 66 (Good) | 57 (Good) | 93 (Moderate) | 141 (Unhealthy for Sensitive Groups) |
| pm10 | 62 (Unhealthy for Sensitive Groups) | 74 (Unhealthy for Sensitive Groups) | 54 (Unhealthy for Sensitive Groups) | 48 (Moderate) | 75 (Unhealthy for Sensitive Groups) | 88 (Unhealthy) | 80 (Unhealthy) | 71 (Unhealthy for Sensitive Groups) | 43 (Moderate) | 36 (Moderate) | 38 (Moderate) | 42 (Moderate) | 63 (Unhealthy for Sensitive Groups) | 58 (Unhealthy for Sensitive Groups) | 64 (Unhealthy for Sensitive Groups) | 54 (Unhealthy for Sensitive Groups) | 76 (Unhealthy for Sensitive Groups) | 61 (Unhealthy for Sensitive Groups) | 55 (Unhealthy for Sensitive Groups) | 59 (Unhealthy for Sensitive Groups) |
| so2 | 5.2 (Good) | 7.2 (Good) | 5.5 (Good) | 3.8 (Good) | 5.2 (Good) | 9 (Good) | 9.4 (Good) | 8.6 (Good) | 6 (Good) | 5.7 (Good) | 4.9 (Good) | 8.1 (Good) | 10 (Good) | 11 (Good) | 13 (Good) | 7 (Good) | 12 (Good) | 11 (Good) | 12 (Good) | 14 (Good) |
PM2,5 22 (Moderate)
particulate matter (PM2.5) dustCO 219 (Good)
carbon monoxide (CO)O3 0.05 (Good)
ozone (O3)NO2 7 (Good)
nitrogen dioxide (NO2)PM10 36 (Moderate)
particulate matter (PM10) suspended dustSO2 7.7 (Good)
sulfur dioxide (SO2)吴兴区站
| index | 2022-05-27 |
|---|---|
| pm25 | 23 |
| co | 475 |
| o3 | 25 |
| no2 | 21 |
| pm10 | 32 |
| so2 | 4.4 |
吴兴区站
| index | 2020-05 | 2020-04 | 2020-03 | 2020-02 | 2020-01 | 2019-12 | 2019-11 | 2019-10 | 2019-09 | 2019-08 | 2019-07 | 2019-06 | 2019-05 | 2019-04 | 2019-03 | 2019-02 | 2019-01 | 2018-12 | 2018-11 | 2018-10 |
|---|---|---|---|---|---|---|---|---|---|---|---|---|---|---|---|---|---|---|---|---|
| pm25 | 29 | 28 | 24 | 27 | 48 | 48 | 32 | 34 | 22 | 19 | 20 | 24 | 30 | 32 | 36 | 41 | 60 | 37 | 36 | 28 |
| co | 724 | 634 | 621 | 641 | 958 | 953 | 858 | 902 | 750 | 569 | 530 | 599 | 600 | 693 | 725 | 935 | 1 | 1 | 671 | 965 |
| no2 | 28 | 35 | 31 | 17 | 33 | 56 | 47 | 41 | 25 | 18 | 20 | 21 | 29 | 33 | 39 | 27 | 50 | 44 | 40 | 34 |
| o3 | 155 | 155 | 104 | 99 | 70 | 67 | 103 | 131 | 172 | 159 | 160 | 181 | 177 | 143 | 127 | 83 | 66 | 57 | 93 | 141 |
| pm10 | 62 | 74 | 54 | 48 | 75 | 88 | 80 | 71 | 43 | 36 | 38 | 42 | 63 | 58 | 64 | 54 | 76 | 61 | 55 | 59 |
| so2 | 5.2 | 7.2 | 5.5 | 3.8 | 5.2 | 9 | 9.4 | 8.6 | 6 | 5.7 | 4.9 | 8.1 | 10 | 11 | 13 | 7 | 12 | 11 | 12 | 14 |