Air Pollution in Zhenrucun: Real-time Air Quality Index and smog alert.
Pollution and air quality forecast for Zhenrucun. Today is Wednesday, June 10, 2026. The following air pollution values have been recorded for Zhenrucun:- particulate matter (PM2.5) dust - 61 (Unhealthy)
- nitrogen dioxide (NO2) - 22 (Good)
- particulate matter (PM10) suspended dust - 69 (Unhealthy for Sensitive Groups)
- carbon monoxide (CO) - 219 (Good)
- ozone (O3) - 0 (Good)
- sulfur dioxide (SO2) - 8 (Good)

What is the air quality in Zhenrucun today? Is the air polluted in Zhenrucun?. Is there smog?
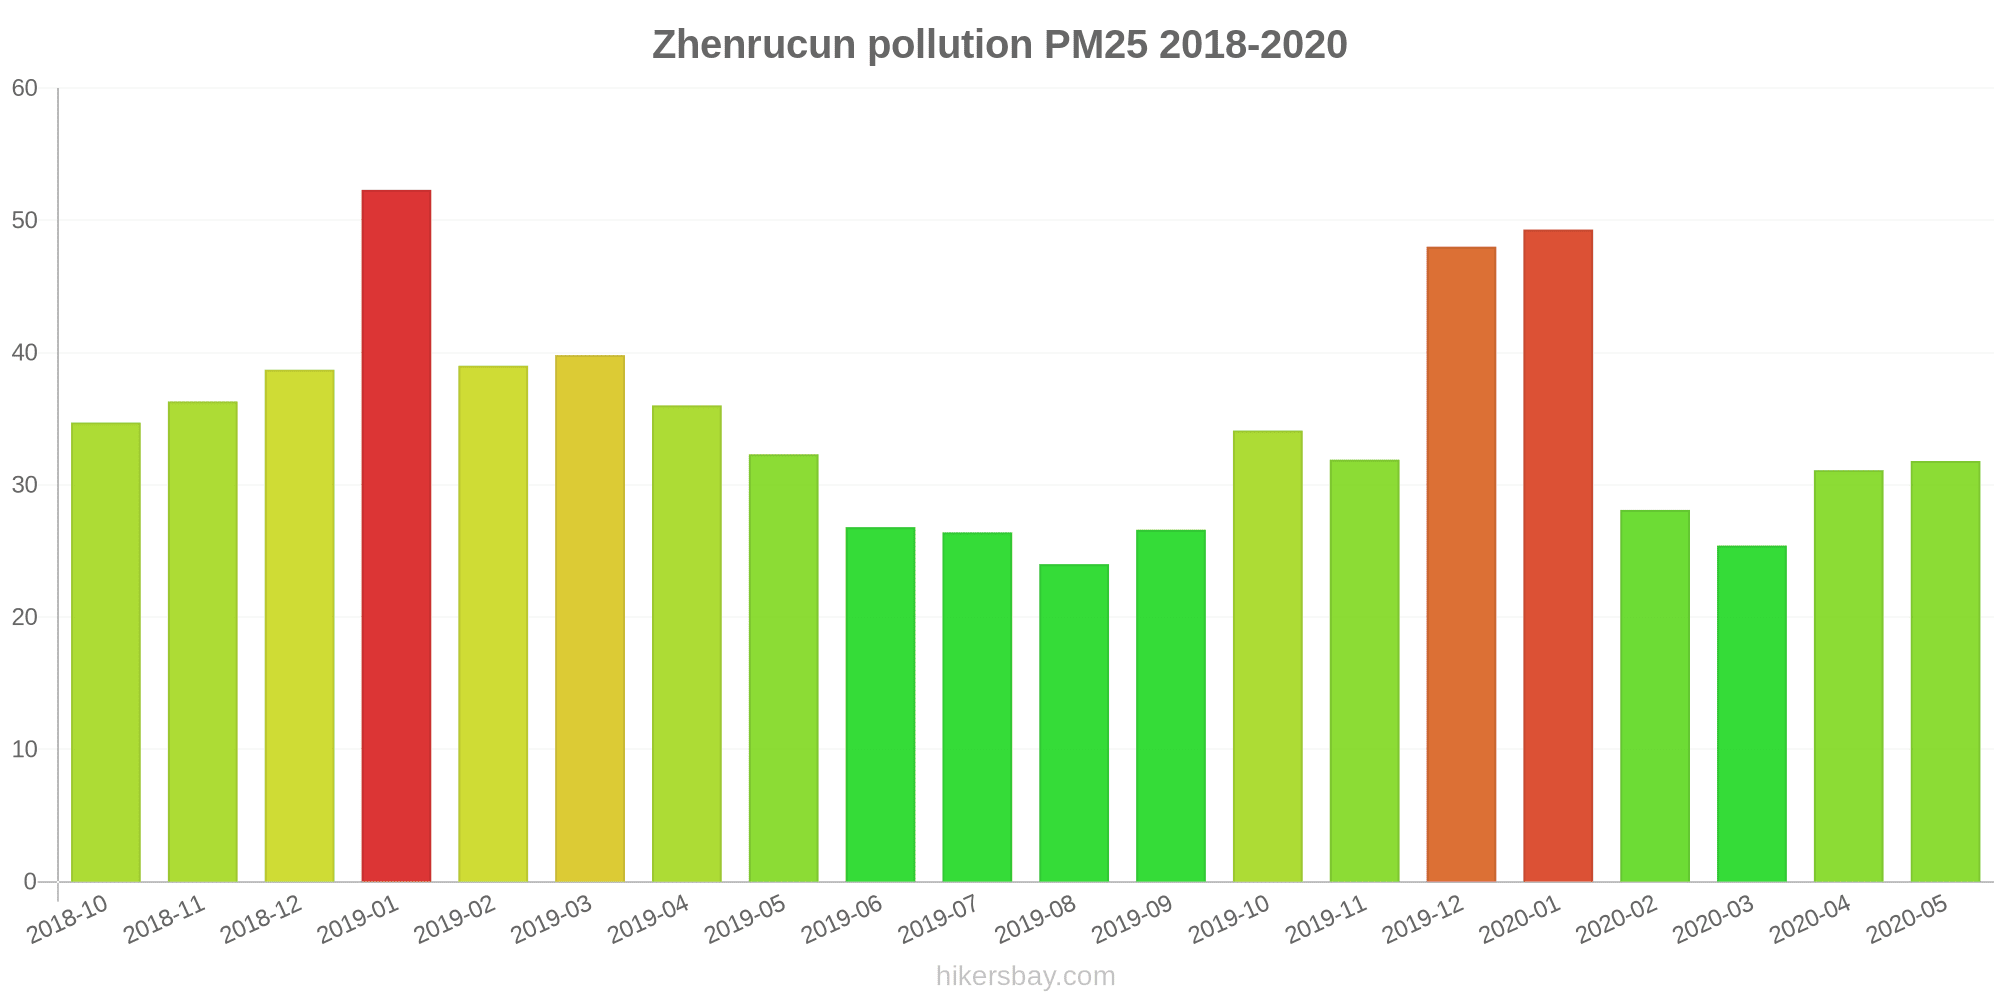
What is the current level of PM2.5 in Zhenrucun? (particulate matter (PM2.5) dust)
Today's PM2.5 level is:
61 (Unhealthy)
For comparison, the highest level of PM2.5 in Zhenrucun in the last 7 days was: 28 (Friday, May 27, 2022) and the lowest: 28 (Friday, May 27, 2022).
The highest PM2.5 values were recorded: 52 (January 2019).
The lowest level of particulate matter PM2.5 pollution occurs in month: August (24).
How high is the level of NO2? (nitrogen dioxide (NO2))
22 (Good)
What is the level of PM10 today in Zhenrucun? (particulate matter (PM10) suspended dust)
The current level of particulate matter PM10 in Zhenrucun is:
69 (Unhealthy for Sensitive Groups)
The highest PM10 values usually occur in month: 87 (January 2019).
The lowest value of particulate matter PM10 pollution in Zhenrucun is usually recorded in: July (33).
How high is the CO level? (carbon monoxide (CO))
219 (Good)
How is the O3 level today in Zhenrucun? (ozone (O3))
0 (Good)
What is the level of SO2 pollution? (sulfur dioxide (SO2))
8 (Good)
Current data Friday, May 27, 2022, 3:00 PM
PM2,5 61 (Unhealthy)
NO2 22 (Good)
PM10 69 (Unhealthy for Sensitive Groups)
CO 219 (Good)
O3 0 (Good)
SO2 8 (Good)
Data on air pollution from recent days in Zhenrucun
index
2022-05-27
pm25
28
Moderate
no2
22
Good
pm10
35
Moderate
co
579
Good
o3
22
Good
so2
5
Good
data source »
Air pollution in Zhenrucun from October 2018 to May 2020

index
2020-05
2020-04
2020-03
2020-02
2020-01
2019-12
2019-11
2019-10
2019-09
2019-08
2019-07
2019-06
2019-05
2019-04
2019-03
2019-02
2019-01
2018-12
2018-11
2018-10
pm25
32 (Moderate)
31 (Moderate)
25 (Moderate)
28 (Moderate)
49 (Unhealthy for Sensitive Groups)
48 (Unhealthy for Sensitive Groups)
32 (Moderate)
34 (Moderate)
27 (Moderate)
24 (Moderate)
26 (Moderate)
27 (Moderate)
32 (Moderate)
36 (Unhealthy for Sensitive Groups)
40 (Unhealthy for Sensitive Groups)
39 (Unhealthy for Sensitive Groups)
52 (Unhealthy for Sensitive Groups)
39 (Unhealthy for Sensitive Groups)
36 (Unhealthy for Sensitive Groups)
35 (Moderate)
co
730 (Good)
637 (Good)
635 (Good)
586 (Good)
908 (Good)
802 (Good)
608 (Good)
760 (Good)
711 (Good)
632 (Good)
514 (Good)
537 (Good)
616 (Good)
619 (Good)
754 (Good)
693 (Good)
896 (Good)
792 (Good)
798 (Good)
701 (Good)
no2
26 (Good)
33 (Good)
31 (Good)
18 (Good)
35 (Good)
57 (Moderate)
41 (Moderate)
32 (Good)
27 (Good)
18 (Good)
23 (Good)
21 (Good)
26 (Good)
31 (Good)
35 (Good)
27 (Good)
51 (Moderate)
47 (Moderate)
45 (Moderate)
44 (Moderate)
o3
135 (Unhealthy for Sensitive Groups)
149 (Unhealthy for Sensitive Groups)
104 (Moderate)
101 (Moderate)
71 (Moderate)
62 (Good)
88 (Moderate)
108 (Moderate)
141 (Unhealthy for Sensitive Groups)
127 (Unhealthy for Sensitive Groups)
132 (Unhealthy for Sensitive Groups)
148 (Unhealthy for Sensitive Groups)
141 (Unhealthy for Sensitive Groups)
113 (Moderate)
106 (Moderate)
75 (Moderate)
60 (Good)
51 (Good)
75 (Moderate)
111 (Moderate)
pm10
49 (Moderate)
58 (Unhealthy for Sensitive Groups)
42 (Moderate)
38 (Moderate)
57 (Unhealthy for Sensitive Groups)
74 (Unhealthy for Sensitive Groups)
65 (Unhealthy for Sensitive Groups)
61 (Unhealthy for Sensitive Groups)
39 (Moderate)
34 (Moderate)
33 (Moderate)
37 (Moderate)
56 (Unhealthy for Sensitive Groups)
55 (Unhealthy for Sensitive Groups)
66 (Unhealthy for Sensitive Groups)
59 (Unhealthy for Sensitive Groups)
87 (Unhealthy)
65 (Unhealthy for Sensitive Groups)
56 (Unhealthy for Sensitive Groups)
63 (Unhealthy for Sensitive Groups)
so2
5.6 (Good)
8.8 (Good)
7.3 (Good)
6.9 (Good)
9.3 (Good)
11 (Good)
8.9 (Good)
7.4 (Good)
5.3 (Good)
2.4 (Good)
2.6 (Good)
4 (Good)
7.7 (Good)
7.6 (Good)
8.9 (Good)
5.7 (Good)
7.9 (Good)
7 (Good)
6.9 (Good)
8.1 (Good)
data source »
嘉兴学院
Friday, May 27, 2022, 3:00 PM
PM2,5 61 (Unhealthy)
particulate matter (PM2.5) dust
NO2 22 (Good)
nitrogen dioxide (NO2)
PM10 69 (Unhealthy for Sensitive Groups)
particulate matter (PM10) suspended dust
CO 219 (Good)
carbon monoxide (CO)
O3 0.05 (Good)
ozone (O3)
SO2 7.7 (Good)
sulfur dioxide (SO2)
嘉兴学院
index
2022-05-27
pm25
28
no2
22
pm10
35
co
579
o3
22
so2
4.6
嘉兴学院
2018-10 2020-05

index
2020-05
2020-04
2020-03
2020-02
2020-01
2019-12
2019-11
2019-10
2019-09
2019-08
2019-07
2019-06
2019-05
2019-04
2019-03
2019-02
2019-01
2018-12
2018-11
2018-10
o3
135
149
104
101
71
62
88
108
141
127
132
148
141
113
106
75
60
51
75
111
pm25
32
31
25
28
49
48
32
34
27
24
26
27
32
36
40
39
52
39
36
35
co
730
637
635
586
908
802
608
760
711
632
514
537
616
619
754
693
896
792
798
701
no2
26
33
31
18
35
57
41
32
27
18
23
21
26
31
35
27
51
47
45
44
pm10
49
58
42
38
57
74
65
61
39
34
33
37
56
55
66
59
87
65
56
63
so2
5.6
8.8
7.3
6.9
9.3
11
8.9
7.4
5.3
2.4
2.6
4
7.7
7.6
8.9
5.7
7.9
7
6.9
8.1
* Pollution data source:
https://openaq.org
(ChinaAQIData)
The data is licensed under CC-By 4.0
PM2,5 61 (Unhealthy)
NO2 22 (Good)
PM10 69 (Unhealthy for Sensitive Groups)
CO 219 (Good)
O3 0 (Good)
SO2 8 (Good)
Data on air pollution from recent days in Zhenrucun
| index | 2022-05-27 |
|---|---|
| pm25 | 28 Moderate |
| no2 | 22 Good |
| pm10 | 35 Moderate |
| co | 579 Good |
| o3 | 22 Good |
| so2 | 5 Good |
| index | 2020-05 | 2020-04 | 2020-03 | 2020-02 | 2020-01 | 2019-12 | 2019-11 | 2019-10 | 2019-09 | 2019-08 | 2019-07 | 2019-06 | 2019-05 | 2019-04 | 2019-03 | 2019-02 | 2019-01 | 2018-12 | 2018-11 | 2018-10 |
|---|---|---|---|---|---|---|---|---|---|---|---|---|---|---|---|---|---|---|---|---|
| pm25 | 32 (Moderate) | 31 (Moderate) | 25 (Moderate) | 28 (Moderate) | 49 (Unhealthy for Sensitive Groups) | 48 (Unhealthy for Sensitive Groups) | 32 (Moderate) | 34 (Moderate) | 27 (Moderate) | 24 (Moderate) | 26 (Moderate) | 27 (Moderate) | 32 (Moderate) | 36 (Unhealthy for Sensitive Groups) | 40 (Unhealthy for Sensitive Groups) | 39 (Unhealthy for Sensitive Groups) | 52 (Unhealthy for Sensitive Groups) | 39 (Unhealthy for Sensitive Groups) | 36 (Unhealthy for Sensitive Groups) | 35 (Moderate) |
| co | 730 (Good) | 637 (Good) | 635 (Good) | 586 (Good) | 908 (Good) | 802 (Good) | 608 (Good) | 760 (Good) | 711 (Good) | 632 (Good) | 514 (Good) | 537 (Good) | 616 (Good) | 619 (Good) | 754 (Good) | 693 (Good) | 896 (Good) | 792 (Good) | 798 (Good) | 701 (Good) |
| no2 | 26 (Good) | 33 (Good) | 31 (Good) | 18 (Good) | 35 (Good) | 57 (Moderate) | 41 (Moderate) | 32 (Good) | 27 (Good) | 18 (Good) | 23 (Good) | 21 (Good) | 26 (Good) | 31 (Good) | 35 (Good) | 27 (Good) | 51 (Moderate) | 47 (Moderate) | 45 (Moderate) | 44 (Moderate) |
| o3 | 135 (Unhealthy for Sensitive Groups) | 149 (Unhealthy for Sensitive Groups) | 104 (Moderate) | 101 (Moderate) | 71 (Moderate) | 62 (Good) | 88 (Moderate) | 108 (Moderate) | 141 (Unhealthy for Sensitive Groups) | 127 (Unhealthy for Sensitive Groups) | 132 (Unhealthy for Sensitive Groups) | 148 (Unhealthy for Sensitive Groups) | 141 (Unhealthy for Sensitive Groups) | 113 (Moderate) | 106 (Moderate) | 75 (Moderate) | 60 (Good) | 51 (Good) | 75 (Moderate) | 111 (Moderate) |
| pm10 | 49 (Moderate) | 58 (Unhealthy for Sensitive Groups) | 42 (Moderate) | 38 (Moderate) | 57 (Unhealthy for Sensitive Groups) | 74 (Unhealthy for Sensitive Groups) | 65 (Unhealthy for Sensitive Groups) | 61 (Unhealthy for Sensitive Groups) | 39 (Moderate) | 34 (Moderate) | 33 (Moderate) | 37 (Moderate) | 56 (Unhealthy for Sensitive Groups) | 55 (Unhealthy for Sensitive Groups) | 66 (Unhealthy for Sensitive Groups) | 59 (Unhealthy for Sensitive Groups) | 87 (Unhealthy) | 65 (Unhealthy for Sensitive Groups) | 56 (Unhealthy for Sensitive Groups) | 63 (Unhealthy for Sensitive Groups) |
| so2 | 5.6 (Good) | 8.8 (Good) | 7.3 (Good) | 6.9 (Good) | 9.3 (Good) | 11 (Good) | 8.9 (Good) | 7.4 (Good) | 5.3 (Good) | 2.4 (Good) | 2.6 (Good) | 4 (Good) | 7.7 (Good) | 7.6 (Good) | 8.9 (Good) | 5.7 (Good) | 7.9 (Good) | 7 (Good) | 6.9 (Good) | 8.1 (Good) |
PM2,5 61 (Unhealthy)
particulate matter (PM2.5) dustNO2 22 (Good)
nitrogen dioxide (NO2)PM10 69 (Unhealthy for Sensitive Groups)
particulate matter (PM10) suspended dustCO 219 (Good)
carbon monoxide (CO)O3 0.05 (Good)
ozone (O3)SO2 7.7 (Good)
sulfur dioxide (SO2)嘉兴学院
| index | 2022-05-27 |
|---|---|
| pm25 | 28 |
| no2 | 22 |
| pm10 | 35 |
| co | 579 |
| o3 | 22 |
| so2 | 4.6 |
嘉兴学院

| index | 2020-05 | 2020-04 | 2020-03 | 2020-02 | 2020-01 | 2019-12 | 2019-11 | 2019-10 | 2019-09 | 2019-08 | 2019-07 | 2019-06 | 2019-05 | 2019-04 | 2019-03 | 2019-02 | 2019-01 | 2018-12 | 2018-11 | 2018-10 |
|---|---|---|---|---|---|---|---|---|---|---|---|---|---|---|---|---|---|---|---|---|
| o3 | 135 | 149 | 104 | 101 | 71 | 62 | 88 | 108 | 141 | 127 | 132 | 148 | 141 | 113 | 106 | 75 | 60 | 51 | 75 | 111 |
| pm25 | 32 | 31 | 25 | 28 | 49 | 48 | 32 | 34 | 27 | 24 | 26 | 27 | 32 | 36 | 40 | 39 | 52 | 39 | 36 | 35 |
| co | 730 | 637 | 635 | 586 | 908 | 802 | 608 | 760 | 711 | 632 | 514 | 537 | 616 | 619 | 754 | 693 | 896 | 792 | 798 | 701 |
| no2 | 26 | 33 | 31 | 18 | 35 | 57 | 41 | 32 | 27 | 18 | 23 | 21 | 26 | 31 | 35 | 27 | 51 | 47 | 45 | 44 |
| pm10 | 49 | 58 | 42 | 38 | 57 | 74 | 65 | 61 | 39 | 34 | 33 | 37 | 56 | 55 | 66 | 59 | 87 | 65 | 56 | 63 |
| so2 | 5.6 | 8.8 | 7.3 | 6.9 | 9.3 | 11 | 8.9 | 7.4 | 5.3 | 2.4 | 2.6 | 4 | 7.7 | 7.6 | 8.9 | 5.7 | 7.9 | 7 | 6.9 | 8.1 |