Air Pollution in Sanliqiaocun: Real-time Air Quality Index and smog alert.
Pollution and air quality forecast for Sanliqiaocun. Today is Tuesday, June 2, 2026. The following air pollution values have been recorded for Sanliqiaocun:- particulate matter (PM10) suspended dust - 179 (Very bad Hazardous)
- particulate matter (PM2.5) dust - 35 (Unhealthy for Sensitive Groups)
- ozone (O3) - 0 (Good)
- nitrogen dioxide (NO2) - 0 (Good)
- sulfur dioxide (SO2) - 0 (Good)

What is the air quality in Sanliqiaocun today? Is the air polluted in Sanliqiaocun?. Is there smog?
What is the level of PM10 today in Sanliqiaocun? (particulate matter (PM10) suspended dust)
The current level of particulate matter PM10 in Sanliqiaocun is:
179 (Very bad Hazardous)
The highest PM10 values usually occur in month: 95 (January 2019).
The lowest value of particulate matter PM10 pollution in Sanliqiaocun is usually recorded in: July (42).
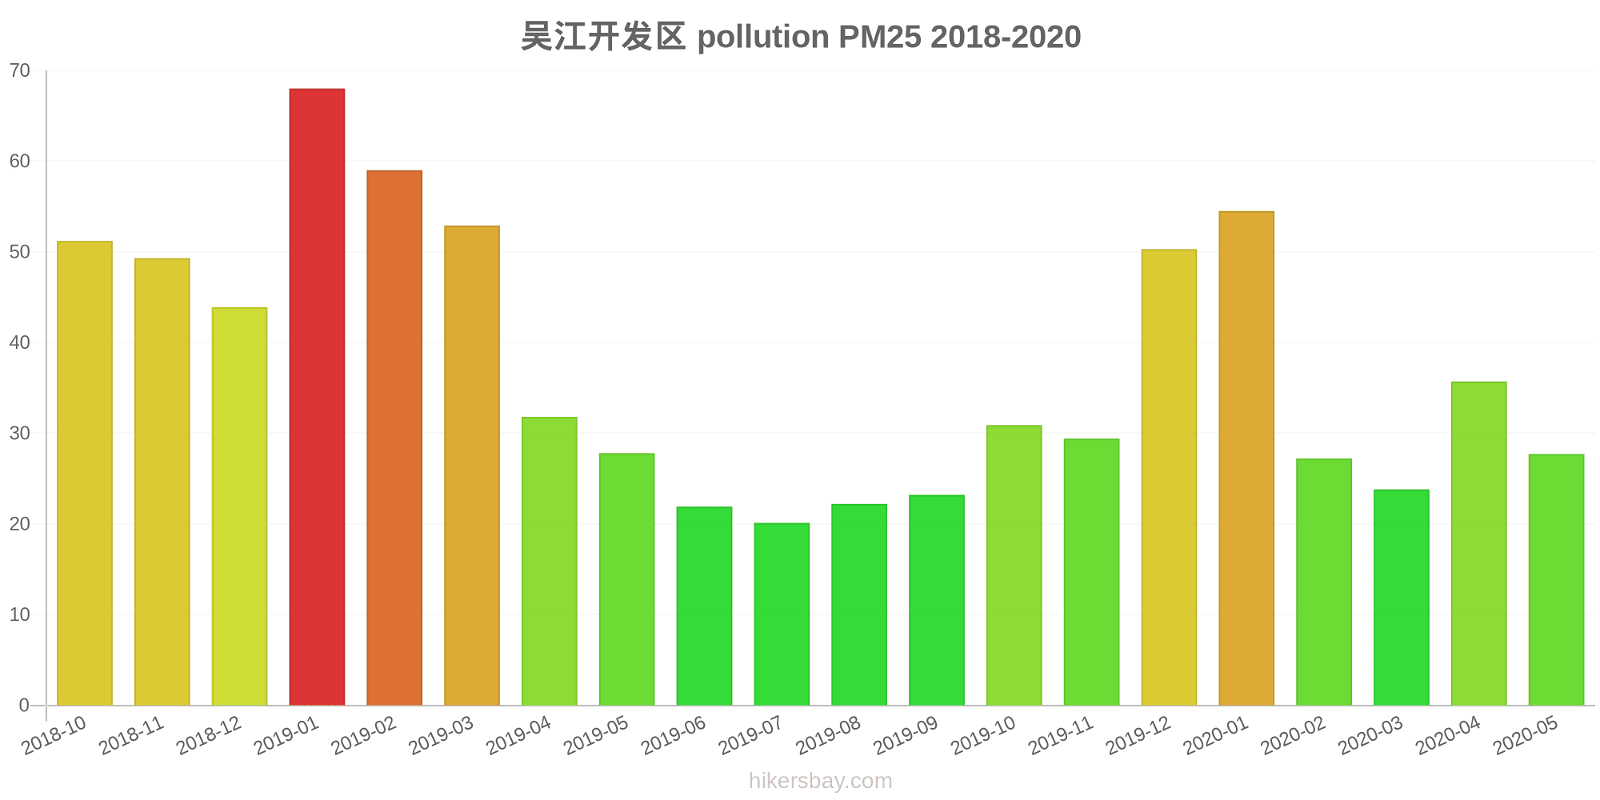
What is the current level of PM2.5 in Sanliqiaocun? (particulate matter (PM2.5) dust)
Today's PM2.5 level is:
35 (Unhealthy for Sensitive Groups)
For comparison, the highest level of PM2.5 in Sanliqiaocun in the last 7 days was: 56 (Friday, May 27, 2022) and the lowest: 56 (Friday, May 27, 2022).
The highest PM2.5 values were recorded: 68 (January 2019).
The lowest level of particulate matter PM2.5 pollution occurs in month: July (20).
How is the O3 level today in Sanliqiaocun? (ozone (O3))
0 (Good)
How high is the level of NO2? (nitrogen dioxide (NO2))
0 (Good)
What is the level of SO2 pollution? (sulfur dioxide (SO2))
0 (Good)
Current data Friday, May 27, 2022, 12:00 PM
PM10 179 (Very bad Hazardous)
PM2,5 35 (Unhealthy for Sensitive Groups)
O3 0 (Good)
NO2 0 (Good)
SO2 0 (Good)
Data on air pollution from recent days in Sanliqiaocun
index
2022-05-27
pm10
56
Unhealthy for Sensitive Groups
pm25
56
Unhealthy
o3
0
Good
no2
0
Good
so2
0
Good
data source »
Air pollution in Sanliqiaocun from October 2018 to May 2020

index
2020-05
2020-04
2020-03
2020-02
2020-01
2019-12
2019-11
2019-10
2019-09
2019-08
2019-07
2019-06
2019-05
2019-04
2019-03
2019-02
2019-01
2018-12
2018-11
2018-10
pm25
28 (Moderate)
36 (Unhealthy for Sensitive Groups)
24 (Moderate)
27 (Moderate)
55 (Unhealthy for Sensitive Groups)
50 (Unhealthy for Sensitive Groups)
29 (Moderate)
31 (Moderate)
23 (Moderate)
22 (Moderate)
20 (Moderate)
22 (Moderate)
28 (Moderate)
32 (Moderate)
53 (Unhealthy for Sensitive Groups)
59 (Unhealthy)
68 (Unhealthy)
44 (Unhealthy for Sensitive Groups)
49 (Unhealthy for Sensitive Groups)
51 (Unhealthy for Sensitive Groups)
co
682 (Good)
785 (Good)
867 (Good)
814 (Good)
1 (Good)
1 (Good)
730 (Good)
783 (Good)
797 (Good)
715 (Good)
743 (Good)
852 (Good)
838 (Good)
878 (Good)
914 (Good)
995 (Good)
1 (Good)
1 (Good)
1 (Good)
797 (Good)
no2
33 (Good)
50 (Moderate)
48 (Moderate)
23 (Good)
25 (Good)
47 (Moderate)
46 (Moderate)
47 (Moderate)
35 (Good)
25 (Good)
24 (Good)
22 (Good)
35 (Good)
40 (Moderate)
52 (Moderate)
35 (Good)
54 (Moderate)
54 (Moderate)
57 (Moderate)
44 (Moderate)
o3
155 (Unhealthy)
157 (Unhealthy)
110 (Moderate)
93 (Moderate)
70 (Moderate)
69 (Good)
92 (Moderate)
125 (Unhealthy for Sensitive Groups)
162 (Unhealthy)
163 (Unhealthy)
153 (Unhealthy)
177 (Unhealthy)
154 (Unhealthy)
152 (Unhealthy)
134 (Unhealthy for Sensitive Groups)
89 (Moderate)
65 (Good)
60 (Good)
93 (Moderate)
134 (Unhealthy for Sensitive Groups)
pm10
69 (Unhealthy for Sensitive Groups)
79 (Unhealthy for Sensitive Groups)
61 (Unhealthy for Sensitive Groups)
48 (Moderate)
82 (Unhealthy)
89 (Unhealthy)
81 (Unhealthy)
84 (Unhealthy)
52 (Unhealthy for Sensitive Groups)
44 (Moderate)
42 (Moderate)
44 (Moderate)
66 (Unhealthy for Sensitive Groups)
72 (Unhealthy for Sensitive Groups)
89 (Unhealthy)
75 (Unhealthy for Sensitive Groups)
95 (Unhealthy)
79 (Unhealthy for Sensitive Groups)
73 (Unhealthy for Sensitive Groups)
80 (Unhealthy for Sensitive Groups)
so2
8 (Good)
6.9 (Good)
6.6 (Good)
5.3 (Good)
6.2 (Good)
9.3 (Good)
7.6 (Good)
7.6 (Good)
6.2 (Good)
6.3 (Good)
6.2 (Good)
6.1 (Good)
10 (Good)
12 (Good)
13 (Good)
10 (Good)
13 (Good)
14 (Good)
12 (Good)
12 (Good)
data source »
吴江开发区
Friday, May 27, 2022, 12:00 PM
PM10 179 (Very bad Hazardous)
particulate matter (PM10) suspended dust
PM2,5 35 (Unhealthy for Sensitive Groups)
particulate matter (PM2.5) dust
O3 0.04 (Good)
ozone (O3)
NO2 0 (Good)
nitrogen dioxide (NO2)
SO2 0 (Good)
sulfur dioxide (SO2)
吴江开发区
index
2022-05-27
pm10
56
pm25
56
o3
0.03
no2
0
so2
0
吴江开发区
2018-10 2020-05
index
2020-05
2020-04
2020-03
2020-02
2020-01
2019-12
2019-11
2019-10
2019-09
2019-08
2019-07
2019-06
2019-05
2019-04
2019-03
2019-02
2019-01
2018-12
2018-11
2018-10
pm25
28
36
24
27
55
50
29
31
23
22
20
22
28
32
53
59
68
44
49
51
co
682
785
867
814
1
1
730
783
797
715
743
852
838
878
914
995
1
1
1
797
no2
33
50
48
23
25
47
46
47
35
25
24
22
35
40
52
35
54
54
57
44
o3
155
157
110
93
70
69
92
125
162
163
153
177
154
152
134
89
65
60
93
134
pm10
69
79
61
48
82
89
81
84
52
44
42
44
66
72
89
75
95
79
73
80
so2
8
6.9
6.6
5.3
6.2
9.3
7.6
7.6
6.2
6.3
6.2
6.1
10
12
13
10
13
14
12
12
* Pollution data source:
https://openaq.org
(ChinaAQIData)
The data is licensed under CC-By 4.0
PM10 179 (Very bad Hazardous)
PM2,5 35 (Unhealthy for Sensitive Groups)
O3 0 (Good)
NO2 0 (Good)
SO2 0 (Good)
Data on air pollution from recent days in Sanliqiaocun
| index | 2022-05-27 |
|---|---|
| pm10 | 56 Unhealthy for Sensitive Groups |
| pm25 | 56 Unhealthy |
| o3 | 0 Good |
| no2 | 0 Good |
| so2 | 0 Good |

| index | 2020-05 | 2020-04 | 2020-03 | 2020-02 | 2020-01 | 2019-12 | 2019-11 | 2019-10 | 2019-09 | 2019-08 | 2019-07 | 2019-06 | 2019-05 | 2019-04 | 2019-03 | 2019-02 | 2019-01 | 2018-12 | 2018-11 | 2018-10 |
|---|---|---|---|---|---|---|---|---|---|---|---|---|---|---|---|---|---|---|---|---|
| pm25 | 28 (Moderate) | 36 (Unhealthy for Sensitive Groups) | 24 (Moderate) | 27 (Moderate) | 55 (Unhealthy for Sensitive Groups) | 50 (Unhealthy for Sensitive Groups) | 29 (Moderate) | 31 (Moderate) | 23 (Moderate) | 22 (Moderate) | 20 (Moderate) | 22 (Moderate) | 28 (Moderate) | 32 (Moderate) | 53 (Unhealthy for Sensitive Groups) | 59 (Unhealthy) | 68 (Unhealthy) | 44 (Unhealthy for Sensitive Groups) | 49 (Unhealthy for Sensitive Groups) | 51 (Unhealthy for Sensitive Groups) |
| co | 682 (Good) | 785 (Good) | 867 (Good) | 814 (Good) | 1 (Good) | 1 (Good) | 730 (Good) | 783 (Good) | 797 (Good) | 715 (Good) | 743 (Good) | 852 (Good) | 838 (Good) | 878 (Good) | 914 (Good) | 995 (Good) | 1 (Good) | 1 (Good) | 1 (Good) | 797 (Good) |
| no2 | 33 (Good) | 50 (Moderate) | 48 (Moderate) | 23 (Good) | 25 (Good) | 47 (Moderate) | 46 (Moderate) | 47 (Moderate) | 35 (Good) | 25 (Good) | 24 (Good) | 22 (Good) | 35 (Good) | 40 (Moderate) | 52 (Moderate) | 35 (Good) | 54 (Moderate) | 54 (Moderate) | 57 (Moderate) | 44 (Moderate) |
| o3 | 155 (Unhealthy) | 157 (Unhealthy) | 110 (Moderate) | 93 (Moderate) | 70 (Moderate) | 69 (Good) | 92 (Moderate) | 125 (Unhealthy for Sensitive Groups) | 162 (Unhealthy) | 163 (Unhealthy) | 153 (Unhealthy) | 177 (Unhealthy) | 154 (Unhealthy) | 152 (Unhealthy) | 134 (Unhealthy for Sensitive Groups) | 89 (Moderate) | 65 (Good) | 60 (Good) | 93 (Moderate) | 134 (Unhealthy for Sensitive Groups) |
| pm10 | 69 (Unhealthy for Sensitive Groups) | 79 (Unhealthy for Sensitive Groups) | 61 (Unhealthy for Sensitive Groups) | 48 (Moderate) | 82 (Unhealthy) | 89 (Unhealthy) | 81 (Unhealthy) | 84 (Unhealthy) | 52 (Unhealthy for Sensitive Groups) | 44 (Moderate) | 42 (Moderate) | 44 (Moderate) | 66 (Unhealthy for Sensitive Groups) | 72 (Unhealthy for Sensitive Groups) | 89 (Unhealthy) | 75 (Unhealthy for Sensitive Groups) | 95 (Unhealthy) | 79 (Unhealthy for Sensitive Groups) | 73 (Unhealthy for Sensitive Groups) | 80 (Unhealthy for Sensitive Groups) |
| so2 | 8 (Good) | 6.9 (Good) | 6.6 (Good) | 5.3 (Good) | 6.2 (Good) | 9.3 (Good) | 7.6 (Good) | 7.6 (Good) | 6.2 (Good) | 6.3 (Good) | 6.2 (Good) | 6.1 (Good) | 10 (Good) | 12 (Good) | 13 (Good) | 10 (Good) | 13 (Good) | 14 (Good) | 12 (Good) | 12 (Good) |
PM10 179 (Very bad Hazardous)
particulate matter (PM10) suspended dustPM2,5 35 (Unhealthy for Sensitive Groups)
particulate matter (PM2.5) dustO3 0.04 (Good)
ozone (O3)NO2 0 (Good)
nitrogen dioxide (NO2)SO2 0 (Good)
sulfur dioxide (SO2)吴江开发区
| index | 2022-05-27 |
|---|---|
| pm10 | 56 |
| pm25 | 56 |
| o3 | 0.03 |
| no2 | 0 |
| so2 | 0 |
吴江开发区

| index | 2020-05 | 2020-04 | 2020-03 | 2020-02 | 2020-01 | 2019-12 | 2019-11 | 2019-10 | 2019-09 | 2019-08 | 2019-07 | 2019-06 | 2019-05 | 2019-04 | 2019-03 | 2019-02 | 2019-01 | 2018-12 | 2018-11 | 2018-10 |
|---|---|---|---|---|---|---|---|---|---|---|---|---|---|---|---|---|---|---|---|---|
| pm25 | 28 | 36 | 24 | 27 | 55 | 50 | 29 | 31 | 23 | 22 | 20 | 22 | 28 | 32 | 53 | 59 | 68 | 44 | 49 | 51 |
| co | 682 | 785 | 867 | 814 | 1 | 1 | 730 | 783 | 797 | 715 | 743 | 852 | 838 | 878 | 914 | 995 | 1 | 1 | 1 | 797 |
| no2 | 33 | 50 | 48 | 23 | 25 | 47 | 46 | 47 | 35 | 25 | 24 | 22 | 35 | 40 | 52 | 35 | 54 | 54 | 57 | 44 |
| o3 | 155 | 157 | 110 | 93 | 70 | 69 | 92 | 125 | 162 | 163 | 153 | 177 | 154 | 152 | 134 | 89 | 65 | 60 | 93 | 134 |
| pm10 | 69 | 79 | 61 | 48 | 82 | 89 | 81 | 84 | 52 | 44 | 42 | 44 | 66 | 72 | 89 | 75 | 95 | 79 | 73 | 80 |
| so2 | 8 | 6.9 | 6.6 | 5.3 | 6.2 | 9.3 | 7.6 | 7.6 | 6.2 | 6.3 | 6.2 | 6.1 | 10 | 12 | 13 | 10 | 13 | 14 | 12 | 12 |