Air Pollution in Shaoxiang: Real-time Air Quality Index and smog alert.
Pollution and air quality forecast for Shaoxiang. Today is Tuesday, June 2, 2026. The following air pollution values have been recorded for Shaoxiang:- particulate matter (PM10) suspended dust - 179 (Very bad Hazardous)
- particulate matter (PM2.5) dust - 35 (Unhealthy for Sensitive Groups)
- ozone (O3) - 0 (Good)
- nitrogen dioxide (NO2) - 0 (Good)
- sulfur dioxide (SO2) - 0 (Good)

What is the air quality in Shaoxiang today? Is the air polluted in Shaoxiang?. Is there smog?
What is the level of PM10 today in Shaoxiang? (particulate matter (PM10) suspended dust)
The current level of particulate matter PM10 in Shaoxiang is:
179 (Very bad Hazardous)
The highest PM10 values usually occur in month: 94 (March 2019).
The lowest value of particulate matter PM10 pollution in Shaoxiang is usually recorded in: July (39).
What is the current level of PM2.5 in Shaoxiang? (particulate matter (PM2.5) dust)
Today's PM2.5 level is:
35 (Unhealthy for Sensitive Groups)
For comparison, the highest level of PM2.5 in Shaoxiang in the last 7 days was: 56 (Friday, May 27, 2022) and the lowest: 56 (Friday, May 27, 2022).
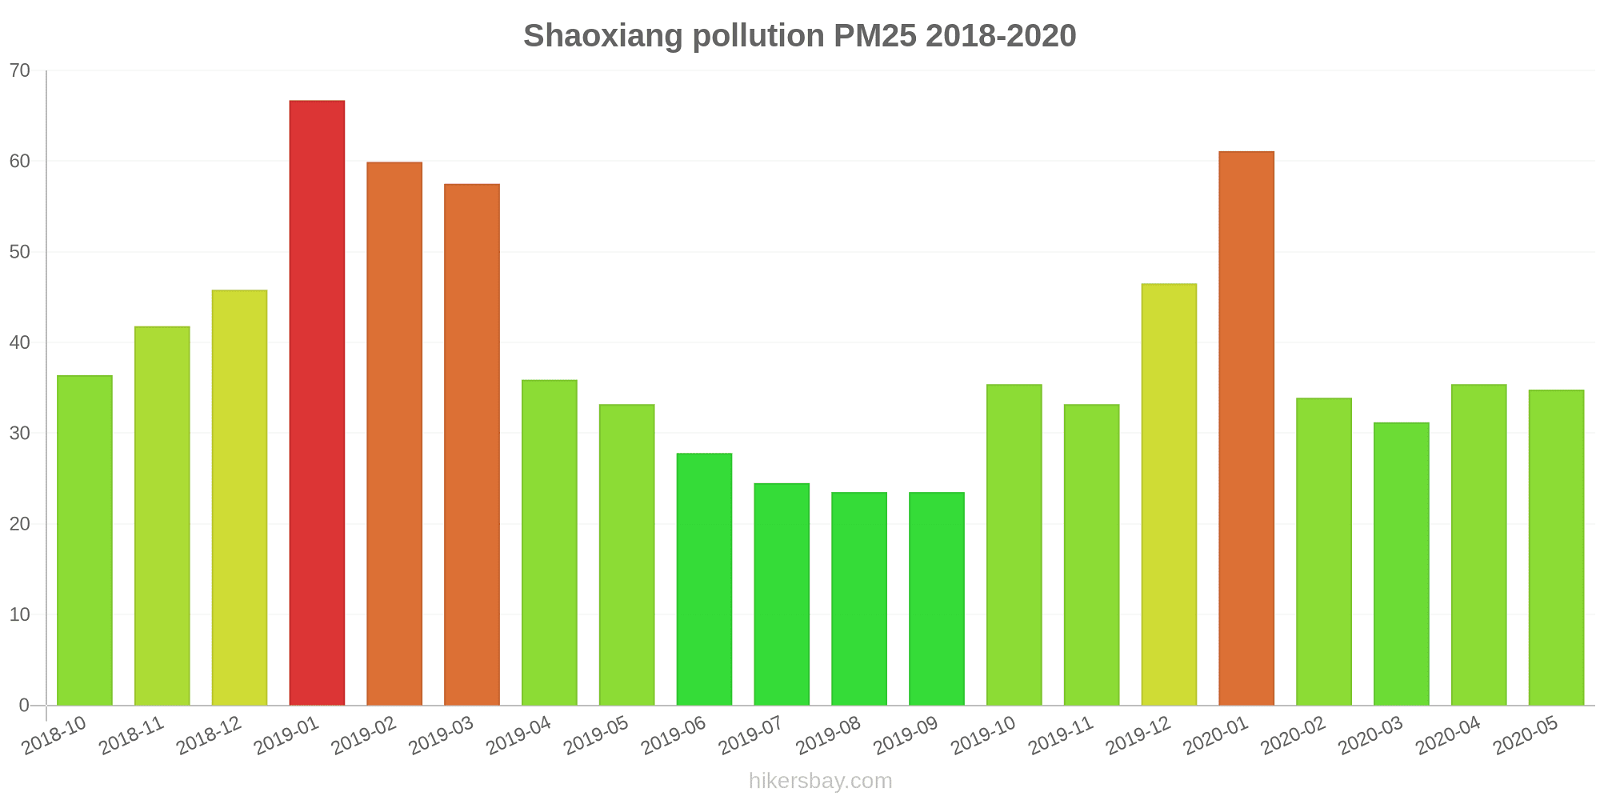
The highest PM2.5 values were recorded: 67 (January 2019).
The lowest level of particulate matter PM2.5 pollution occurs in month: September (24).
How is the O3 level today in Shaoxiang? (ozone (O3))
0 (Good)
How high is the level of NO2? (nitrogen dioxide (NO2))
0 (Good)
What is the level of SO2 pollution? (sulfur dioxide (SO2))
0 (Good)
Current data Friday, May 27, 2022, 12:00 PM
PM10 179 (Very bad Hazardous)
PM2,5 35 (Unhealthy for Sensitive Groups)
O3 0 (Good)
NO2 0 (Good)
SO2 0 (Good)
Data on air pollution from recent days in Shaoxiang
index
2022-05-27
pm10
56
Unhealthy for Sensitive Groups
pm25
56
Unhealthy
o3
0
Good
no2
0
Good
so2
0
Good
data source »
Air pollution in Shaoxiang from October 2018 to May 2020
index
2020-05
2020-04
2020-03
2020-02
2020-01
2019-12
2019-11
2019-10
2019-09
2019-08
2019-07
2019-06
2019-05
2019-04
2019-03
2019-02
2019-01
2018-12
2018-11
2018-10
pm25
35 (Moderate)
35 (Unhealthy for Sensitive Groups)
31 (Moderate)
34 (Moderate)
61 (Unhealthy)
47 (Unhealthy for Sensitive Groups)
33 (Moderate)
35 (Unhealthy for Sensitive Groups)
24 (Moderate)
24 (Moderate)
25 (Moderate)
28 (Moderate)
33 (Moderate)
36 (Unhealthy for Sensitive Groups)
58 (Unhealthy)
60 (Unhealthy)
67 (Unhealthy)
46 (Unhealthy for Sensitive Groups)
42 (Unhealthy for Sensitive Groups)
36 (Unhealthy for Sensitive Groups)
co
745 (Good)
646 (Good)
606 (Good)
595 (Good)
787 (Good)
800 (Good)
670 (Good)
713 (Good)
752 (Good)
650 (Good)
563 (Good)
533 (Good)
583 (Good)
619 (Good)
547 (Good)
1 (Good)
1 (Good)
875 (Good)
910 (Good)
694 (Good)
no2
29 (Good)
32 (Good)
26 (Good)
17 (Good)
32 (Good)
38 (Good)
37 (Good)
33 (Good)
22 (Good)
19 (Good)
21 (Good)
23 (Good)
28 (Good)
34 (Good)
41 (Moderate)
31 (Good)
47 (Moderate)
45 (Moderate)
46 (Moderate)
41 (Moderate)
o3
153 (Unhealthy)
148 (Unhealthy for Sensitive Groups)
117 (Moderate)
89 (Moderate)
81 (Moderate)
71 (Moderate)
105 (Moderate)
127 (Unhealthy for Sensitive Groups)
144 (Unhealthy for Sensitive Groups)
159 (Unhealthy)
164 (Unhealthy)
183 (Very Unhealthy)
150 (Unhealthy)
131 (Unhealthy for Sensitive Groups)
117 (Moderate)
85 (Moderate)
73 (Moderate)
62 (Good)
101 (Moderate)
140 (Unhealthy for Sensitive Groups)
pm10
61 (Unhealthy for Sensitive Groups)
68 (Unhealthy for Sensitive Groups)
58 (Unhealthy for Sensitive Groups)
48 (Moderate)
76 (Unhealthy for Sensitive Groups)
63 (Unhealthy for Sensitive Groups)
82 (Unhealthy)
78 (Unhealthy for Sensitive Groups)
46 (Moderate)
43 (Moderate)
39 (Moderate)
46 (Moderate)
60 (Unhealthy for Sensitive Groups)
61 (Unhealthy for Sensitive Groups)
94 (Unhealthy)
80 (Unhealthy)
92 (Unhealthy)
77 (Unhealthy for Sensitive Groups)
79 (Unhealthy for Sensitive Groups)
64 (Unhealthy for Sensitive Groups)
so2
8.3 (Good)
11 (Good)
10 (Good)
7.2 (Good)
8.3 (Good)
7.9 (Good)
12 (Good)
13 (Good)
14 (Good)
13 (Good)
9.3 (Good)
13 (Good)
9.6 (Good)
8.4 (Good)
8.3 (Good)
5.6 (Good)
7.4 (Good)
7.2 (Good)
5.8 (Good)
9.2 (Good)
data source »
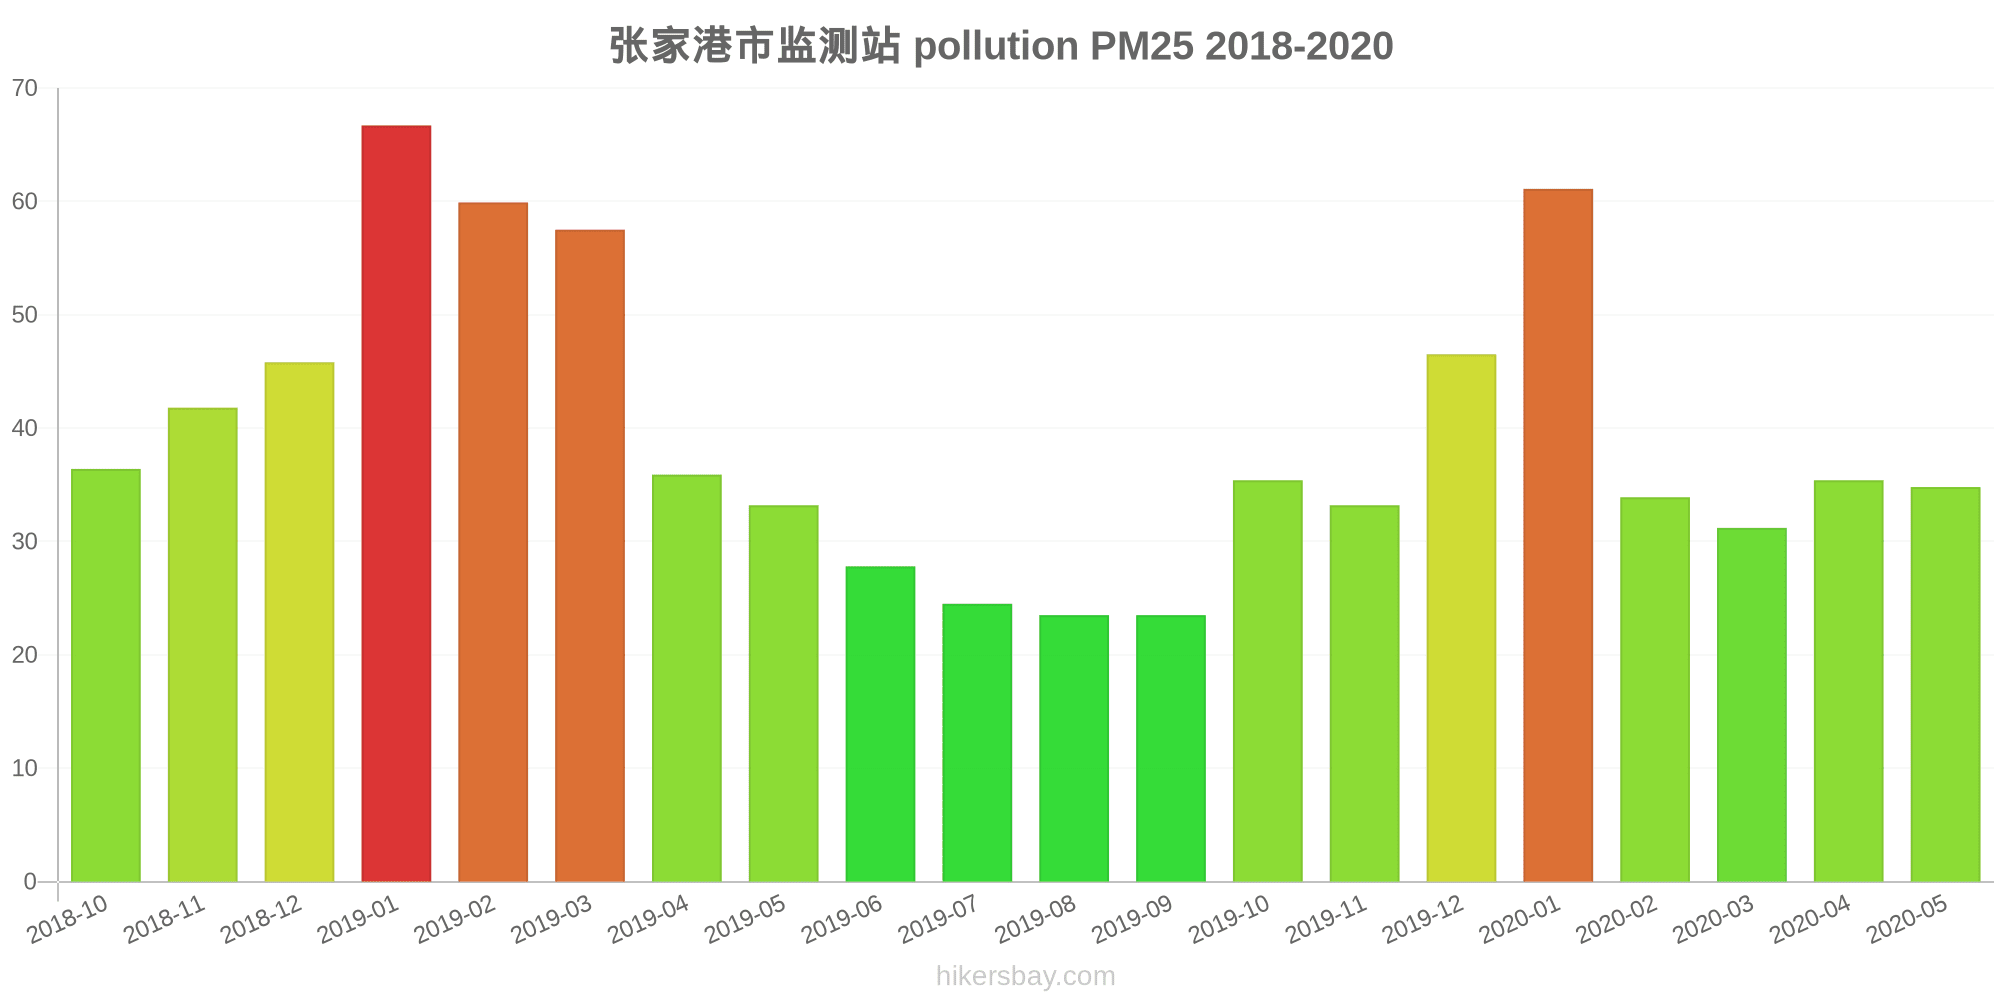
张家港市监测站
Friday, May 27, 2022, 12:00 PM
PM10 179 (Very bad Hazardous)
particulate matter (PM10) suspended dust
PM2,5 35 (Unhealthy for Sensitive Groups)
particulate matter (PM2.5) dust
O3 0.04 (Good)
ozone (O3)
NO2 0 (Good)
nitrogen dioxide (NO2)
SO2 0 (Good)
sulfur dioxide (SO2)
张家港市监测站
index
2022-05-27
pm10
56
pm25
56
o3
0.03
no2
0
so2
0
张家港市监测站
2018-10 2020-05

index
2020-05
2020-04
2020-03
2020-02
2020-01
2019-12
2019-11
2019-10
2019-09
2019-08
2019-07
2019-06
2019-05
2019-04
2019-03
2019-02
2019-01
2018-12
2018-11
2018-10
pm25
35
35
31
34
61
47
33
35
24
24
25
28
33
36
58
60
67
46
42
36
co
745
646
606
595
787
800
670
713
752
650
563
533
583
619
547
1
1
875
910
694
no2
29
32
26
17
32
38
37
33
22
19
21
23
28
34
41
31
47
45
46
41
o3
153
148
117
89
81
71
105
127
144
159
164
183
150
131
117
85
73
62
101
140
pm10
61
68
58
48
76
63
82
78
46
43
39
46
60
61
94
80
92
77
79
64
so2
8.3
11
10
7.2
8.3
7.9
12
13
14
13
9.3
13
9.6
8.4
8.3
5.6
7.4
7.2
5.8
9.2
* Pollution data source:
https://openaq.org
(ChinaAQIData)
The data is licensed under CC-By 4.0
PM10 179 (Very bad Hazardous)
PM2,5 35 (Unhealthy for Sensitive Groups)
O3 0 (Good)
NO2 0 (Good)
SO2 0 (Good)
Data on air pollution from recent days in Shaoxiang
| index | 2022-05-27 |
|---|---|
| pm10 | 56 Unhealthy for Sensitive Groups |
| pm25 | 56 Unhealthy |
| o3 | 0 Good |
| no2 | 0 Good |
| so2 | 0 Good |

| index | 2020-05 | 2020-04 | 2020-03 | 2020-02 | 2020-01 | 2019-12 | 2019-11 | 2019-10 | 2019-09 | 2019-08 | 2019-07 | 2019-06 | 2019-05 | 2019-04 | 2019-03 | 2019-02 | 2019-01 | 2018-12 | 2018-11 | 2018-10 |
|---|---|---|---|---|---|---|---|---|---|---|---|---|---|---|---|---|---|---|---|---|
| pm25 | 35 (Moderate) | 35 (Unhealthy for Sensitive Groups) | 31 (Moderate) | 34 (Moderate) | 61 (Unhealthy) | 47 (Unhealthy for Sensitive Groups) | 33 (Moderate) | 35 (Unhealthy for Sensitive Groups) | 24 (Moderate) | 24 (Moderate) | 25 (Moderate) | 28 (Moderate) | 33 (Moderate) | 36 (Unhealthy for Sensitive Groups) | 58 (Unhealthy) | 60 (Unhealthy) | 67 (Unhealthy) | 46 (Unhealthy for Sensitive Groups) | 42 (Unhealthy for Sensitive Groups) | 36 (Unhealthy for Sensitive Groups) |
| co | 745 (Good) | 646 (Good) | 606 (Good) | 595 (Good) | 787 (Good) | 800 (Good) | 670 (Good) | 713 (Good) | 752 (Good) | 650 (Good) | 563 (Good) | 533 (Good) | 583 (Good) | 619 (Good) | 547 (Good) | 1 (Good) | 1 (Good) | 875 (Good) | 910 (Good) | 694 (Good) |
| no2 | 29 (Good) | 32 (Good) | 26 (Good) | 17 (Good) | 32 (Good) | 38 (Good) | 37 (Good) | 33 (Good) | 22 (Good) | 19 (Good) | 21 (Good) | 23 (Good) | 28 (Good) | 34 (Good) | 41 (Moderate) | 31 (Good) | 47 (Moderate) | 45 (Moderate) | 46 (Moderate) | 41 (Moderate) |
| o3 | 153 (Unhealthy) | 148 (Unhealthy for Sensitive Groups) | 117 (Moderate) | 89 (Moderate) | 81 (Moderate) | 71 (Moderate) | 105 (Moderate) | 127 (Unhealthy for Sensitive Groups) | 144 (Unhealthy for Sensitive Groups) | 159 (Unhealthy) | 164 (Unhealthy) | 183 (Very Unhealthy) | 150 (Unhealthy) | 131 (Unhealthy for Sensitive Groups) | 117 (Moderate) | 85 (Moderate) | 73 (Moderate) | 62 (Good) | 101 (Moderate) | 140 (Unhealthy for Sensitive Groups) |
| pm10 | 61 (Unhealthy for Sensitive Groups) | 68 (Unhealthy for Sensitive Groups) | 58 (Unhealthy for Sensitive Groups) | 48 (Moderate) | 76 (Unhealthy for Sensitive Groups) | 63 (Unhealthy for Sensitive Groups) | 82 (Unhealthy) | 78 (Unhealthy for Sensitive Groups) | 46 (Moderate) | 43 (Moderate) | 39 (Moderate) | 46 (Moderate) | 60 (Unhealthy for Sensitive Groups) | 61 (Unhealthy for Sensitive Groups) | 94 (Unhealthy) | 80 (Unhealthy) | 92 (Unhealthy) | 77 (Unhealthy for Sensitive Groups) | 79 (Unhealthy for Sensitive Groups) | 64 (Unhealthy for Sensitive Groups) |
| so2 | 8.3 (Good) | 11 (Good) | 10 (Good) | 7.2 (Good) | 8.3 (Good) | 7.9 (Good) | 12 (Good) | 13 (Good) | 14 (Good) | 13 (Good) | 9.3 (Good) | 13 (Good) | 9.6 (Good) | 8.4 (Good) | 8.3 (Good) | 5.6 (Good) | 7.4 (Good) | 7.2 (Good) | 5.8 (Good) | 9.2 (Good) |
PM10 179 (Very bad Hazardous)
particulate matter (PM10) suspended dustPM2,5 35 (Unhealthy for Sensitive Groups)
particulate matter (PM2.5) dustO3 0.04 (Good)
ozone (O3)NO2 0 (Good)
nitrogen dioxide (NO2)SO2 0 (Good)
sulfur dioxide (SO2)张家港市监测站
| index | 2022-05-27 |
|---|---|
| pm10 | 56 |
| pm25 | 56 |
| o3 | 0.03 |
| no2 | 0 |
| so2 | 0 |
张家港市监测站
| index | 2020-05 | 2020-04 | 2020-03 | 2020-02 | 2020-01 | 2019-12 | 2019-11 | 2019-10 | 2019-09 | 2019-08 | 2019-07 | 2019-06 | 2019-05 | 2019-04 | 2019-03 | 2019-02 | 2019-01 | 2018-12 | 2018-11 | 2018-10 |
|---|---|---|---|---|---|---|---|---|---|---|---|---|---|---|---|---|---|---|---|---|
| pm25 | 35 | 35 | 31 | 34 | 61 | 47 | 33 | 35 | 24 | 24 | 25 | 28 | 33 | 36 | 58 | 60 | 67 | 46 | 42 | 36 |
| co | 745 | 646 | 606 | 595 | 787 | 800 | 670 | 713 | 752 | 650 | 563 | 533 | 583 | 619 | 547 | 1 | 1 | 875 | 910 | 694 |
| no2 | 29 | 32 | 26 | 17 | 32 | 38 | 37 | 33 | 22 | 19 | 21 | 23 | 28 | 34 | 41 | 31 | 47 | 45 | 46 | 41 |
| o3 | 153 | 148 | 117 | 89 | 81 | 71 | 105 | 127 | 144 | 159 | 164 | 183 | 150 | 131 | 117 | 85 | 73 | 62 | 101 | 140 |
| pm10 | 61 | 68 | 58 | 48 | 76 | 63 | 82 | 78 | 46 | 43 | 39 | 46 | 60 | 61 | 94 | 80 | 92 | 77 | 79 | 64 |
| so2 | 8.3 | 11 | 10 | 7.2 | 8.3 | 7.9 | 12 | 13 | 14 | 13 | 9.3 | 13 | 9.6 | 8.4 | 8.3 | 5.6 | 7.4 | 7.2 | 5.8 | 9.2 |