Air Pollution in Chengbei: Real-time Air Quality Index and smog alert.
Pollution and air quality forecast for Chengbei. Today is Tuesday, June 2, 2026. The following air pollution values have been recorded for Chengbei:- particulate matter (PM10) suspended dust - 179 (Very bad Hazardous)
- particulate matter (PM2.5) dust - 35 (Unhealthy for Sensitive Groups)
- ozone (O3) - 0 (Good)
- nitrogen dioxide (NO2) - 0 (Good)
- sulfur dioxide (SO2) - 0 (Good)

What is the air quality in Chengbei today? Is the air polluted in Chengbei?. Is there smog?
What is the level of PM10 today in Chengbei? (particulate matter (PM10) suspended dust)
The current level of particulate matter PM10 in Chengbei is:
179 (Very bad Hazardous)
The highest PM10 values usually occur in month: 108 (November 2018).
The lowest value of particulate matter PM10 pollution in Chengbei is usually recorded in: September (41).
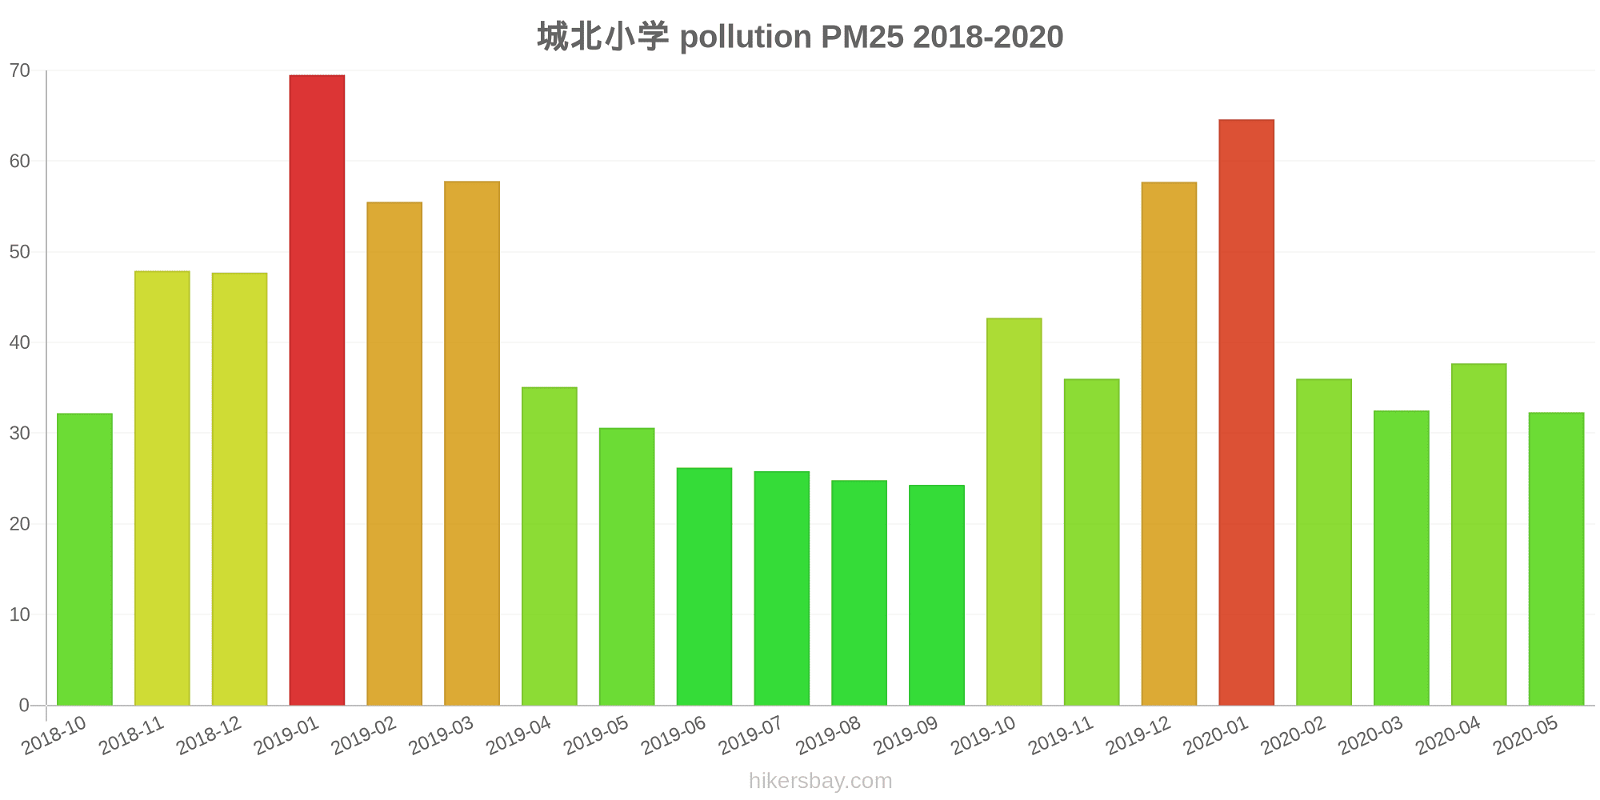
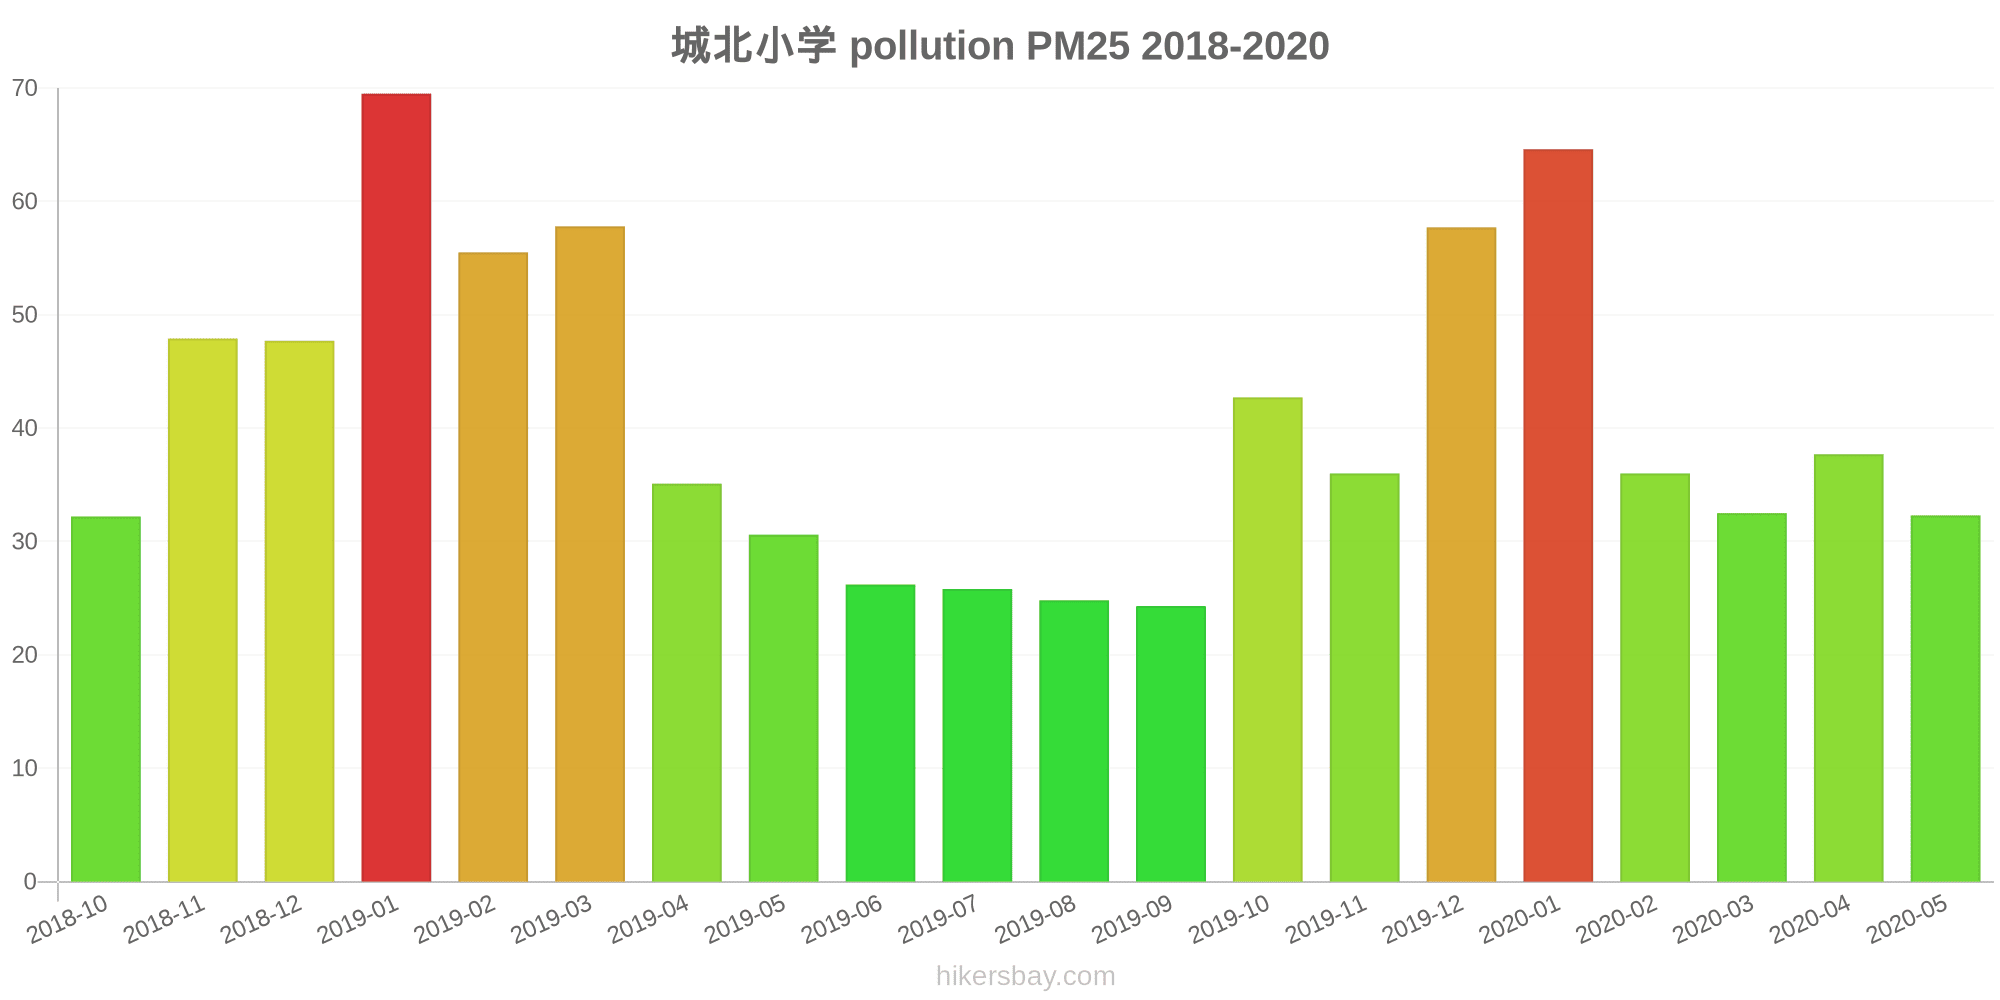
What is the current level of PM2.5 in Chengbei? (particulate matter (PM2.5) dust)
Today's PM2.5 level is:
35 (Unhealthy for Sensitive Groups)
For comparison, the highest level of PM2.5 in Chengbei in the last 7 days was: 56 (Friday, May 27, 2022) and the lowest: 56 (Friday, May 27, 2022).
The highest PM2.5 values were recorded: 70 (January 2019).
The lowest level of particulate matter PM2.5 pollution occurs in month: September (24).
How is the O3 level today in Chengbei? (ozone (O3))
0 (Good)
How high is the level of NO2? (nitrogen dioxide (NO2))
0 (Good)
What is the level of SO2 pollution? (sulfur dioxide (SO2))
0 (Good)
Current data Friday, May 27, 2022, 12:00 PM
PM10 179 (Very bad Hazardous)
PM2,5 35 (Unhealthy for Sensitive Groups)
O3 0 (Good)
NO2 0 (Good)
SO2 0 (Good)
Data on air pollution from recent days in Chengbei
index
2022-05-27
pm10
56
Unhealthy for Sensitive Groups
pm25
56
Unhealthy
o3
0
Good
no2
0
Good
so2
0
Good
data source »
Air pollution in Chengbei from October 2018 to May 2020

index
2020-05
2020-04
2020-03
2020-02
2020-01
2019-12
2019-11
2019-10
2019-09
2019-08
2019-07
2019-06
2019-05
2019-04
2019-03
2019-02
2019-01
2018-12
2018-11
2018-10
pm25
32 (Moderate)
38 (Unhealthy for Sensitive Groups)
33 (Moderate)
36 (Unhealthy for Sensitive Groups)
65 (Unhealthy)
58 (Unhealthy)
36 (Unhealthy for Sensitive Groups)
43 (Unhealthy for Sensitive Groups)
24 (Moderate)
25 (Moderate)
26 (Moderate)
26 (Moderate)
31 (Moderate)
35 (Unhealthy for Sensitive Groups)
58 (Unhealthy)
56 (Unhealthy)
70 (Unhealthy)
48 (Unhealthy for Sensitive Groups)
48 (Unhealthy for Sensitive Groups)
32 (Moderate)
co
829 (Good)
578 (Good)
980 (Good)
815 (Good)
1 (Good)
864 (Good)
646 (Good)
730 (Good)
693 (Good)
751 (Good)
695 (Good)
594 (Good)
626 (Good)
633 (Good)
678 (Good)
1 (Good)
1 (Good)
819 (Good)
790 (Good)
613 (Good)
no2
31 (Good)
44 (Moderate)
34 (Good)
20 (Good)
36 (Good)
52 (Moderate)
46 (Moderate)
45 (Moderate)
29 (Good)
26 (Good)
30 (Good)
29 (Good)
39 (Good)
41 (Moderate)
49 (Moderate)
36 (Good)
55 (Moderate)
51 (Moderate)
62 (Moderate)
56 (Moderate)
o3
170 (Unhealthy)
166 (Unhealthy)
128 (Unhealthy for Sensitive Groups)
99 (Moderate)
73 (Moderate)
76 (Moderate)
96 (Moderate)
125 (Unhealthy for Sensitive Groups)
128 (Unhealthy for Sensitive Groups)
158 (Unhealthy)
162 (Unhealthy)
174 (Unhealthy)
150 (Unhealthy)
128 (Unhealthy for Sensitive Groups)
113 (Moderate)
81 (Moderate)
67 (Good)
70 (Good)
100 (Moderate)
126 (Unhealthy for Sensitive Groups)
pm10
65 (Unhealthy for Sensitive Groups)
61 (Unhealthy for Sensitive Groups)
51 (Unhealthy for Sensitive Groups)
44 (Moderate)
72 (Unhealthy for Sensitive Groups)
74 (Unhealthy for Sensitive Groups)
69 (Unhealthy for Sensitive Groups)
73 (Unhealthy for Sensitive Groups)
41 (Moderate)
45 (Moderate)
60 (Unhealthy for Sensitive Groups)
62 (Unhealthy for Sensitive Groups)
84 (Unhealthy)
85 (Unhealthy)
107 (Unhealthy)
89 (Unhealthy)
106 (Unhealthy)
88 (Unhealthy)
108 (Unhealthy)
88 (Unhealthy)
so2
8.7 (Good)
11 (Good)
10 (Good)
6.8 (Good)
7.3 (Good)
9.9 (Good)
7.2 (Good)
7.7 (Good)
6.2 (Good)
6.7 (Good)
6.2 (Good)
8.4 (Good)
9 (Good)
7.4 (Good)
9 (Good)
5.4 (Good)
8.4 (Good)
7.9 (Good)
7.3 (Good)
9.9 (Good)
data source »
城北小学
Friday, May 27, 2022, 12:00 PM
PM10 179 (Very bad Hazardous)
particulate matter (PM10) suspended dust
PM2,5 35 (Unhealthy for Sensitive Groups)
particulate matter (PM2.5) dust
O3 0.04 (Good)
ozone (O3)
NO2 0 (Good)
nitrogen dioxide (NO2)
SO2 0 (Good)
sulfur dioxide (SO2)
城北小学
index
2022-05-27
pm10
56
pm25
56
o3
0.03
no2
0
so2
0
城北小学
2018-10 2020-05
index
2020-05
2020-04
2020-03
2020-02
2020-01
2019-12
2019-11
2019-10
2019-09
2019-08
2019-07
2019-06
2019-05
2019-04
2019-03
2019-02
2019-01
2018-12
2018-11
2018-10
pm25
32
38
33
36
65
58
36
43
24
25
26
26
31
35
58
56
70
48
48
32
co
829
578
980
815
1
864
646
730
693
751
695
594
626
633
678
1
1
819
790
613
no2
31
44
34
20
36
52
46
45
29
26
30
29
39
41
49
36
55
51
62
56
o3
170
166
128
99
73
76
96
125
128
158
162
174
150
128
113
81
67
70
100
126
pm10
65
61
51
44
72
74
69
73
41
45
60
62
84
85
107
89
106
88
108
88
so2
8.7
11
10
6.8
7.3
9.9
7.2
7.7
6.2
6.7
6.2
8.4
9
7.4
9
5.4
8.4
7.9
7.3
9.9
* Pollution data source:
https://openaq.org
(ChinaAQIData)
The data is licensed under CC-By 4.0
PM10 179 (Very bad Hazardous)
PM2,5 35 (Unhealthy for Sensitive Groups)
O3 0 (Good)
NO2 0 (Good)
SO2 0 (Good)
Data on air pollution from recent days in Chengbei
| index | 2022-05-27 |
|---|---|
| pm10 | 56 Unhealthy for Sensitive Groups |
| pm25 | 56 Unhealthy |
| o3 | 0 Good |
| no2 | 0 Good |
| so2 | 0 Good |

| index | 2020-05 | 2020-04 | 2020-03 | 2020-02 | 2020-01 | 2019-12 | 2019-11 | 2019-10 | 2019-09 | 2019-08 | 2019-07 | 2019-06 | 2019-05 | 2019-04 | 2019-03 | 2019-02 | 2019-01 | 2018-12 | 2018-11 | 2018-10 |
|---|---|---|---|---|---|---|---|---|---|---|---|---|---|---|---|---|---|---|---|---|
| pm25 | 32 (Moderate) | 38 (Unhealthy for Sensitive Groups) | 33 (Moderate) | 36 (Unhealthy for Sensitive Groups) | 65 (Unhealthy) | 58 (Unhealthy) | 36 (Unhealthy for Sensitive Groups) | 43 (Unhealthy for Sensitive Groups) | 24 (Moderate) | 25 (Moderate) | 26 (Moderate) | 26 (Moderate) | 31 (Moderate) | 35 (Unhealthy for Sensitive Groups) | 58 (Unhealthy) | 56 (Unhealthy) | 70 (Unhealthy) | 48 (Unhealthy for Sensitive Groups) | 48 (Unhealthy for Sensitive Groups) | 32 (Moderate) |
| co | 829 (Good) | 578 (Good) | 980 (Good) | 815 (Good) | 1 (Good) | 864 (Good) | 646 (Good) | 730 (Good) | 693 (Good) | 751 (Good) | 695 (Good) | 594 (Good) | 626 (Good) | 633 (Good) | 678 (Good) | 1 (Good) | 1 (Good) | 819 (Good) | 790 (Good) | 613 (Good) |
| no2 | 31 (Good) | 44 (Moderate) | 34 (Good) | 20 (Good) | 36 (Good) | 52 (Moderate) | 46 (Moderate) | 45 (Moderate) | 29 (Good) | 26 (Good) | 30 (Good) | 29 (Good) | 39 (Good) | 41 (Moderate) | 49 (Moderate) | 36 (Good) | 55 (Moderate) | 51 (Moderate) | 62 (Moderate) | 56 (Moderate) |
| o3 | 170 (Unhealthy) | 166 (Unhealthy) | 128 (Unhealthy for Sensitive Groups) | 99 (Moderate) | 73 (Moderate) | 76 (Moderate) | 96 (Moderate) | 125 (Unhealthy for Sensitive Groups) | 128 (Unhealthy for Sensitive Groups) | 158 (Unhealthy) | 162 (Unhealthy) | 174 (Unhealthy) | 150 (Unhealthy) | 128 (Unhealthy for Sensitive Groups) | 113 (Moderate) | 81 (Moderate) | 67 (Good) | 70 (Good) | 100 (Moderate) | 126 (Unhealthy for Sensitive Groups) |
| pm10 | 65 (Unhealthy for Sensitive Groups) | 61 (Unhealthy for Sensitive Groups) | 51 (Unhealthy for Sensitive Groups) | 44 (Moderate) | 72 (Unhealthy for Sensitive Groups) | 74 (Unhealthy for Sensitive Groups) | 69 (Unhealthy for Sensitive Groups) | 73 (Unhealthy for Sensitive Groups) | 41 (Moderate) | 45 (Moderate) | 60 (Unhealthy for Sensitive Groups) | 62 (Unhealthy for Sensitive Groups) | 84 (Unhealthy) | 85 (Unhealthy) | 107 (Unhealthy) | 89 (Unhealthy) | 106 (Unhealthy) | 88 (Unhealthy) | 108 (Unhealthy) | 88 (Unhealthy) |
| so2 | 8.7 (Good) | 11 (Good) | 10 (Good) | 6.8 (Good) | 7.3 (Good) | 9.9 (Good) | 7.2 (Good) | 7.7 (Good) | 6.2 (Good) | 6.7 (Good) | 6.2 (Good) | 8.4 (Good) | 9 (Good) | 7.4 (Good) | 9 (Good) | 5.4 (Good) | 8.4 (Good) | 7.9 (Good) | 7.3 (Good) | 9.9 (Good) |
PM10 179 (Very bad Hazardous)
particulate matter (PM10) suspended dustPM2,5 35 (Unhealthy for Sensitive Groups)
particulate matter (PM2.5) dustO3 0.04 (Good)
ozone (O3)NO2 0 (Good)
nitrogen dioxide (NO2)SO2 0 (Good)
sulfur dioxide (SO2)城北小学
| index | 2022-05-27 |
|---|---|
| pm10 | 56 |
| pm25 | 56 |
| o3 | 0.03 |
| no2 | 0 |
| so2 | 0 |
城北小学
| index | 2020-05 | 2020-04 | 2020-03 | 2020-02 | 2020-01 | 2019-12 | 2019-11 | 2019-10 | 2019-09 | 2019-08 | 2019-07 | 2019-06 | 2019-05 | 2019-04 | 2019-03 | 2019-02 | 2019-01 | 2018-12 | 2018-11 | 2018-10 |
|---|---|---|---|---|---|---|---|---|---|---|---|---|---|---|---|---|---|---|---|---|
| pm25 | 32 | 38 | 33 | 36 | 65 | 58 | 36 | 43 | 24 | 25 | 26 | 26 | 31 | 35 | 58 | 56 | 70 | 48 | 48 | 32 |
| co | 829 | 578 | 980 | 815 | 1 | 864 | 646 | 730 | 693 | 751 | 695 | 594 | 626 | 633 | 678 | 1 | 1 | 819 | 790 | 613 |
| no2 | 31 | 44 | 34 | 20 | 36 | 52 | 46 | 45 | 29 | 26 | 30 | 29 | 39 | 41 | 49 | 36 | 55 | 51 | 62 | 56 |
| o3 | 170 | 166 | 128 | 99 | 73 | 76 | 96 | 125 | 128 | 158 | 162 | 174 | 150 | 128 | 113 | 81 | 67 | 70 | 100 | 126 |
| pm10 | 65 | 61 | 51 | 44 | 72 | 74 | 69 | 73 | 41 | 45 | 60 | 62 | 84 | 85 | 107 | 89 | 106 | 88 | 108 | 88 |
| so2 | 8.7 | 11 | 10 | 6.8 | 7.3 | 9.9 | 7.2 | 7.7 | 6.2 | 6.7 | 6.2 | 8.4 | 9 | 7.4 | 9 | 5.4 | 8.4 | 7.9 | 7.3 | 9.9 |