Air Pollution in Zhangbeicun: Real-time Air Quality Index and smog alert.
Pollution and air quality forecast for Zhangbeicun. Today is Tuesday, June 2, 2026. The following air pollution values have been recorded for Zhangbeicun:- particulate matter (PM10) suspended dust - 179 (Very bad Hazardous)
- particulate matter (PM2.5) dust - 35 (Unhealthy for Sensitive Groups)
- ozone (O3) - 0 (Good)
- nitrogen dioxide (NO2) - 0 (Good)
- sulfur dioxide (SO2) - 0 (Good)

What is the air quality in Zhangbeicun today? Is the air polluted in Zhangbeicun?. Is there smog?
What is the level of PM10 today in Zhangbeicun? (particulate matter (PM10) suspended dust)
The current level of particulate matter PM10 in Zhangbeicun is:
179 (Very bad Hazardous)
The highest PM10 values usually occur in month: 77 (December 2019).
The lowest value of particulate matter PM10 pollution in Zhangbeicun is usually recorded in: August (30).
What is the current level of PM2.5 in Zhangbeicun? (particulate matter (PM2.5) dust)
Today's PM2.5 level is:
35 (Unhealthy for Sensitive Groups)
For comparison, the highest level of PM2.5 in Zhangbeicun in the last 7 days was: 56 (Friday, May 27, 2022) and the lowest: 56 (Friday, May 27, 2022).
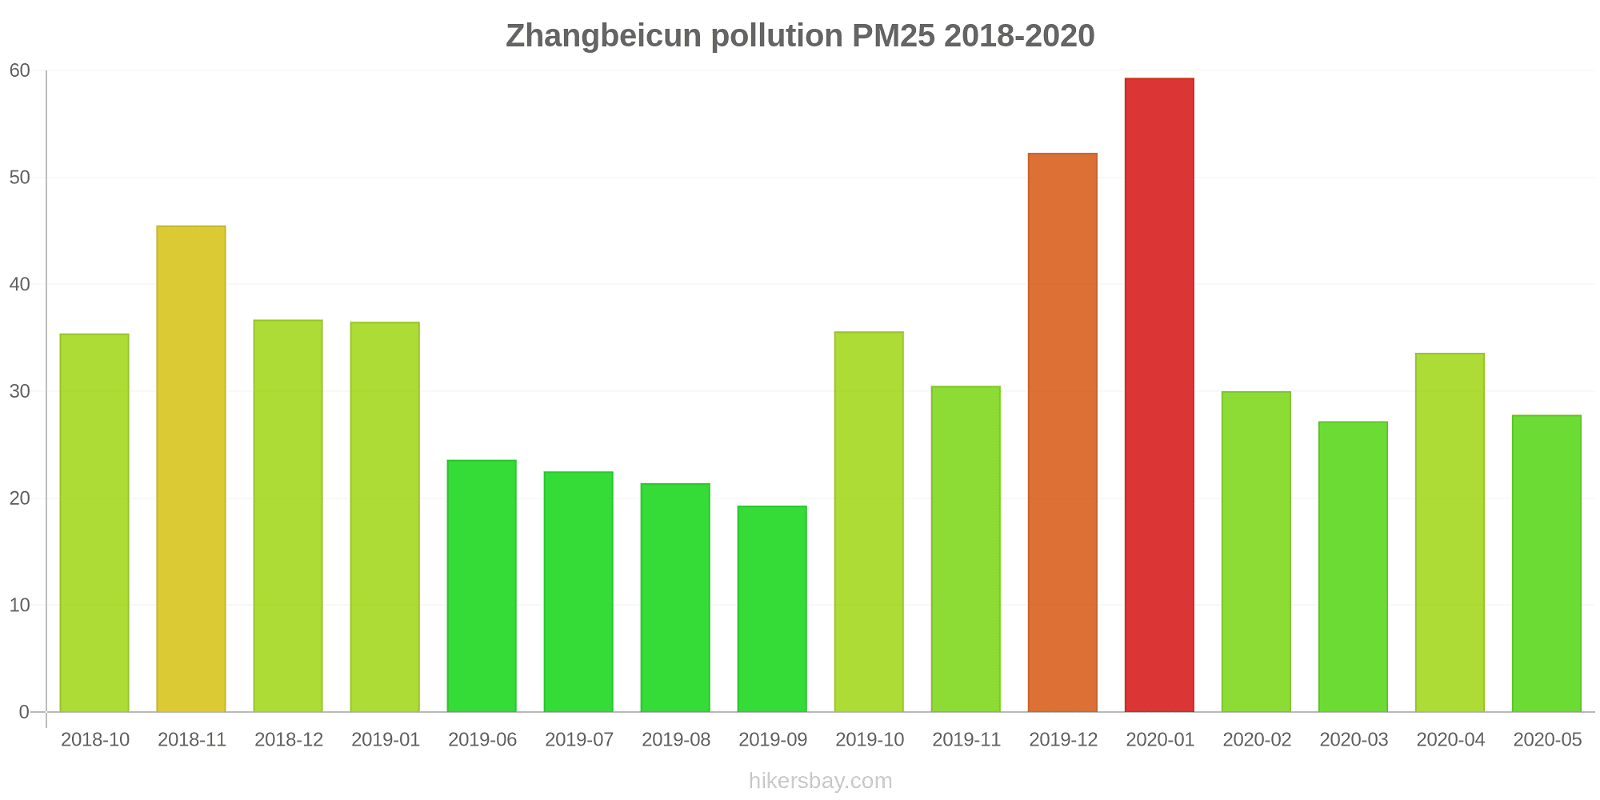
The highest PM2.5 values were recorded: 59 (January 2020).
The lowest level of particulate matter PM2.5 pollution occurs in month: September (19).
How is the O3 level today in Zhangbeicun? (ozone (O3))
0 (Good)
How high is the level of NO2? (nitrogen dioxide (NO2))
0 (Good)
What is the level of SO2 pollution? (sulfur dioxide (SO2))
0 (Good)
Current data Friday, May 27, 2022, 12:00 PM
PM10 179 (Very bad Hazardous)
PM2,5 35 (Unhealthy for Sensitive Groups)
O3 0 (Good)
NO2 0 (Good)
SO2 0 (Good)
Data on air pollution from recent days in Zhangbeicun
index
2022-05-27
pm10
56
Unhealthy for Sensitive Groups
pm25
56
Unhealthy
o3
0
Good
no2
0
Good
so2
0
Good
data source »
Air pollution in Zhangbeicun from October 2018 to May 2020
index
2020-05
2020-04
2020-03
2020-02
2020-01
2019-12
2019-11
2019-10
2019-09
2019-08
2019-07
2019-06
2019-01
2018-12
2018-11
2018-10
pm25
28 (Moderate)
34 (Moderate)
27 (Moderate)
30 (Moderate)
59 (Unhealthy)
52 (Unhealthy for Sensitive Groups)
31 (Moderate)
36 (Unhealthy for Sensitive Groups)
19 (Moderate)
21 (Moderate)
23 (Moderate)
24 (Moderate)
37 (Unhealthy for Sensitive Groups)
37 (Unhealthy for Sensitive Groups)
46 (Unhealthy for Sensitive Groups)
35 (Unhealthy for Sensitive Groups)
co
1 (Good)
1 (Good)
1 (Good)
1 (Good)
1 (Good)
855 (Good)
892 (Good)
897 (Good)
795 (Good)
772 (Good)
523 (Good)
950 (Good)
817 (Good)
785 (Good)
962 (Good)
784 (Good)
no2
21 (Good)
23 (Good)
29 (Good)
24 (Good)
19 (Good)
43 (Moderate)
11 (Good)
15 (Good)
14 (Good)
16 (Good)
17 (Good)
15 (Good)
16 (Good)
25 (Good)
25 (Good)
25 (Good)
o3
157 (Unhealthy)
144 (Unhealthy for Sensitive Groups)
127 (Unhealthy for Sensitive Groups)
95 (Moderate)
64 (Good)
71 (Moderate)
109 (Moderate)
131 (Unhealthy for Sensitive Groups)
120 (Unhealthy for Sensitive Groups)
153 (Unhealthy)
161 (Unhealthy)
136 (Unhealthy for Sensitive Groups)
81 (Moderate)
80 (Moderate)
111 (Moderate)
131 (Unhealthy for Sensitive Groups)
pm10
53 (Unhealthy for Sensitive Groups)
61 (Unhealthy for Sensitive Groups)
50 (Unhealthy for Sensitive Groups)
43 (Moderate)
76 (Unhealthy for Sensitive Groups)
77 (Unhealthy for Sensitive Groups)
60 (Unhealthy for Sensitive Groups)
60 (Unhealthy for Sensitive Groups)
31 (Moderate)
30 (Moderate)
31 (Moderate)
35 (Moderate)
54 (Unhealthy for Sensitive Groups)
63 (Unhealthy for Sensitive Groups)
66 (Unhealthy for Sensitive Groups)
59 (Unhealthy for Sensitive Groups)
so2
7 (Good)
7.2 (Good)
11 (Good)
22 (Good)
20 (Good)
15 (Good)
11 (Good)
13 (Good)
15 (Good)
15 (Good)
14 (Good)
13 (Good)
6.8 (Good)
8.1 (Good)
10 (Good)
- (Good)
data source »
社会福利院
Friday, May 27, 2022, 12:00 PM
PM10 179 (Very bad Hazardous)
particulate matter (PM10) suspended dust
PM2,5 35 (Unhealthy for Sensitive Groups)
particulate matter (PM2.5) dust
O3 0.04 (Good)
ozone (O3)
NO2 0 (Good)
nitrogen dioxide (NO2)
SO2 0 (Good)
sulfur dioxide (SO2)
社会福利院
index
2022-05-27
pm10
56
pm25
56
o3
0.03
no2
0
so2
0
社会福利院
2018-10 2020-05
index
2020-05
2020-04
2020-03
2020-02
2020-01
2019-12
2019-11
2019-10
2019-09
2019-08
2019-07
2019-06
2019-01
2018-12
2018-11
2018-10
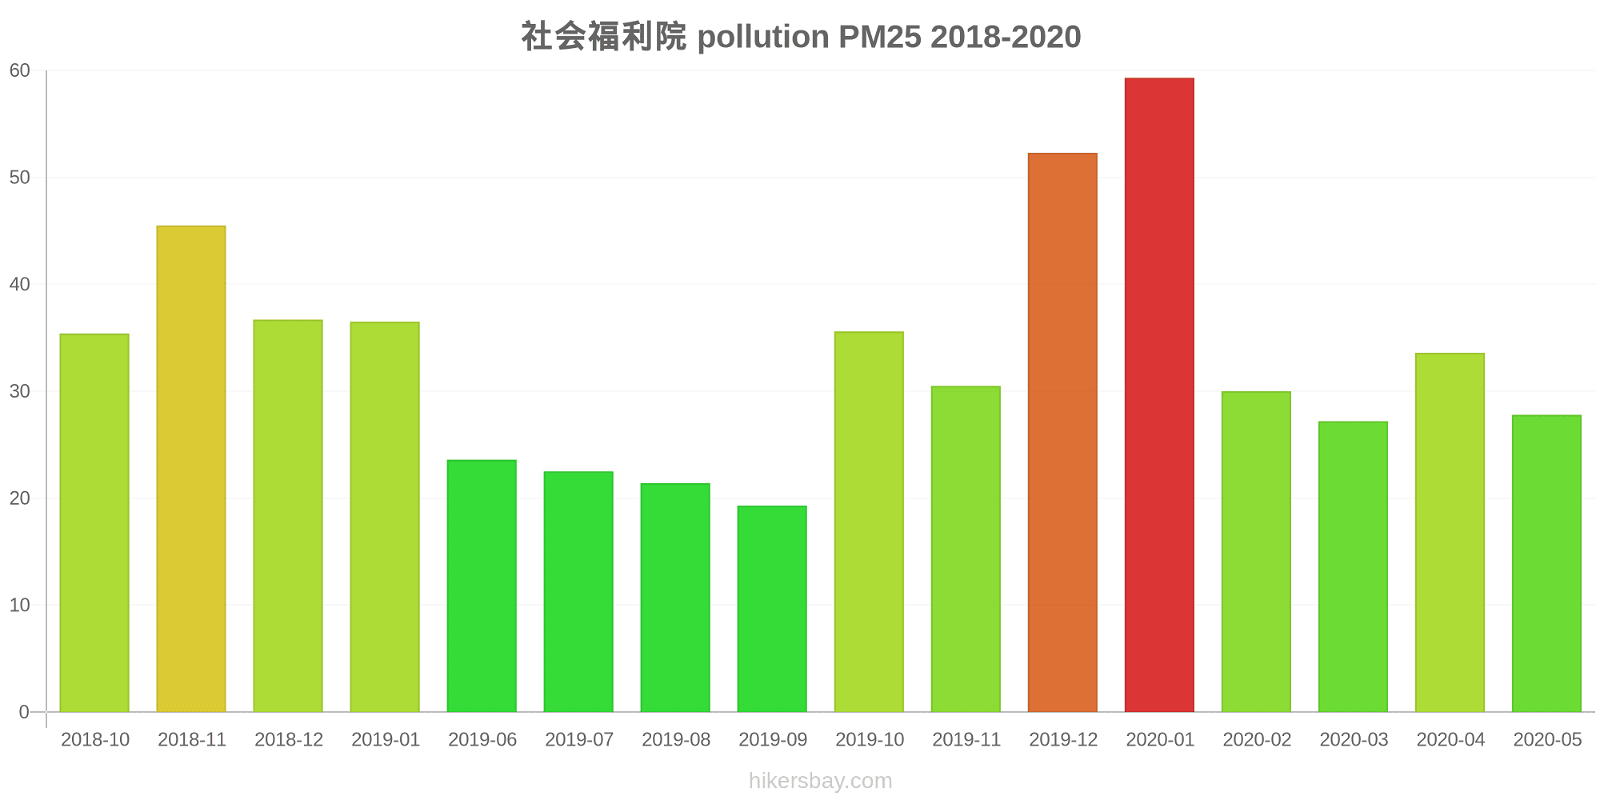
pm25
28
34
27
30
59
52
31
36
19
21
23
24
37
37
46
35
co
1
1
1
1
1
855
892
897
795
772
523
950
817
785
962
784
no2
21
23
29
24
19
43
11
15
14
16
17
15
16
25
25
25
o3
157
144
127
95
64
71
109
131
120
153
161
136
81
80
111
131
pm10
53
61
50
43
76
77
60
60
31
30
31
35
54
63
66
59
so2
7
7.2
11
22
20
15
11
13
15
15
14
13
6.8
8.1
10
-
* Pollution data source:
https://openaq.org
(ChinaAQIData)
The data is licensed under CC-By 4.0
PM10 179 (Very bad Hazardous)
PM2,5 35 (Unhealthy for Sensitive Groups)
O3 0 (Good)
NO2 0 (Good)
SO2 0 (Good)
Data on air pollution from recent days in Zhangbeicun
| index | 2022-05-27 |
|---|---|
| pm10 | 56 Unhealthy for Sensitive Groups |
| pm25 | 56 Unhealthy |
| o3 | 0 Good |
| no2 | 0 Good |
| so2 | 0 Good |

| index | 2020-05 | 2020-04 | 2020-03 | 2020-02 | 2020-01 | 2019-12 | 2019-11 | 2019-10 | 2019-09 | 2019-08 | 2019-07 | 2019-06 | 2019-01 | 2018-12 | 2018-11 | 2018-10 |
|---|---|---|---|---|---|---|---|---|---|---|---|---|---|---|---|---|
| pm25 | 28 (Moderate) | 34 (Moderate) | 27 (Moderate) | 30 (Moderate) | 59 (Unhealthy) | 52 (Unhealthy for Sensitive Groups) | 31 (Moderate) | 36 (Unhealthy for Sensitive Groups) | 19 (Moderate) | 21 (Moderate) | 23 (Moderate) | 24 (Moderate) | 37 (Unhealthy for Sensitive Groups) | 37 (Unhealthy for Sensitive Groups) | 46 (Unhealthy for Sensitive Groups) | 35 (Unhealthy for Sensitive Groups) |
| co | 1 (Good) | 1 (Good) | 1 (Good) | 1 (Good) | 1 (Good) | 855 (Good) | 892 (Good) | 897 (Good) | 795 (Good) | 772 (Good) | 523 (Good) | 950 (Good) | 817 (Good) | 785 (Good) | 962 (Good) | 784 (Good) |
| no2 | 21 (Good) | 23 (Good) | 29 (Good) | 24 (Good) | 19 (Good) | 43 (Moderate) | 11 (Good) | 15 (Good) | 14 (Good) | 16 (Good) | 17 (Good) | 15 (Good) | 16 (Good) | 25 (Good) | 25 (Good) | 25 (Good) |
| o3 | 157 (Unhealthy) | 144 (Unhealthy for Sensitive Groups) | 127 (Unhealthy for Sensitive Groups) | 95 (Moderate) | 64 (Good) | 71 (Moderate) | 109 (Moderate) | 131 (Unhealthy for Sensitive Groups) | 120 (Unhealthy for Sensitive Groups) | 153 (Unhealthy) | 161 (Unhealthy) | 136 (Unhealthy for Sensitive Groups) | 81 (Moderate) | 80 (Moderate) | 111 (Moderate) | 131 (Unhealthy for Sensitive Groups) |
| pm10 | 53 (Unhealthy for Sensitive Groups) | 61 (Unhealthy for Sensitive Groups) | 50 (Unhealthy for Sensitive Groups) | 43 (Moderate) | 76 (Unhealthy for Sensitive Groups) | 77 (Unhealthy for Sensitive Groups) | 60 (Unhealthy for Sensitive Groups) | 60 (Unhealthy for Sensitive Groups) | 31 (Moderate) | 30 (Moderate) | 31 (Moderate) | 35 (Moderate) | 54 (Unhealthy for Sensitive Groups) | 63 (Unhealthy for Sensitive Groups) | 66 (Unhealthy for Sensitive Groups) | 59 (Unhealthy for Sensitive Groups) |
| so2 | 7 (Good) | 7.2 (Good) | 11 (Good) | 22 (Good) | 20 (Good) | 15 (Good) | 11 (Good) | 13 (Good) | 15 (Good) | 15 (Good) | 14 (Good) | 13 (Good) | 6.8 (Good) | 8.1 (Good) | 10 (Good) | - (Good) |
PM10 179 (Very bad Hazardous)
particulate matter (PM10) suspended dustPM2,5 35 (Unhealthy for Sensitive Groups)
particulate matter (PM2.5) dustO3 0.04 (Good)
ozone (O3)NO2 0 (Good)
nitrogen dioxide (NO2)SO2 0 (Good)
sulfur dioxide (SO2)社会福利院
| index | 2022-05-27 |
|---|---|
| pm10 | 56 |
| pm25 | 56 |
| o3 | 0.03 |
| no2 | 0 |
| so2 | 0 |
社会福利院

| index | 2020-05 | 2020-04 | 2020-03 | 2020-02 | 2020-01 | 2019-12 | 2019-11 | 2019-10 | 2019-09 | 2019-08 | 2019-07 | 2019-06 | 2019-01 | 2018-12 | 2018-11 | 2018-10 |
|---|---|---|---|---|---|---|---|---|---|---|---|---|---|---|---|---|
| pm25 | 28 | 34 | 27 | 30 | 59 | 52 | 31 | 36 | 19 | 21 | 23 | 24 | 37 | 37 | 46 | 35 |
| co | 1 | 1 | 1 | 1 | 1 | 855 | 892 | 897 | 795 | 772 | 523 | 950 | 817 | 785 | 962 | 784 |
| no2 | 21 | 23 | 29 | 24 | 19 | 43 | 11 | 15 | 14 | 16 | 17 | 15 | 16 | 25 | 25 | 25 |
| o3 | 157 | 144 | 127 | 95 | 64 | 71 | 109 | 131 | 120 | 153 | 161 | 136 | 81 | 80 | 111 | 131 |
| pm10 | 53 | 61 | 50 | 43 | 76 | 77 | 60 | 60 | 31 | 30 | 31 | 35 | 54 | 63 | 66 | 59 |
| so2 | 7 | 7.2 | 11 | 22 | 20 | 15 | 11 | 13 | 15 | 15 | 14 | 13 | 6.8 | 8.1 | 10 | - |