Air Pollution in Liuzhuang: Real-time Air Quality Index and smog alert.
Pollution and air quality forecast for Liuzhuang. Today is Tuesday, June 2, 2026. The following air pollution values have been recorded for Liuzhuang:- particulate matter (PM10) suspended dust - 179 (Very bad Hazardous)
- particulate matter (PM2.5) dust - 35 (Unhealthy for Sensitive Groups)
- ozone (O3) - 0 (Good)
- nitrogen dioxide (NO2) - 0 (Good)
- sulfur dioxide (SO2) - 0 (Good)

What is the air quality in Liuzhuang today? Is the air polluted in Liuzhuang?. Is there smog?
What is the level of PM10 today in Liuzhuang? (particulate matter (PM10) suspended dust)
The current level of particulate matter PM10 in Liuzhuang is:
179 (Very bad Hazardous)
The highest PM10 values usually occur in month: 102 (January 2019).
The lowest value of particulate matter PM10 pollution in Liuzhuang is usually recorded in: August (37).
What is the current level of PM2.5 in Liuzhuang? (particulate matter (PM2.5) dust)
Today's PM2.5 level is:
35 (Unhealthy for Sensitive Groups)
For comparison, the highest level of PM2.5 in Liuzhuang in the last 7 days was: 56 (Friday, May 27, 2022) and the lowest: 56 (Friday, May 27, 2022).
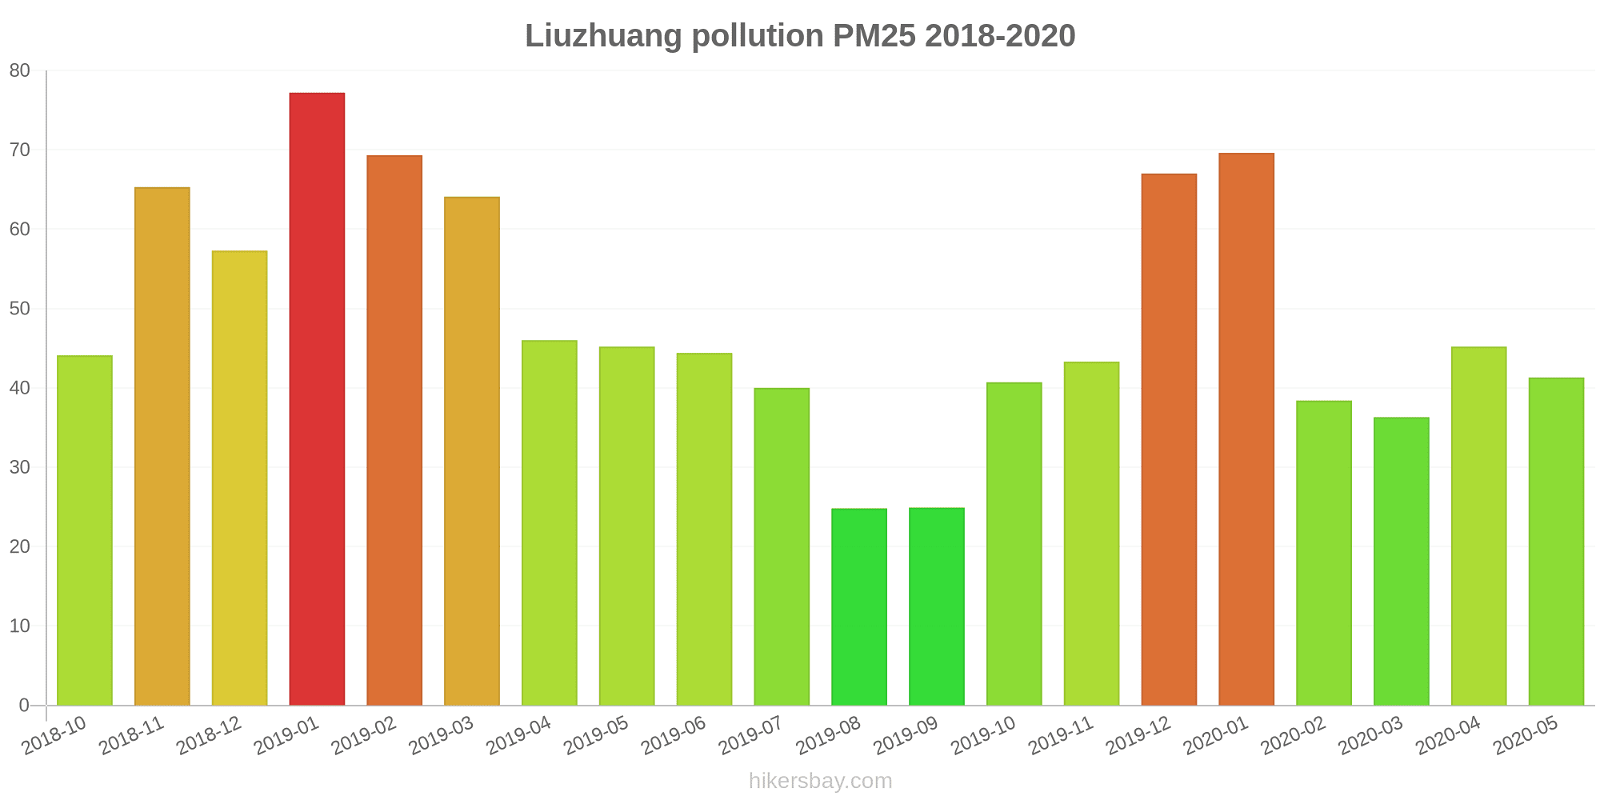
The highest PM2.5 values were recorded: 77 (January 2019).
The lowest level of particulate matter PM2.5 pollution occurs in month: August (25).
How is the O3 level today in Liuzhuang? (ozone (O3))
0 (Good)
How high is the level of NO2? (nitrogen dioxide (NO2))
0 (Good)
What is the level of SO2 pollution? (sulfur dioxide (SO2))
0 (Good)
Current data Friday, May 27, 2022, 12:00 PM
PM10 179 (Very bad Hazardous)
PM2,5 35 (Unhealthy for Sensitive Groups)
O3 0 (Good)
NO2 0 (Good)
SO2 0 (Good)
Data on air pollution from recent days in Liuzhuang
index
2022-05-27
pm10
56
Unhealthy for Sensitive Groups
pm25
56
Unhealthy
o3
0
Good
no2
0
Good
so2
0
Good
data source »
Air pollution in Liuzhuang from October 2018 to May 2020
index
2020-05
2020-04
2020-03
2020-02
2020-01
2019-12
2019-11
2019-10
2019-09
2019-08
2019-07
2019-06
2019-05
2019-04
2019-03
2019-02
2019-01
2018-12
2018-11
2018-10
pm25
41 (Unhealthy for Sensitive Groups)
45 (Unhealthy for Sensitive Groups)
36 (Unhealthy for Sensitive Groups)
38 (Unhealthy for Sensitive Groups)
70 (Unhealthy)
67 (Unhealthy)
43 (Unhealthy for Sensitive Groups)
41 (Unhealthy for Sensitive Groups)
25 (Moderate)
25 (Moderate)
40 (Unhealthy for Sensitive Groups)
44 (Unhealthy for Sensitive Groups)
45 (Unhealthy for Sensitive Groups)
46 (Unhealthy for Sensitive Groups)
64 (Unhealthy)
69 (Unhealthy)
77 (Very Unhealthy)
57 (Unhealthy)
65 (Unhealthy)
44 (Unhealthy for Sensitive Groups)
co
907 (Good)
698 (Good)
657 (Good)
787 (Good)
1 (Good)
854 (Good)
604 (Good)
742 (Good)
605 (Good)
586 (Good)
677 (Good)
622 (Good)
599 (Good)
692 (Good)
787 (Good)
841 (Good)
930 (Good)
788 (Good)
889 (Good)
686 (Good)
no2
16 (Good)
25 (Good)
24 (Good)
14 (Good)
23 (Good)
40 (Good)
36 (Good)
31 (Good)
16 (Good)
20 (Good)
19 (Good)
20 (Good)
31 (Good)
28 (Good)
34 (Good)
24 (Good)
35 (Good)
33 (Good)
29 (Good)
29 (Good)
o3
150 (Unhealthy)
153 (Unhealthy)
124 (Unhealthy for Sensitive Groups)
94 (Moderate)
80 (Moderate)
72 (Moderate)
96 (Moderate)
111 (Moderate)
117 (Moderate)
143 (Unhealthy for Sensitive Groups)
153 (Unhealthy)
176 (Unhealthy)
157 (Unhealthy)
144 (Unhealthy for Sensitive Groups)
129 (Unhealthy for Sensitive Groups)
95 (Moderate)
63 (Good)
62 (Good)
96 (Moderate)
105 (Moderate)
pm10
54 (Unhealthy for Sensitive Groups)
68 (Unhealthy for Sensitive Groups)
58 (Unhealthy for Sensitive Groups)
53 (Unhealthy for Sensitive Groups)
82 (Unhealthy)
86 (Unhealthy)
87 (Unhealthy)
82 (Unhealthy)
43 (Moderate)
37 (Moderate)
52 (Unhealthy for Sensitive Groups)
59 (Unhealthy for Sensitive Groups)
73 (Unhealthy for Sensitive Groups)
65 (Unhealthy for Sensitive Groups)
92 (Unhealthy)
86 (Unhealthy)
102 (Unhealthy)
82 (Unhealthy)
88 (Unhealthy)
70 (Unhealthy for Sensitive Groups)
so2
5.2 (Good)
6.9 (Good)
6 (Good)
4.4 (Good)
5 (Good)
10 (Good)
9.9 (Good)
8.6 (Good)
6 (Good)
5.5 (Good)
4.2 (Good)
4.7 (Good)
8 (Good)
7 (Good)
8.7 (Good)
5.3 (Good)
6.7 (Good)
11 (Good)
8.3 (Good)
9.2 (Good)
data source »
莲花
Friday, May 27, 2022, 12:00 PM
PM10 179 (Very bad Hazardous)
particulate matter (PM10) suspended dust
PM2,5 35 (Unhealthy for Sensitive Groups)
particulate matter (PM2.5) dust
O3 0.04 (Good)
ozone (O3)
NO2 0 (Good)
nitrogen dioxide (NO2)
SO2 0 (Good)
sulfur dioxide (SO2)
莲花
index
2022-05-27
pm10
56
pm25
56
o3
0.03
no2
0
so2
0
莲花
2018-10 2020-05
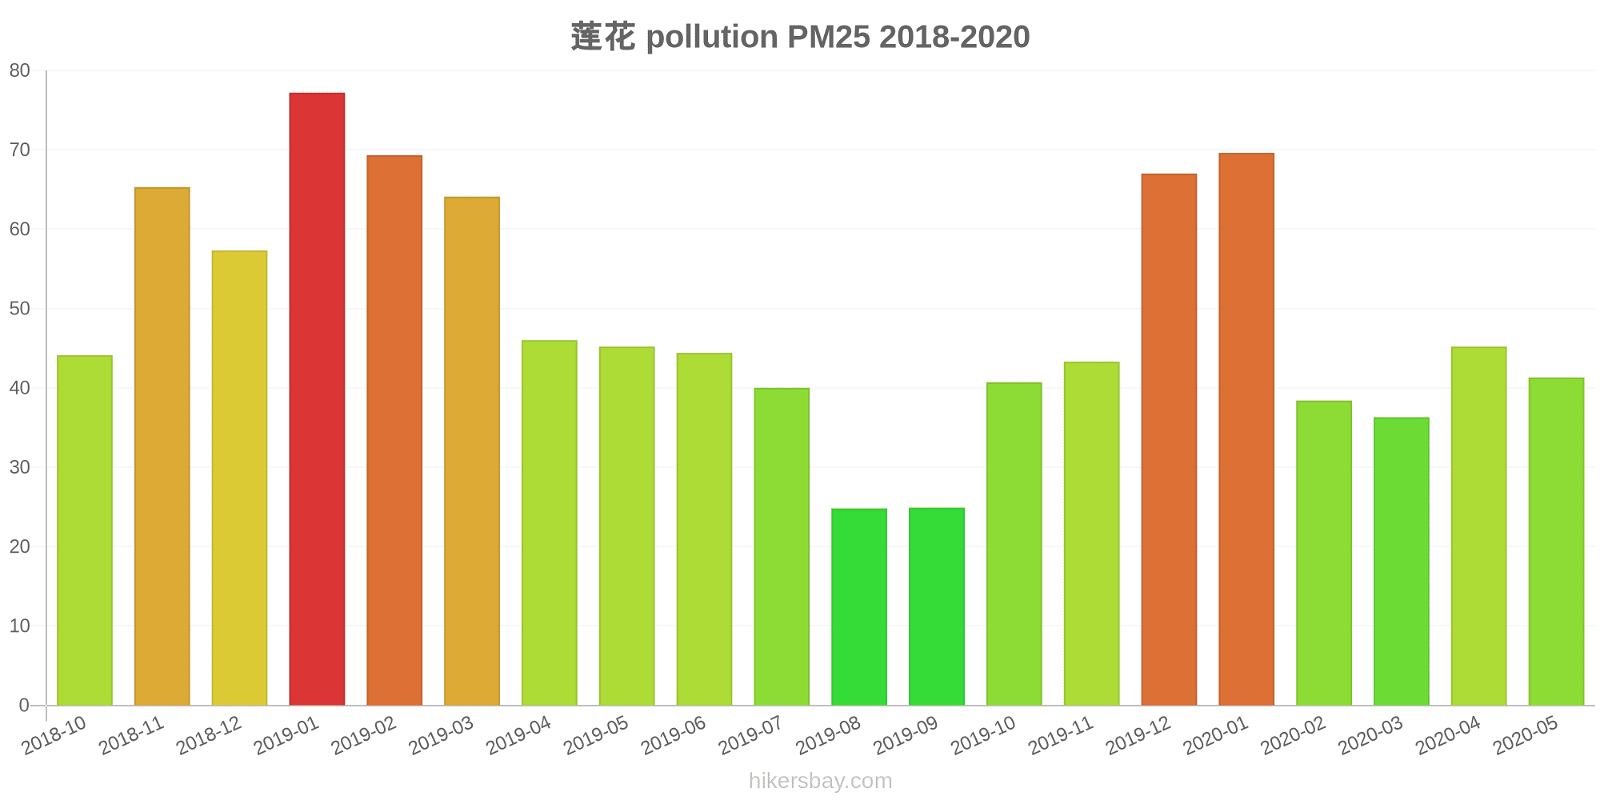
index
2020-05
2020-04
2020-03
2020-02
2020-01
2019-12
2019-11
2019-10
2019-09
2019-08
2019-07
2019-06
2019-05
2019-04
2019-03
2019-02
2019-01
2018-12
2018-11
2018-10
pm25
41
45
36
38
70
67
43
41
25
25
40
44
45
46
64
69
77
57
65
44
co
907
698
657
787
1
854
604
742
605
586
677
622
599
692
787
841
930
788
889
686
no2
16
25
24
14
23
40
36
31
16
20
19
20
31
28
34
24
35
33
29
29
o3
150
153
124
94
80
72
96
111
117
143
153
176
157
144
129
95
63
62
96
105
pm10
54
68
58
53
82
86
87
82
43
37
52
59
73
65
92
86
102
82
88
70
so2
5.2
6.9
6
4.4
5
10
9.9
8.6
6
5.5
4.2
4.7
8
7
8.7
5.3
6.7
11
8.3
9.2
* Pollution data source:
https://openaq.org
(ChinaAQIData)
The data is licensed under CC-By 4.0
PM10 179 (Very bad Hazardous)
PM2,5 35 (Unhealthy for Sensitive Groups)
O3 0 (Good)
NO2 0 (Good)
SO2 0 (Good)
Data on air pollution from recent days in Liuzhuang
| index | 2022-05-27 |
|---|---|
| pm10 | 56 Unhealthy for Sensitive Groups |
| pm25 | 56 Unhealthy |
| o3 | 0 Good |
| no2 | 0 Good |
| so2 | 0 Good |

| index | 2020-05 | 2020-04 | 2020-03 | 2020-02 | 2020-01 | 2019-12 | 2019-11 | 2019-10 | 2019-09 | 2019-08 | 2019-07 | 2019-06 | 2019-05 | 2019-04 | 2019-03 | 2019-02 | 2019-01 | 2018-12 | 2018-11 | 2018-10 |
|---|---|---|---|---|---|---|---|---|---|---|---|---|---|---|---|---|---|---|---|---|
| pm25 | 41 (Unhealthy for Sensitive Groups) | 45 (Unhealthy for Sensitive Groups) | 36 (Unhealthy for Sensitive Groups) | 38 (Unhealthy for Sensitive Groups) | 70 (Unhealthy) | 67 (Unhealthy) | 43 (Unhealthy for Sensitive Groups) | 41 (Unhealthy for Sensitive Groups) | 25 (Moderate) | 25 (Moderate) | 40 (Unhealthy for Sensitive Groups) | 44 (Unhealthy for Sensitive Groups) | 45 (Unhealthy for Sensitive Groups) | 46 (Unhealthy for Sensitive Groups) | 64 (Unhealthy) | 69 (Unhealthy) | 77 (Very Unhealthy) | 57 (Unhealthy) | 65 (Unhealthy) | 44 (Unhealthy for Sensitive Groups) |
| co | 907 (Good) | 698 (Good) | 657 (Good) | 787 (Good) | 1 (Good) | 854 (Good) | 604 (Good) | 742 (Good) | 605 (Good) | 586 (Good) | 677 (Good) | 622 (Good) | 599 (Good) | 692 (Good) | 787 (Good) | 841 (Good) | 930 (Good) | 788 (Good) | 889 (Good) | 686 (Good) |
| no2 | 16 (Good) | 25 (Good) | 24 (Good) | 14 (Good) | 23 (Good) | 40 (Good) | 36 (Good) | 31 (Good) | 16 (Good) | 20 (Good) | 19 (Good) | 20 (Good) | 31 (Good) | 28 (Good) | 34 (Good) | 24 (Good) | 35 (Good) | 33 (Good) | 29 (Good) | 29 (Good) |
| o3 | 150 (Unhealthy) | 153 (Unhealthy) | 124 (Unhealthy for Sensitive Groups) | 94 (Moderate) | 80 (Moderate) | 72 (Moderate) | 96 (Moderate) | 111 (Moderate) | 117 (Moderate) | 143 (Unhealthy for Sensitive Groups) | 153 (Unhealthy) | 176 (Unhealthy) | 157 (Unhealthy) | 144 (Unhealthy for Sensitive Groups) | 129 (Unhealthy for Sensitive Groups) | 95 (Moderate) | 63 (Good) | 62 (Good) | 96 (Moderate) | 105 (Moderate) |
| pm10 | 54 (Unhealthy for Sensitive Groups) | 68 (Unhealthy for Sensitive Groups) | 58 (Unhealthy for Sensitive Groups) | 53 (Unhealthy for Sensitive Groups) | 82 (Unhealthy) | 86 (Unhealthy) | 87 (Unhealthy) | 82 (Unhealthy) | 43 (Moderate) | 37 (Moderate) | 52 (Unhealthy for Sensitive Groups) | 59 (Unhealthy for Sensitive Groups) | 73 (Unhealthy for Sensitive Groups) | 65 (Unhealthy for Sensitive Groups) | 92 (Unhealthy) | 86 (Unhealthy) | 102 (Unhealthy) | 82 (Unhealthy) | 88 (Unhealthy) | 70 (Unhealthy for Sensitive Groups) |
| so2 | 5.2 (Good) | 6.9 (Good) | 6 (Good) | 4.4 (Good) | 5 (Good) | 10 (Good) | 9.9 (Good) | 8.6 (Good) | 6 (Good) | 5.5 (Good) | 4.2 (Good) | 4.7 (Good) | 8 (Good) | 7 (Good) | 8.7 (Good) | 5.3 (Good) | 6.7 (Good) | 11 (Good) | 8.3 (Good) | 9.2 (Good) |
PM10 179 (Very bad Hazardous)
particulate matter (PM10) suspended dustPM2,5 35 (Unhealthy for Sensitive Groups)
particulate matter (PM2.5) dustO3 0.04 (Good)
ozone (O3)NO2 0 (Good)
nitrogen dioxide (NO2)SO2 0 (Good)
sulfur dioxide (SO2)莲花
| index | 2022-05-27 |
|---|---|
| pm10 | 56 |
| pm25 | 56 |
| o3 | 0.03 |
| no2 | 0 |
| so2 | 0 |
莲花

| index | 2020-05 | 2020-04 | 2020-03 | 2020-02 | 2020-01 | 2019-12 | 2019-11 | 2019-10 | 2019-09 | 2019-08 | 2019-07 | 2019-06 | 2019-05 | 2019-04 | 2019-03 | 2019-02 | 2019-01 | 2018-12 | 2018-11 | 2018-10 |
|---|---|---|---|---|---|---|---|---|---|---|---|---|---|---|---|---|---|---|---|---|
| pm25 | 41 | 45 | 36 | 38 | 70 | 67 | 43 | 41 | 25 | 25 | 40 | 44 | 45 | 46 | 64 | 69 | 77 | 57 | 65 | 44 |
| co | 907 | 698 | 657 | 787 | 1 | 854 | 604 | 742 | 605 | 586 | 677 | 622 | 599 | 692 | 787 | 841 | 930 | 788 | 889 | 686 |
| no2 | 16 | 25 | 24 | 14 | 23 | 40 | 36 | 31 | 16 | 20 | 19 | 20 | 31 | 28 | 34 | 24 | 35 | 33 | 29 | 29 |
| o3 | 150 | 153 | 124 | 94 | 80 | 72 | 96 | 111 | 117 | 143 | 153 | 176 | 157 | 144 | 129 | 95 | 63 | 62 | 96 | 105 |
| pm10 | 54 | 68 | 58 | 53 | 82 | 86 | 87 | 82 | 43 | 37 | 52 | 59 | 73 | 65 | 92 | 86 | 102 | 82 | 88 | 70 |
| so2 | 5.2 | 6.9 | 6 | 4.4 | 5 | 10 | 9.9 | 8.6 | 6 | 5.5 | 4.2 | 4.7 | 8 | 7 | 8.7 | 5.3 | 6.7 | 11 | 8.3 | 9.2 |