Air Pollution in Dongshengcun: Real-time Air Quality Index and smog alert.
Pollution and air quality forecast for Dongshengcun. Today is Tuesday, June 2, 2026. The following air pollution values have been recorded for Dongshengcun:- particulate matter (PM10) suspended dust - 179 (Very bad Hazardous)
- particulate matter (PM2.5) dust - 35 (Unhealthy for Sensitive Groups)
- ozone (O3) - 0 (Good)
- nitrogen dioxide (NO2) - 0 (Good)
- sulfur dioxide (SO2) - 0 (Good)

What is the air quality in Dongshengcun today? Is the air polluted in Dongshengcun?. Is there smog?
What is the level of PM10 today in Dongshengcun? (particulate matter (PM10) suspended dust)
The current level of particulate matter PM10 in Dongshengcun is:
179 (Very bad Hazardous)
The highest PM10 values usually occur in month: 177 (November 2018).
The lowest value of particulate matter PM10 pollution in Dongshengcun is usually recorded in: July (50).
What is the current level of PM2.5 in Dongshengcun? (particulate matter (PM2.5) dust)
Today's PM2.5 level is:
35 (Unhealthy for Sensitive Groups)
For comparison, the highest level of PM2.5 in Dongshengcun in the last 7 days was: 56 (Friday, May 27, 2022) and the lowest: 56 (Friday, May 27, 2022).
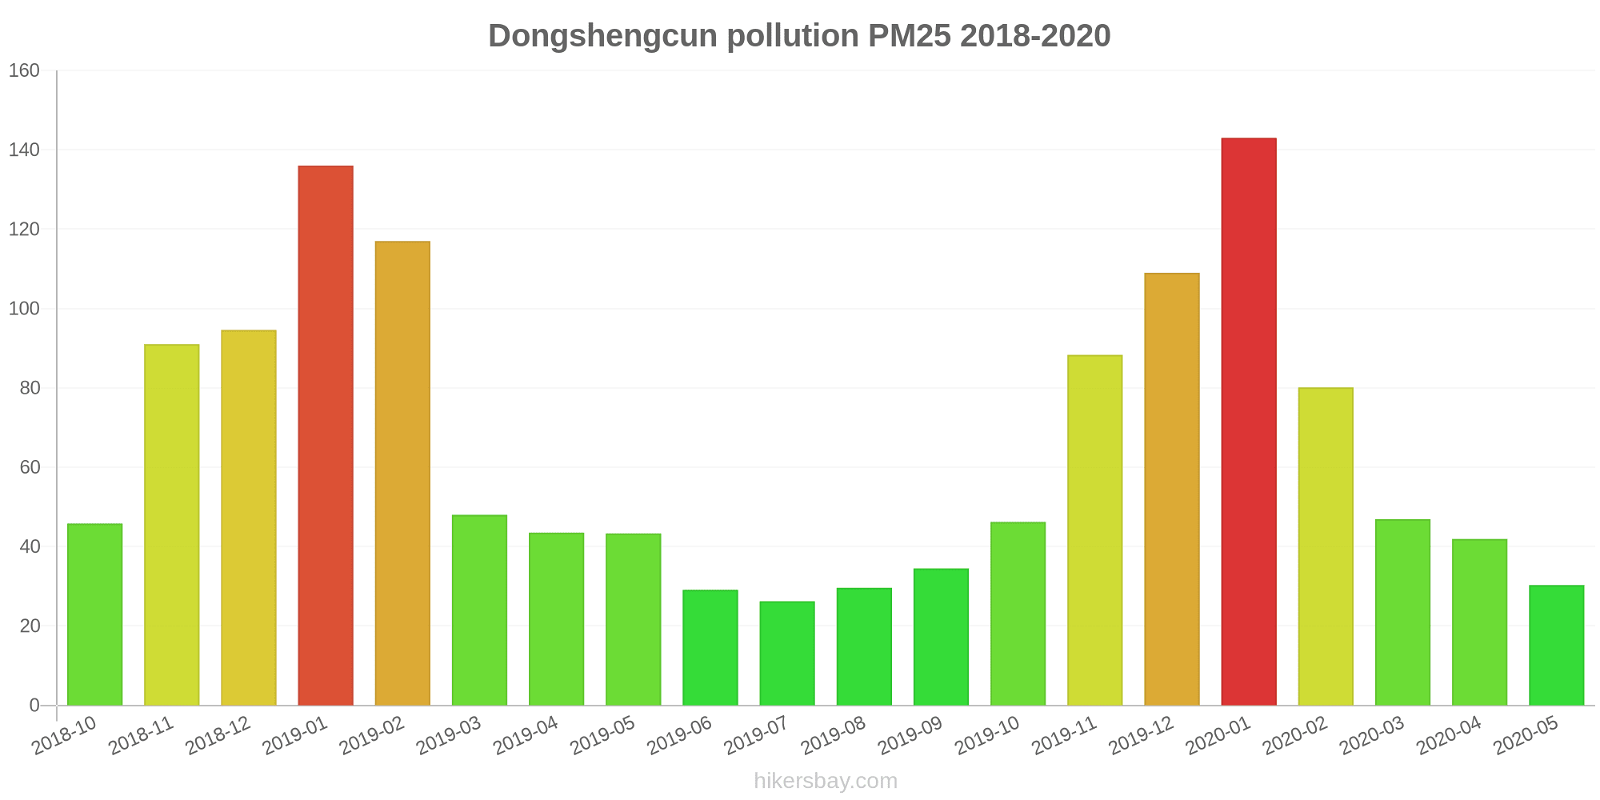
The highest PM2.5 values were recorded: 143 (January 2020).
The lowest level of particulate matter PM2.5 pollution occurs in month: July (26).
How is the O3 level today in Dongshengcun? (ozone (O3))
0 (Good)
How high is the level of NO2? (nitrogen dioxide (NO2))
0 (Good)
What is the level of SO2 pollution? (sulfur dioxide (SO2))
0 (Good)
Current data Friday, May 27, 2022, 12:00 PM
PM10 179 (Very bad Hazardous)
PM2,5 35 (Unhealthy for Sensitive Groups)
O3 0 (Good)
NO2 0 (Good)
SO2 0 (Good)
Data on air pollution from recent days in Dongshengcun
index
2022-05-27
pm10
56
Unhealthy for Sensitive Groups
pm25
56
Unhealthy
o3
0
Good
no2
0
Good
so2
0
Good
data source »
Air pollution in Dongshengcun from October 2018 to May 2020
index
2020-05
2020-04
2020-03
2020-02
2020-01
2019-12
2019-11
2019-10
2019-09
2019-08
2019-07
2019-06
2019-05
2019-04
2019-03
2019-02
2019-01
2018-12
2018-11
2018-10
pm25
30 (Moderate)
42 (Unhealthy for Sensitive Groups)
47 (Unhealthy for Sensitive Groups)
80 (Very Unhealthy)
143 (Very bad Hazardous)
109 (Very Unhealthy)
88 (Very Unhealthy)
46 (Unhealthy for Sensitive Groups)
35 (Moderate)
30 (Moderate)
26 (Moderate)
29 (Moderate)
43 (Unhealthy for Sensitive Groups)
44 (Unhealthy for Sensitive Groups)
48 (Unhealthy for Sensitive Groups)
117 (Very bad Hazardous)
136 (Very bad Hazardous)
95 (Very Unhealthy)
91 (Very Unhealthy)
46 (Unhealthy for Sensitive Groups)
co
562 (Good)
618 (Good)
587 (Good)
860 (Good)
1 (Good)
1 (Good)
996 (Good)
794 (Good)
693 (Good)
725 (Good)
564 (Good)
573 (Good)
509 (Good)
794 (Good)
761 (Good)
1 (Good)
1 (Good)
1 (Good)
1 (Good)
1 (Good)
no2
38 (Good)
57 (Moderate)
50 (Moderate)
29 (Good)
48 (Moderate)
70 (Moderate)
64 (Moderate)
52 (Moderate)
44 (Moderate)
33 (Good)
34 (Good)
36 (Good)
46 (Moderate)
49 (Moderate)
63 (Moderate)
44 (Moderate)
70 (Moderate)
69 (Moderate)
74 (Moderate)
67 (Moderate)
o3
143 (Unhealthy for Sensitive Groups)
127 (Unhealthy for Sensitive Groups)
105 (Moderate)
109 (Moderate)
67 (Good)
55 (Good)
55 (Good)
76 (Moderate)
137 (Unhealthy for Sensitive Groups)
175 (Unhealthy)
180 (Very Unhealthy)
172 (Unhealthy)
142 (Unhealthy for Sensitive Groups)
125 (Unhealthy for Sensitive Groups)
78 (Moderate)
72 (Moderate)
47 (Good)
40 (Good)
53 (Good)
94 (Moderate)
pm10
82 (Unhealthy)
93 (Unhealthy)
108 (Unhealthy)
97 (Unhealthy)
139 (Very Unhealthy)
148 (Very Unhealthy)
133 (Very Unhealthy)
83 (Unhealthy)
58 (Unhealthy for Sensitive Groups)
51 (Unhealthy for Sensitive Groups)
50 (Moderate)
52 (Unhealthy for Sensitive Groups)
113 (Very Unhealthy)
111 (Very Unhealthy)
121 (Very Unhealthy)
152 (Very bad Hazardous)
162 (Very bad Hazardous)
174 (Very bad Hazardous)
177 (Very bad Hazardous)
106 (Unhealthy)
so2
7.4 (Good)
10 (Good)
9.8 (Good)
12 (Good)
14 (Good)
16 (Good)
11 (Good)
7.1 (Good)
5.7 (Good)
5 (Good)
4.2 (Good)
3.7 (Good)
4.8 (Good)
5 (Good)
5.9 (Good)
6.5 (Good)
13 (Good)
20 (Good)
16 (Good)
12 (Good)
data source »
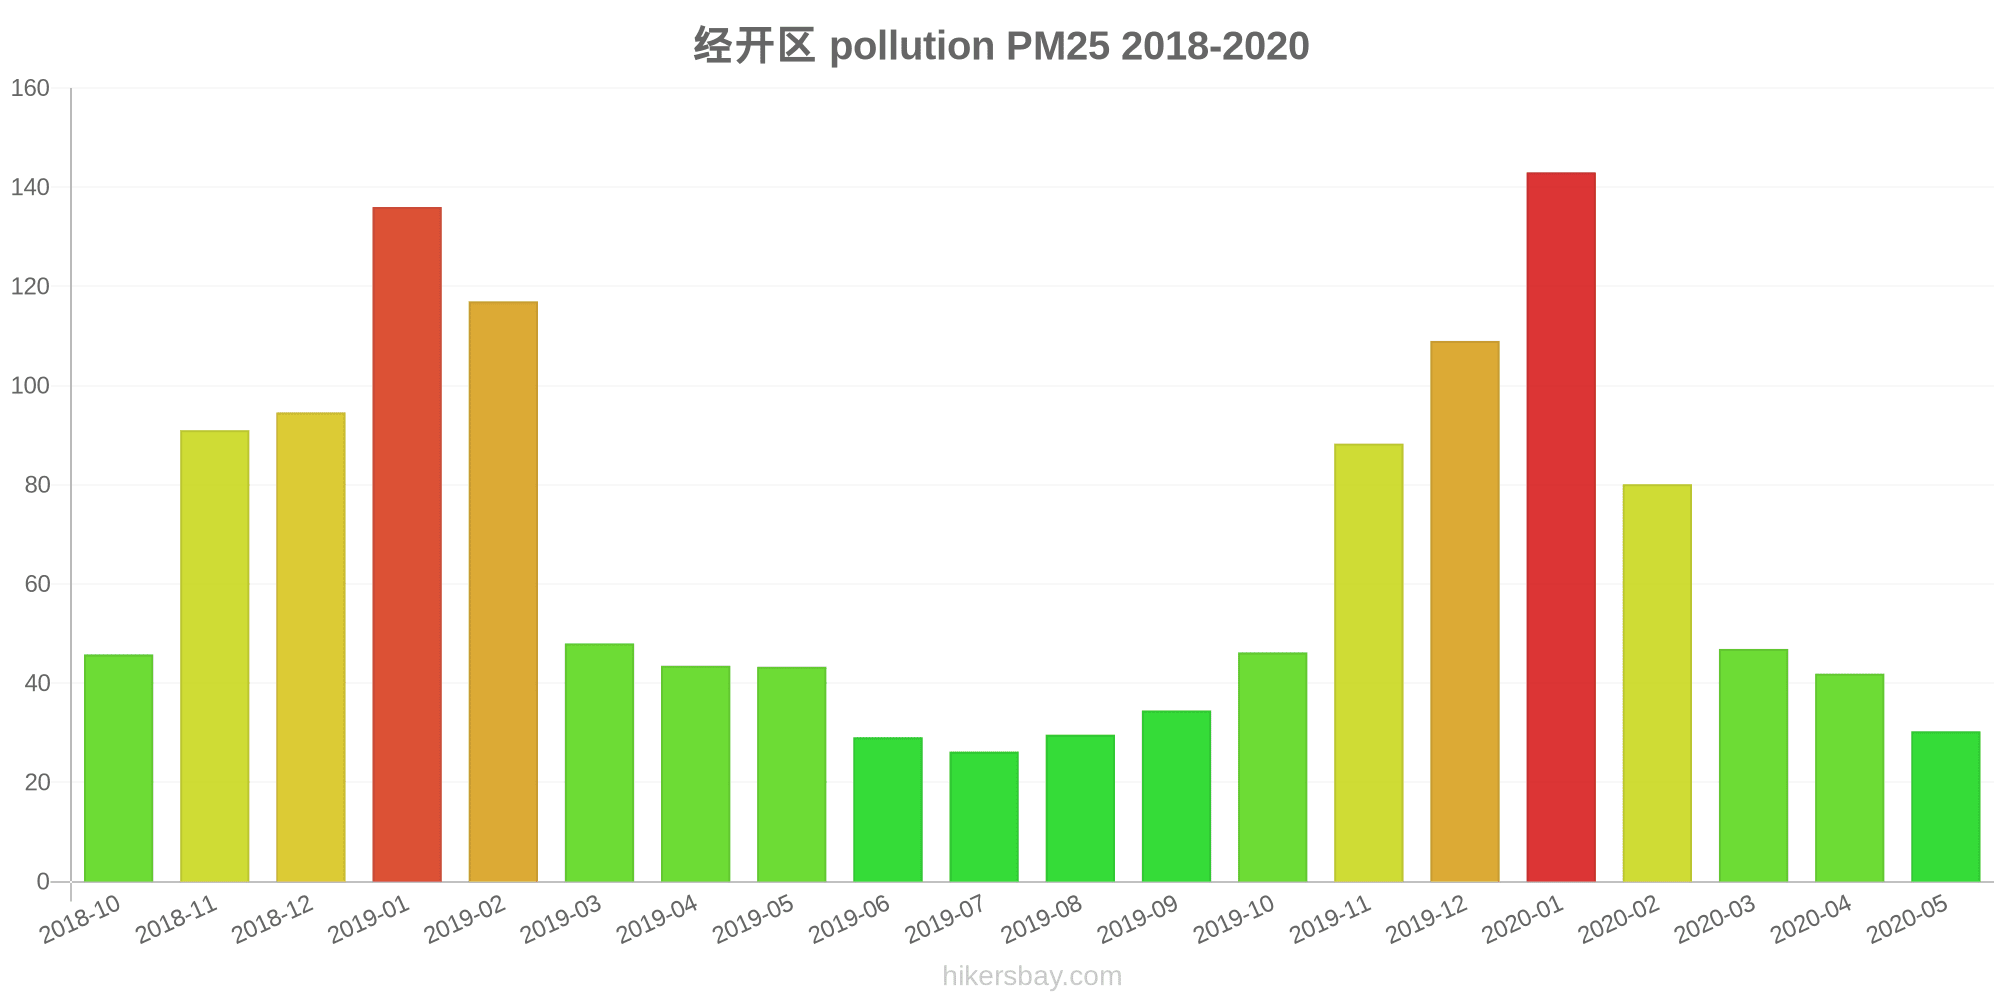
经开区
Friday, May 27, 2022, 12:00 PM
PM10 179 (Very bad Hazardous)
particulate matter (PM10) suspended dust
PM2,5 35 (Unhealthy for Sensitive Groups)
particulate matter (PM2.5) dust
O3 0.04 (Good)
ozone (O3)
NO2 0 (Good)
nitrogen dioxide (NO2)
SO2 0 (Good)
sulfur dioxide (SO2)
经开区
index
2022-05-27
pm10
56
pm25
56
o3
0.03
no2
0
so2
0
经开区
2018-10 2020-05

index
2020-05
2020-04
2020-03
2020-02
2020-01
2019-12
2019-11
2019-10
2019-09
2019-08
2019-07
2019-06
2019-05
2019-04
2019-03
2019-02
2019-01
2018-12
2018-11
2018-10
pm25
30
42
47
80
143
109
88
46
35
30
26
29
43
44
48
117
136
95
91
46
co
562
618
587
860
1
1
996
794
693
725
564
573
509
794
761
1
1
1
1
1
no2
38
57
50
29
48
70
64
52
44
33
34
36
46
49
63
44
70
69
74
67
o3
143
127
105
109
67
55
55
76
137
175
180
172
142
125
78
72
47
40
53
94
pm10
82
93
108
97
139
148
133
83
58
51
50
52
113
111
121
152
162
174
177
106
so2
7.4
10
9.8
12
14
16
11
7.1
5.7
5
4.2
3.7
4.8
5
5.9
6.5
13
20
16
12
* Pollution data source:
https://openaq.org
(ChinaAQIData)
The data is licensed under CC-By 4.0
PM10 179 (Very bad Hazardous)
PM2,5 35 (Unhealthy for Sensitive Groups)
O3 0 (Good)
NO2 0 (Good)
SO2 0 (Good)
Data on air pollution from recent days in Dongshengcun
| index | 2022-05-27 |
|---|---|
| pm10 | 56 Unhealthy for Sensitive Groups |
| pm25 | 56 Unhealthy |
| o3 | 0 Good |
| no2 | 0 Good |
| so2 | 0 Good |

| index | 2020-05 | 2020-04 | 2020-03 | 2020-02 | 2020-01 | 2019-12 | 2019-11 | 2019-10 | 2019-09 | 2019-08 | 2019-07 | 2019-06 | 2019-05 | 2019-04 | 2019-03 | 2019-02 | 2019-01 | 2018-12 | 2018-11 | 2018-10 |
|---|---|---|---|---|---|---|---|---|---|---|---|---|---|---|---|---|---|---|---|---|
| pm25 | 30 (Moderate) | 42 (Unhealthy for Sensitive Groups) | 47 (Unhealthy for Sensitive Groups) | 80 (Very Unhealthy) | 143 (Very bad Hazardous) | 109 (Very Unhealthy) | 88 (Very Unhealthy) | 46 (Unhealthy for Sensitive Groups) | 35 (Moderate) | 30 (Moderate) | 26 (Moderate) | 29 (Moderate) | 43 (Unhealthy for Sensitive Groups) | 44 (Unhealthy for Sensitive Groups) | 48 (Unhealthy for Sensitive Groups) | 117 (Very bad Hazardous) | 136 (Very bad Hazardous) | 95 (Very Unhealthy) | 91 (Very Unhealthy) | 46 (Unhealthy for Sensitive Groups) |
| co | 562 (Good) | 618 (Good) | 587 (Good) | 860 (Good) | 1 (Good) | 1 (Good) | 996 (Good) | 794 (Good) | 693 (Good) | 725 (Good) | 564 (Good) | 573 (Good) | 509 (Good) | 794 (Good) | 761 (Good) | 1 (Good) | 1 (Good) | 1 (Good) | 1 (Good) | 1 (Good) |
| no2 | 38 (Good) | 57 (Moderate) | 50 (Moderate) | 29 (Good) | 48 (Moderate) | 70 (Moderate) | 64 (Moderate) | 52 (Moderate) | 44 (Moderate) | 33 (Good) | 34 (Good) | 36 (Good) | 46 (Moderate) | 49 (Moderate) | 63 (Moderate) | 44 (Moderate) | 70 (Moderate) | 69 (Moderate) | 74 (Moderate) | 67 (Moderate) |
| o3 | 143 (Unhealthy for Sensitive Groups) | 127 (Unhealthy for Sensitive Groups) | 105 (Moderate) | 109 (Moderate) | 67 (Good) | 55 (Good) | 55 (Good) | 76 (Moderate) | 137 (Unhealthy for Sensitive Groups) | 175 (Unhealthy) | 180 (Very Unhealthy) | 172 (Unhealthy) | 142 (Unhealthy for Sensitive Groups) | 125 (Unhealthy for Sensitive Groups) | 78 (Moderate) | 72 (Moderate) | 47 (Good) | 40 (Good) | 53 (Good) | 94 (Moderate) |
| pm10 | 82 (Unhealthy) | 93 (Unhealthy) | 108 (Unhealthy) | 97 (Unhealthy) | 139 (Very Unhealthy) | 148 (Very Unhealthy) | 133 (Very Unhealthy) | 83 (Unhealthy) | 58 (Unhealthy for Sensitive Groups) | 51 (Unhealthy for Sensitive Groups) | 50 (Moderate) | 52 (Unhealthy for Sensitive Groups) | 113 (Very Unhealthy) | 111 (Very Unhealthy) | 121 (Very Unhealthy) | 152 (Very bad Hazardous) | 162 (Very bad Hazardous) | 174 (Very bad Hazardous) | 177 (Very bad Hazardous) | 106 (Unhealthy) |
| so2 | 7.4 (Good) | 10 (Good) | 9.8 (Good) | 12 (Good) | 14 (Good) | 16 (Good) | 11 (Good) | 7.1 (Good) | 5.7 (Good) | 5 (Good) | 4.2 (Good) | 3.7 (Good) | 4.8 (Good) | 5 (Good) | 5.9 (Good) | 6.5 (Good) | 13 (Good) | 20 (Good) | 16 (Good) | 12 (Good) |
PM10 179 (Very bad Hazardous)
particulate matter (PM10) suspended dustPM2,5 35 (Unhealthy for Sensitive Groups)
particulate matter (PM2.5) dustO3 0.04 (Good)
ozone (O3)NO2 0 (Good)
nitrogen dioxide (NO2)SO2 0 (Good)
sulfur dioxide (SO2)经开区
| index | 2022-05-27 |
|---|---|
| pm10 | 56 |
| pm25 | 56 |
| o3 | 0.03 |
| no2 | 0 |
| so2 | 0 |
经开区
| index | 2020-05 | 2020-04 | 2020-03 | 2020-02 | 2020-01 | 2019-12 | 2019-11 | 2019-10 | 2019-09 | 2019-08 | 2019-07 | 2019-06 | 2019-05 | 2019-04 | 2019-03 | 2019-02 | 2019-01 | 2018-12 | 2018-11 | 2018-10 |
|---|---|---|---|---|---|---|---|---|---|---|---|---|---|---|---|---|---|---|---|---|
| pm25 | 30 | 42 | 47 | 80 | 143 | 109 | 88 | 46 | 35 | 30 | 26 | 29 | 43 | 44 | 48 | 117 | 136 | 95 | 91 | 46 |
| co | 562 | 618 | 587 | 860 | 1 | 1 | 996 | 794 | 693 | 725 | 564 | 573 | 509 | 794 | 761 | 1 | 1 | 1 | 1 | 1 |
| no2 | 38 | 57 | 50 | 29 | 48 | 70 | 64 | 52 | 44 | 33 | 34 | 36 | 46 | 49 | 63 | 44 | 70 | 69 | 74 | 67 |
| o3 | 143 | 127 | 105 | 109 | 67 | 55 | 55 | 76 | 137 | 175 | 180 | 172 | 142 | 125 | 78 | 72 | 47 | 40 | 53 | 94 |
| pm10 | 82 | 93 | 108 | 97 | 139 | 148 | 133 | 83 | 58 | 51 | 50 | 52 | 113 | 111 | 121 | 152 | 162 | 174 | 177 | 106 |
| so2 | 7.4 | 10 | 9.8 | 12 | 14 | 16 | 11 | 7.1 | 5.7 | 5 | 4.2 | 3.7 | 4.8 | 5 | 5.9 | 6.5 | 13 | 20 | 16 | 12 |