Air Pollution in Zhangjiacun: Real-time Air Quality Index and smog alert.
Pollution and air quality forecast for Zhangjiacun. Today is Tuesday, June 2, 2026. The following air pollution values have been recorded for Zhangjiacun:- particulate matter (PM10) suspended dust - 179 (Very bad Hazardous)
- particulate matter (PM2.5) dust - 35 (Unhealthy for Sensitive Groups)
- ozone (O3) - 0 (Good)
- nitrogen dioxide (NO2) - 0 (Good)
- sulfur dioxide (SO2) - 0 (Good)

What is the air quality in Zhangjiacun today? Is the air polluted in Zhangjiacun?. Is there smog?
What is the level of PM10 today in Zhangjiacun? (particulate matter (PM10) suspended dust)
The current level of particulate matter PM10 in Zhangjiacun is:
179 (Very bad Hazardous)
The highest PM10 values usually occur in month: 101 (March 2019).
The lowest value of particulate matter PM10 pollution in Zhangjiacun is usually recorded in: August (42).
What is the current level of PM2.5 in Zhangjiacun? (particulate matter (PM2.5) dust)
Today's PM2.5 level is:
35 (Unhealthy for Sensitive Groups)
For comparison, the highest level of PM2.5 in Zhangjiacun in the last 7 days was: 56 (Friday, May 27, 2022) and the lowest: 56 (Friday, May 27, 2022).
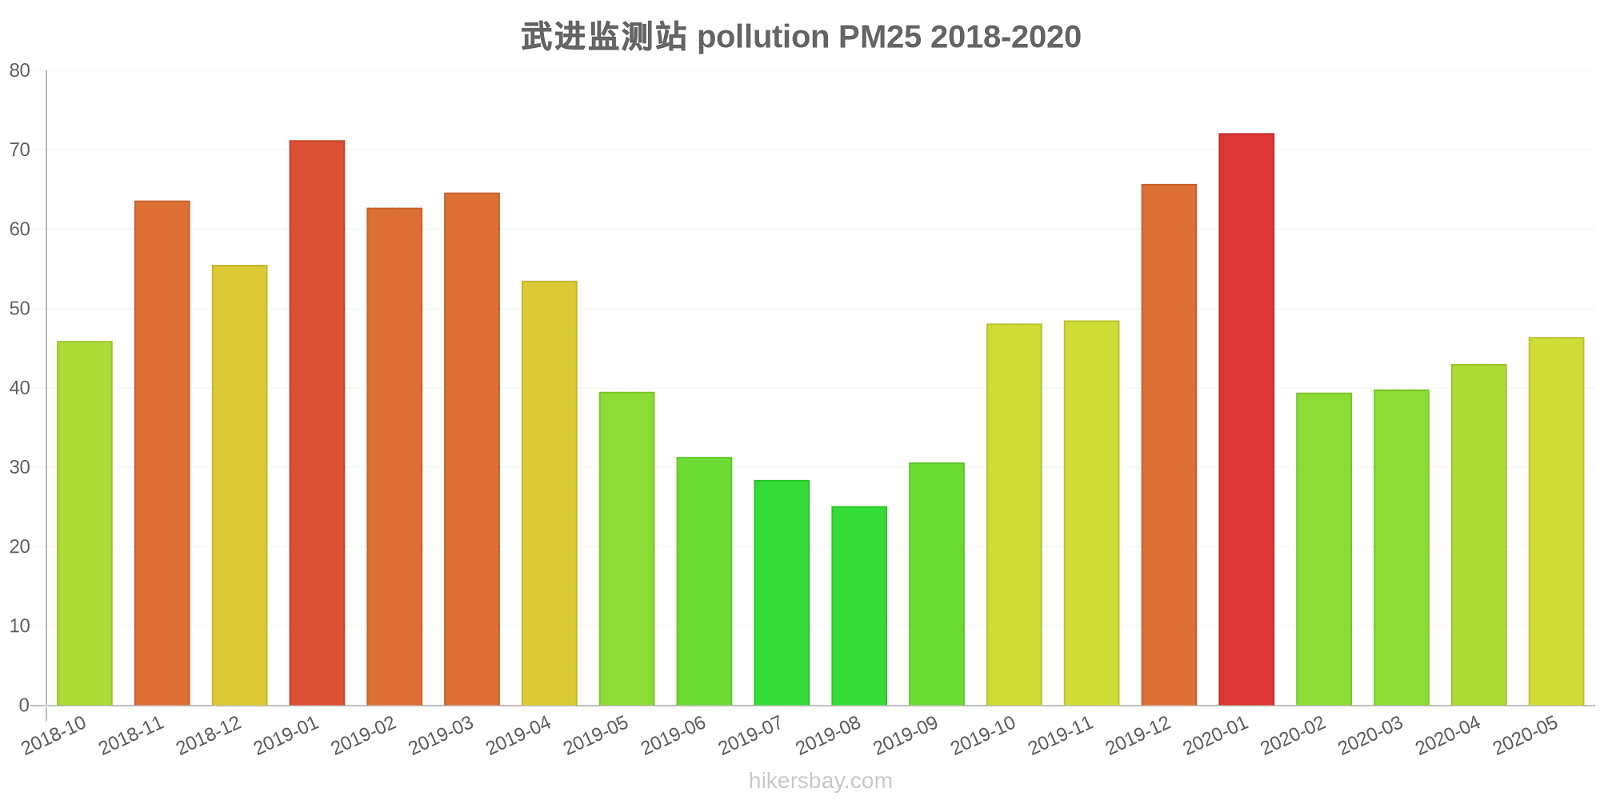
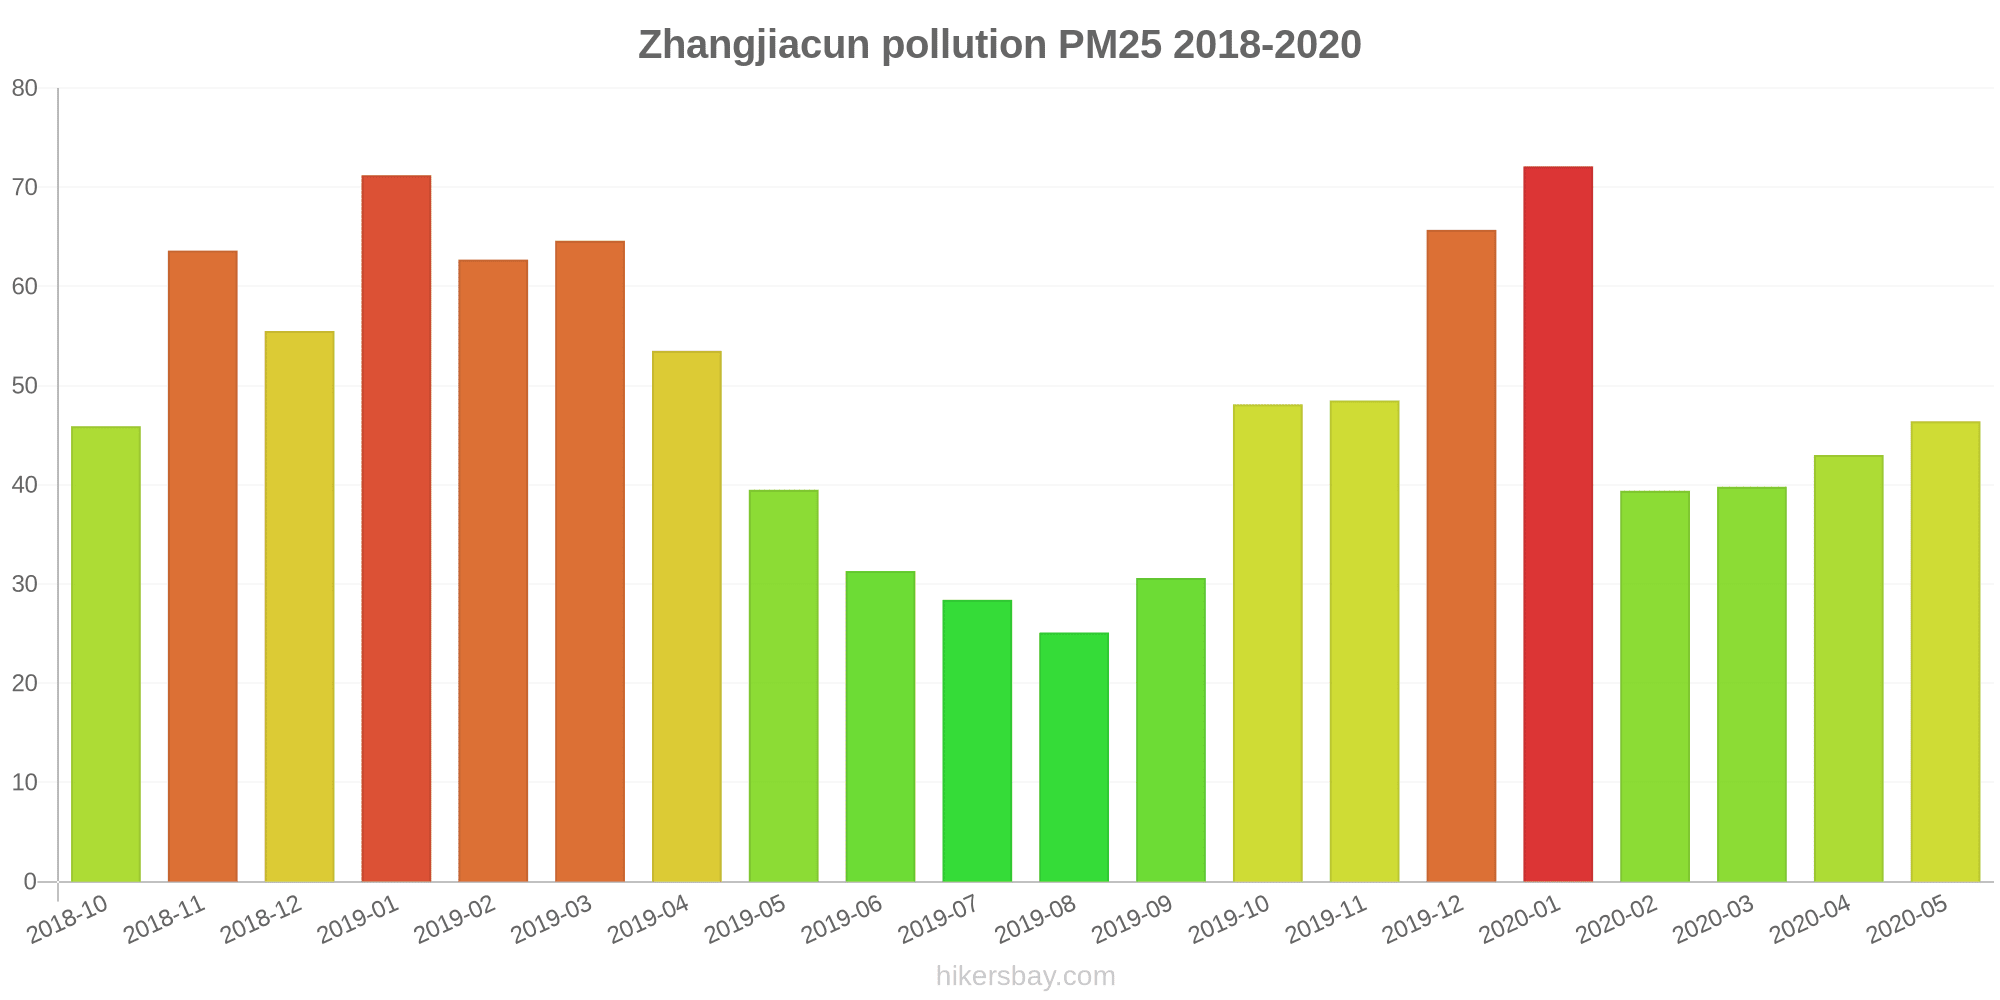
The highest PM2.5 values were recorded: 72 (January 2020).
The lowest level of particulate matter PM2.5 pollution occurs in month: August (25).
How is the O3 level today in Zhangjiacun? (ozone (O3))
0 (Good)
How high is the level of NO2? (nitrogen dioxide (NO2))
0 (Good)
What is the level of SO2 pollution? (sulfur dioxide (SO2))
0 (Good)
Current data Friday, May 27, 2022, 12:00 PM
PM10 179 (Very bad Hazardous)
PM2,5 35 (Unhealthy for Sensitive Groups)
O3 0 (Good)
NO2 0 (Good)
SO2 0 (Good)
Data on air pollution from recent days in Zhangjiacun
index
2022-05-27
pm10
56
Unhealthy for Sensitive Groups
pm25
56
Unhealthy
o3
0
Good
no2
0
Good
so2
0
Good
data source »
Air pollution in Zhangjiacun from October 2018 to May 2020

index
2020-05
2020-04
2020-03
2020-02
2020-01
2019-12
2019-11
2019-10
2019-09
2019-08
2019-07
2019-06
2019-05
2019-04
2019-03
2019-02
2019-01
2018-12
2018-11
2018-10
pm25
46 (Unhealthy for Sensitive Groups)
43 (Unhealthy for Sensitive Groups)
40 (Unhealthy for Sensitive Groups)
39 (Unhealthy for Sensitive Groups)
72 (Unhealthy)
66 (Unhealthy)
49 (Unhealthy for Sensitive Groups)
48 (Unhealthy for Sensitive Groups)
31 (Moderate)
25 (Moderate)
28 (Moderate)
31 (Moderate)
40 (Unhealthy for Sensitive Groups)
54 (Unhealthy for Sensitive Groups)
65 (Unhealthy)
63 (Unhealthy)
71 (Unhealthy)
56 (Unhealthy)
64 (Unhealthy)
46 (Unhealthy for Sensitive Groups)
co
846 (Good)
783 (Good)
729 (Good)
777 (Good)
958 (Good)
949 (Good)
753 (Good)
667 (Good)
740 (Good)
815 (Good)
746 (Good)
818 (Good)
728 (Good)
891 (Good)
849 (Good)
1 (Good)
920 (Good)
719 (Good)
872 (Good)
758 (Good)
no2
31 (Good)
40 (Moderate)
34 (Good)
22 (Good)
39 (Good)
54 (Moderate)
45 (Moderate)
42 (Moderate)
35 (Good)
24 (Good)
26 (Good)
24 (Good)
27 (Good)
35 (Good)
46 (Moderate)
33 (Good)
50 (Moderate)
51 (Moderate)
62 (Moderate)
52 (Moderate)
o3
157 (Unhealthy)
139 (Unhealthy for Sensitive Groups)
114 (Moderate)
103 (Moderate)
72 (Moderate)
75 (Moderate)
103 (Moderate)
126 (Unhealthy for Sensitive Groups)
156 (Unhealthy)
170 (Unhealthy)
174 (Unhealthy)
189 (Very Unhealthy)
175 (Unhealthy)
134 (Unhealthy for Sensitive Groups)
114 (Moderate)
89 (Moderate)
71 (Moderate)
57 (Good)
96 (Moderate)
124 (Unhealthy for Sensitive Groups)
pm10
74 (Unhealthy for Sensitive Groups)
75 (Unhealthy for Sensitive Groups)
63 (Unhealthy for Sensitive Groups)
58 (Unhealthy for Sensitive Groups)
99 (Unhealthy)
100 (Unhealthy)
100 (Unhealthy)
91 (Unhealthy)
55 (Unhealthy for Sensitive Groups)
42 (Moderate)
47 (Moderate)
52 (Unhealthy for Sensitive Groups)
72 (Unhealthy for Sensitive Groups)
87 (Unhealthy)
101 (Unhealthy)
81 (Unhealthy)
100 (Unhealthy)
80 (Unhealthy)
89 (Unhealthy)
73 (Unhealthy for Sensitive Groups)
so2
8 (Good)
11 (Good)
8.6 (Good)
7.9 (Good)
8.2 (Good)
13 (Good)
12 (Good)
10 (Good)
8.4 (Good)
7.5 (Good)
6.6 (Good)
9.3 (Good)
11 (Good)
12 (Good)
10 (Good)
7.7 (Good)
9.2 (Good)
8.3 (Good)
11 (Good)
13 (Good)
data source »
武进监测站
Friday, May 27, 2022, 12:00 PM
PM10 179 (Very bad Hazardous)
particulate matter (PM10) suspended dust
PM2,5 35 (Unhealthy for Sensitive Groups)
particulate matter (PM2.5) dust
O3 0.04 (Good)
ozone (O3)
NO2 0 (Good)
nitrogen dioxide (NO2)
SO2 0 (Good)
sulfur dioxide (SO2)
武进监测站
index
2022-05-27
pm10
56
pm25
56
o3
0.03
no2
0
so2
0
武进监测站
2018-10 2020-05
index
2020-05
2020-04
2020-03
2020-02
2020-01
2019-12
2019-11
2019-10
2019-09
2019-08
2019-07
2019-06
2019-05
2019-04
2019-03
2019-02
2019-01
2018-12
2018-11
2018-10
pm25
46
43
40
39
72
66
49
48
31
25
28
31
40
54
65
63
71
56
64
46
co
846
783
729
777
958
949
753
667
740
815
746
818
728
891
849
1
920
719
872
758
no2
31
40
34
22
39
54
45
42
35
24
26
24
27
35
46
33
50
51
62
52
o3
157
139
114
103
72
75
103
126
156
170
174
189
175
134
114
89
71
57
96
124
pm10
74
75
63
58
99
100
100
91
55
42
47
52
72
87
101
81
100
80
89
73
so2
8
11
8.6
7.9
8.2
13
12
10
8.4
7.5
6.6
9.3
11
12
10
7.7
9.2
8.3
11
13
* Pollution data source:
https://openaq.org
(ChinaAQIData)
The data is licensed under CC-By 4.0
PM10 179 (Very bad Hazardous)
PM2,5 35 (Unhealthy for Sensitive Groups)
O3 0 (Good)
NO2 0 (Good)
SO2 0 (Good)
Data on air pollution from recent days in Zhangjiacun
| index | 2022-05-27 |
|---|---|
| pm10 | 56 Unhealthy for Sensitive Groups |
| pm25 | 56 Unhealthy |
| o3 | 0 Good |
| no2 | 0 Good |
| so2 | 0 Good |
| index | 2020-05 | 2020-04 | 2020-03 | 2020-02 | 2020-01 | 2019-12 | 2019-11 | 2019-10 | 2019-09 | 2019-08 | 2019-07 | 2019-06 | 2019-05 | 2019-04 | 2019-03 | 2019-02 | 2019-01 | 2018-12 | 2018-11 | 2018-10 |
|---|---|---|---|---|---|---|---|---|---|---|---|---|---|---|---|---|---|---|---|---|
| pm25 | 46 (Unhealthy for Sensitive Groups) | 43 (Unhealthy for Sensitive Groups) | 40 (Unhealthy for Sensitive Groups) | 39 (Unhealthy for Sensitive Groups) | 72 (Unhealthy) | 66 (Unhealthy) | 49 (Unhealthy for Sensitive Groups) | 48 (Unhealthy for Sensitive Groups) | 31 (Moderate) | 25 (Moderate) | 28 (Moderate) | 31 (Moderate) | 40 (Unhealthy for Sensitive Groups) | 54 (Unhealthy for Sensitive Groups) | 65 (Unhealthy) | 63 (Unhealthy) | 71 (Unhealthy) | 56 (Unhealthy) | 64 (Unhealthy) | 46 (Unhealthy for Sensitive Groups) |
| co | 846 (Good) | 783 (Good) | 729 (Good) | 777 (Good) | 958 (Good) | 949 (Good) | 753 (Good) | 667 (Good) | 740 (Good) | 815 (Good) | 746 (Good) | 818 (Good) | 728 (Good) | 891 (Good) | 849 (Good) | 1 (Good) | 920 (Good) | 719 (Good) | 872 (Good) | 758 (Good) |
| no2 | 31 (Good) | 40 (Moderate) | 34 (Good) | 22 (Good) | 39 (Good) | 54 (Moderate) | 45 (Moderate) | 42 (Moderate) | 35 (Good) | 24 (Good) | 26 (Good) | 24 (Good) | 27 (Good) | 35 (Good) | 46 (Moderate) | 33 (Good) | 50 (Moderate) | 51 (Moderate) | 62 (Moderate) | 52 (Moderate) |
| o3 | 157 (Unhealthy) | 139 (Unhealthy for Sensitive Groups) | 114 (Moderate) | 103 (Moderate) | 72 (Moderate) | 75 (Moderate) | 103 (Moderate) | 126 (Unhealthy for Sensitive Groups) | 156 (Unhealthy) | 170 (Unhealthy) | 174 (Unhealthy) | 189 (Very Unhealthy) | 175 (Unhealthy) | 134 (Unhealthy for Sensitive Groups) | 114 (Moderate) | 89 (Moderate) | 71 (Moderate) | 57 (Good) | 96 (Moderate) | 124 (Unhealthy for Sensitive Groups) |
| pm10 | 74 (Unhealthy for Sensitive Groups) | 75 (Unhealthy for Sensitive Groups) | 63 (Unhealthy for Sensitive Groups) | 58 (Unhealthy for Sensitive Groups) | 99 (Unhealthy) | 100 (Unhealthy) | 100 (Unhealthy) | 91 (Unhealthy) | 55 (Unhealthy for Sensitive Groups) | 42 (Moderate) | 47 (Moderate) | 52 (Unhealthy for Sensitive Groups) | 72 (Unhealthy for Sensitive Groups) | 87 (Unhealthy) | 101 (Unhealthy) | 81 (Unhealthy) | 100 (Unhealthy) | 80 (Unhealthy) | 89 (Unhealthy) | 73 (Unhealthy for Sensitive Groups) |
| so2 | 8 (Good) | 11 (Good) | 8.6 (Good) | 7.9 (Good) | 8.2 (Good) | 13 (Good) | 12 (Good) | 10 (Good) | 8.4 (Good) | 7.5 (Good) | 6.6 (Good) | 9.3 (Good) | 11 (Good) | 12 (Good) | 10 (Good) | 7.7 (Good) | 9.2 (Good) | 8.3 (Good) | 11 (Good) | 13 (Good) |
PM10 179 (Very bad Hazardous)
particulate matter (PM10) suspended dustPM2,5 35 (Unhealthy for Sensitive Groups)
particulate matter (PM2.5) dustO3 0.04 (Good)
ozone (O3)NO2 0 (Good)
nitrogen dioxide (NO2)SO2 0 (Good)
sulfur dioxide (SO2)武进监测站
| index | 2022-05-27 |
|---|---|
| pm10 | 56 |
| pm25 | 56 |
| o3 | 0.03 |
| no2 | 0 |
| so2 | 0 |
武进监测站

| index | 2020-05 | 2020-04 | 2020-03 | 2020-02 | 2020-01 | 2019-12 | 2019-11 | 2019-10 | 2019-09 | 2019-08 | 2019-07 | 2019-06 | 2019-05 | 2019-04 | 2019-03 | 2019-02 | 2019-01 | 2018-12 | 2018-11 | 2018-10 |
|---|---|---|---|---|---|---|---|---|---|---|---|---|---|---|---|---|---|---|---|---|
| pm25 | 46 | 43 | 40 | 39 | 72 | 66 | 49 | 48 | 31 | 25 | 28 | 31 | 40 | 54 | 65 | 63 | 71 | 56 | 64 | 46 |
| co | 846 | 783 | 729 | 777 | 958 | 949 | 753 | 667 | 740 | 815 | 746 | 818 | 728 | 891 | 849 | 1 | 920 | 719 | 872 | 758 |
| no2 | 31 | 40 | 34 | 22 | 39 | 54 | 45 | 42 | 35 | 24 | 26 | 24 | 27 | 35 | 46 | 33 | 50 | 51 | 62 | 52 |
| o3 | 157 | 139 | 114 | 103 | 72 | 75 | 103 | 126 | 156 | 170 | 174 | 189 | 175 | 134 | 114 | 89 | 71 | 57 | 96 | 124 |
| pm10 | 74 | 75 | 63 | 58 | 99 | 100 | 100 | 91 | 55 | 42 | 47 | 52 | 72 | 87 | 101 | 81 | 100 | 80 | 89 | 73 |
| so2 | 8 | 11 | 8.6 | 7.9 | 8.2 | 13 | 12 | 10 | 8.4 | 7.5 | 6.6 | 9.3 | 11 | 12 | 10 | 7.7 | 9.2 | 8.3 | 11 | 13 |