Air Pollution in Longshan: Real-time Air Quality Index and smog alert.
Pollution and air quality forecast for Longshan. Today is Tuesday, June 2, 2026. The following air pollution values have been recorded for Longshan:- particulate matter (PM10) suspended dust - 179 (Very bad Hazardous)
- particulate matter (PM2.5) dust - 35 (Unhealthy for Sensitive Groups)
- ozone (O3) - 0 (Good)
- nitrogen dioxide (NO2) - 0 (Good)
- sulfur dioxide (SO2) - 0 (Good)

What is the air quality in Longshan today? Is the air polluted in Longshan?. Is there smog?
What is the level of PM10 today in Longshan? (particulate matter (PM10) suspended dust)
The current level of particulate matter PM10 in Longshan is:
179 (Very bad Hazardous)
The highest PM10 values usually occur in month: 91 (January 2019).
The lowest value of particulate matter PM10 pollution in Longshan is usually recorded in: August (39).
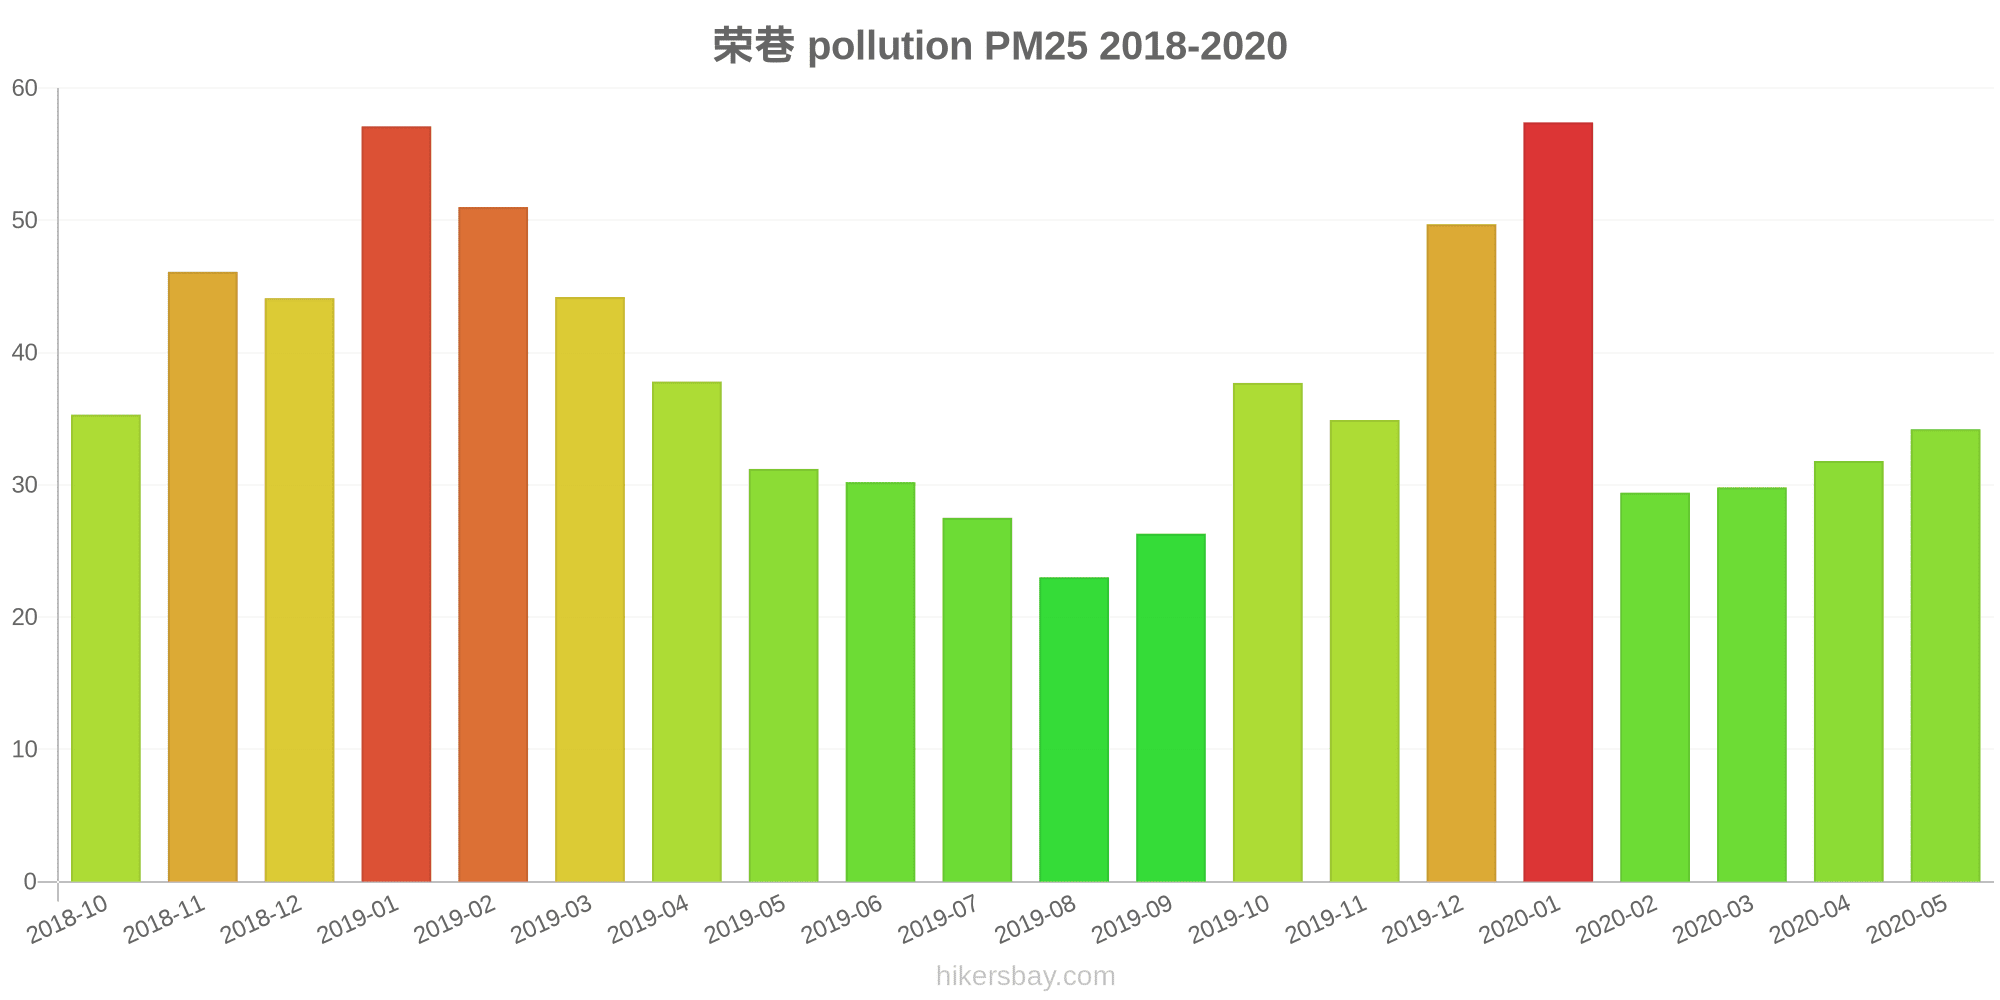
What is the current level of PM2.5 in Longshan? (particulate matter (PM2.5) dust)
Today's PM2.5 level is:
35 (Unhealthy for Sensitive Groups)
For comparison, the highest level of PM2.5 in Longshan in the last 7 days was: 56 (Friday, May 27, 2022) and the lowest: 56 (Friday, May 27, 2022).
The highest PM2.5 values were recorded: 57 (January 2020).
The lowest level of particulate matter PM2.5 pollution occurs in month: August (23).
How is the O3 level today in Longshan? (ozone (O3))
0 (Good)
How high is the level of NO2? (nitrogen dioxide (NO2))
0 (Good)
What is the level of SO2 pollution? (sulfur dioxide (SO2))
0 (Good)
Current data Friday, May 27, 2022, 12:00 PM
PM10 179 (Very bad Hazardous)
PM2,5 35 (Unhealthy for Sensitive Groups)
O3 0 (Good)
NO2 0 (Good)
SO2 0 (Good)
Data on air pollution from recent days in Longshan
index
2022-05-27
pm10
56
Unhealthy for Sensitive Groups
pm25
56
Unhealthy
o3
0
Good
no2
0
Good
so2
0
Good
data source »
Air pollution in Longshan from October 2018 to May 2020

index
2020-05
2020-04
2020-03
2020-02
2020-01
2019-12
2019-11
2019-10
2019-09
2019-08
2019-07
2019-06
2019-05
2019-04
2019-03
2019-02
2019-01
2018-12
2018-11
2018-10
pm25
34 (Moderate)
32 (Moderate)
30 (Moderate)
29 (Moderate)
57 (Unhealthy)
50 (Unhealthy for Sensitive Groups)
35 (Moderate)
38 (Unhealthy for Sensitive Groups)
26 (Moderate)
23 (Moderate)
28 (Moderate)
30 (Moderate)
31 (Moderate)
38 (Unhealthy for Sensitive Groups)
44 (Unhealthy for Sensitive Groups)
51 (Unhealthy for Sensitive Groups)
57 (Unhealthy)
44 (Unhealthy for Sensitive Groups)
46 (Unhealthy for Sensitive Groups)
35 (Unhealthy for Sensitive Groups)
co
821 (Good)
636 (Good)
618 (Good)
776 (Good)
995 (Good)
972 (Good)
870 (Good)
869 (Good)
727 (Good)
614 (Good)
529 (Good)
566 (Good)
608 (Good)
576 (Good)
648 (Good)
1 (Good)
1 (Good)
1 (Good)
883 (Good)
944 (Good)
no2
20 (Good)
30 (Good)
28 (Good)
19 (Good)
38 (Good)
48 (Moderate)
45 (Moderate)
35 (Good)
21 (Good)
20 (Good)
19 (Good)
19 (Good)
31 (Good)
39 (Good)
45 (Moderate)
39 (Good)
54 (Moderate)
53 (Moderate)
48 (Moderate)
40 (Moderate)
o3
160 (Unhealthy)
154 (Unhealthy)
111 (Moderate)
111 (Moderate)
70 (Moderate)
68 (Good)
100 (Moderate)
124 (Unhealthy for Sensitive Groups)
151 (Unhealthy)
165 (Unhealthy)
163 (Unhealthy)
186 (Very Unhealthy)
151 (Unhealthy)
127 (Unhealthy for Sensitive Groups)
113 (Moderate)
73 (Moderate)
54 (Good)
41 (Good)
76 (Moderate)
104 (Moderate)
pm10
56 (Unhealthy for Sensitive Groups)
61 (Unhealthy for Sensitive Groups)
51 (Unhealthy for Sensitive Groups)
44 (Moderate)
73 (Unhealthy for Sensitive Groups)
73 (Unhealthy for Sensitive Groups)
79 (Unhealthy for Sensitive Groups)
75 (Unhealthy for Sensitive Groups)
48 (Moderate)
39 (Moderate)
43 (Moderate)
45 (Moderate)
61 (Unhealthy for Sensitive Groups)
67 (Unhealthy for Sensitive Groups)
82 (Unhealthy)
73 (Unhealthy for Sensitive Groups)
91 (Unhealthy)
78 (Unhealthy for Sensitive Groups)
78 (Unhealthy for Sensitive Groups)
72 (Unhealthy for Sensitive Groups)
so2
6 (Good)
6.9 (Good)
6.3 (Good)
7.9 (Good)
8.1 (Good)
9 (Good)
9.9 (Good)
8.6 (Good)
5.2 (Good)
6.3 (Good)
6.4 (Good)
6.5 (Good)
7.9 (Good)
6.3 (Good)
8.3 (Good)
8 (Good)
10 (Good)
13 (Good)
11 (Good)
13 (Good)
data source »
荣巷
Friday, May 27, 2022, 12:00 PM
PM10 179 (Very bad Hazardous)
particulate matter (PM10) suspended dust
PM2,5 35 (Unhealthy for Sensitive Groups)
particulate matter (PM2.5) dust
O3 0.04 (Good)
ozone (O3)
NO2 0 (Good)
nitrogen dioxide (NO2)
SO2 0 (Good)
sulfur dioxide (SO2)
荣巷
index
2022-05-27
pm10
56
pm25
56
o3
0.03
no2
0
so2
0
荣巷
2018-10 2020-05

index
2020-05
2020-04
2020-03
2020-02
2020-01
2019-12
2019-11
2019-10
2019-09
2019-08
2019-07
2019-06
2019-05
2019-04
2019-03
2019-02
2019-01
2018-12
2018-11
2018-10
pm25
34
32
30
29
57
50
35
38
26
23
28
30
31
38
44
51
57
44
46
35
co
821
636
618
776
995
972
870
869
727
614
529
566
608
576
648
1
1
1
883
944
no2
20
30
28
19
38
48
45
35
21
20
19
19
31
39
45
39
54
53
48
40
o3
160
154
111
111
70
68
100
124
151
165
163
186
151
127
113
73
54
41
76
104
pm10
56
61
51
44
73
73
79
75
48
39
43
45
61
67
82
73
91
78
78
72
so2
6
6.9
6.3
7.9
8.1
9
9.9
8.6
5.2
6.3
6.4
6.5
7.9
6.3
8.3
8
10
13
11
13
* Pollution data source:
https://openaq.org
(ChinaAQIData)
The data is licensed under CC-By 4.0
PM10 179 (Very bad Hazardous)
PM2,5 35 (Unhealthy for Sensitive Groups)
O3 0 (Good)
NO2 0 (Good)
SO2 0 (Good)
Data on air pollution from recent days in Longshan
| index | 2022-05-27 |
|---|---|
| pm10 | 56 Unhealthy for Sensitive Groups |
| pm25 | 56 Unhealthy |
| o3 | 0 Good |
| no2 | 0 Good |
| so2 | 0 Good |

| index | 2020-05 | 2020-04 | 2020-03 | 2020-02 | 2020-01 | 2019-12 | 2019-11 | 2019-10 | 2019-09 | 2019-08 | 2019-07 | 2019-06 | 2019-05 | 2019-04 | 2019-03 | 2019-02 | 2019-01 | 2018-12 | 2018-11 | 2018-10 |
|---|---|---|---|---|---|---|---|---|---|---|---|---|---|---|---|---|---|---|---|---|
| pm25 | 34 (Moderate) | 32 (Moderate) | 30 (Moderate) | 29 (Moderate) | 57 (Unhealthy) | 50 (Unhealthy for Sensitive Groups) | 35 (Moderate) | 38 (Unhealthy for Sensitive Groups) | 26 (Moderate) | 23 (Moderate) | 28 (Moderate) | 30 (Moderate) | 31 (Moderate) | 38 (Unhealthy for Sensitive Groups) | 44 (Unhealthy for Sensitive Groups) | 51 (Unhealthy for Sensitive Groups) | 57 (Unhealthy) | 44 (Unhealthy for Sensitive Groups) | 46 (Unhealthy for Sensitive Groups) | 35 (Unhealthy for Sensitive Groups) |
| co | 821 (Good) | 636 (Good) | 618 (Good) | 776 (Good) | 995 (Good) | 972 (Good) | 870 (Good) | 869 (Good) | 727 (Good) | 614 (Good) | 529 (Good) | 566 (Good) | 608 (Good) | 576 (Good) | 648 (Good) | 1 (Good) | 1 (Good) | 1 (Good) | 883 (Good) | 944 (Good) |
| no2 | 20 (Good) | 30 (Good) | 28 (Good) | 19 (Good) | 38 (Good) | 48 (Moderate) | 45 (Moderate) | 35 (Good) | 21 (Good) | 20 (Good) | 19 (Good) | 19 (Good) | 31 (Good) | 39 (Good) | 45 (Moderate) | 39 (Good) | 54 (Moderate) | 53 (Moderate) | 48 (Moderate) | 40 (Moderate) |
| o3 | 160 (Unhealthy) | 154 (Unhealthy) | 111 (Moderate) | 111 (Moderate) | 70 (Moderate) | 68 (Good) | 100 (Moderate) | 124 (Unhealthy for Sensitive Groups) | 151 (Unhealthy) | 165 (Unhealthy) | 163 (Unhealthy) | 186 (Very Unhealthy) | 151 (Unhealthy) | 127 (Unhealthy for Sensitive Groups) | 113 (Moderate) | 73 (Moderate) | 54 (Good) | 41 (Good) | 76 (Moderate) | 104 (Moderate) |
| pm10 | 56 (Unhealthy for Sensitive Groups) | 61 (Unhealthy for Sensitive Groups) | 51 (Unhealthy for Sensitive Groups) | 44 (Moderate) | 73 (Unhealthy for Sensitive Groups) | 73 (Unhealthy for Sensitive Groups) | 79 (Unhealthy for Sensitive Groups) | 75 (Unhealthy for Sensitive Groups) | 48 (Moderate) | 39 (Moderate) | 43 (Moderate) | 45 (Moderate) | 61 (Unhealthy for Sensitive Groups) | 67 (Unhealthy for Sensitive Groups) | 82 (Unhealthy) | 73 (Unhealthy for Sensitive Groups) | 91 (Unhealthy) | 78 (Unhealthy for Sensitive Groups) | 78 (Unhealthy for Sensitive Groups) | 72 (Unhealthy for Sensitive Groups) |
| so2 | 6 (Good) | 6.9 (Good) | 6.3 (Good) | 7.9 (Good) | 8.1 (Good) | 9 (Good) | 9.9 (Good) | 8.6 (Good) | 5.2 (Good) | 6.3 (Good) | 6.4 (Good) | 6.5 (Good) | 7.9 (Good) | 6.3 (Good) | 8.3 (Good) | 8 (Good) | 10 (Good) | 13 (Good) | 11 (Good) | 13 (Good) |
PM10 179 (Very bad Hazardous)
particulate matter (PM10) suspended dustPM2,5 35 (Unhealthy for Sensitive Groups)
particulate matter (PM2.5) dustO3 0.04 (Good)
ozone (O3)NO2 0 (Good)
nitrogen dioxide (NO2)SO2 0 (Good)
sulfur dioxide (SO2)荣巷
| index | 2022-05-27 |
|---|---|
| pm10 | 56 |
| pm25 | 56 |
| o3 | 0.03 |
| no2 | 0 |
| so2 | 0 |
荣巷
| index | 2020-05 | 2020-04 | 2020-03 | 2020-02 | 2020-01 | 2019-12 | 2019-11 | 2019-10 | 2019-09 | 2019-08 | 2019-07 | 2019-06 | 2019-05 | 2019-04 | 2019-03 | 2019-02 | 2019-01 | 2018-12 | 2018-11 | 2018-10 |
|---|---|---|---|---|---|---|---|---|---|---|---|---|---|---|---|---|---|---|---|---|
| pm25 | 34 | 32 | 30 | 29 | 57 | 50 | 35 | 38 | 26 | 23 | 28 | 30 | 31 | 38 | 44 | 51 | 57 | 44 | 46 | 35 |
| co | 821 | 636 | 618 | 776 | 995 | 972 | 870 | 869 | 727 | 614 | 529 | 566 | 608 | 576 | 648 | 1 | 1 | 1 | 883 | 944 |
| no2 | 20 | 30 | 28 | 19 | 38 | 48 | 45 | 35 | 21 | 20 | 19 | 19 | 31 | 39 | 45 | 39 | 54 | 53 | 48 | 40 |
| o3 | 160 | 154 | 111 | 111 | 70 | 68 | 100 | 124 | 151 | 165 | 163 | 186 | 151 | 127 | 113 | 73 | 54 | 41 | 76 | 104 |
| pm10 | 56 | 61 | 51 | 44 | 73 | 73 | 79 | 75 | 48 | 39 | 43 | 45 | 61 | 67 | 82 | 73 | 91 | 78 | 78 | 72 |
| so2 | 6 | 6.9 | 6.3 | 7.9 | 8.1 | 9 | 9.9 | 8.6 | 5.2 | 6.3 | 6.4 | 6.5 | 7.9 | 6.3 | 8.3 | 8 | 10 | 13 | 11 | 13 |