Air Pollution in Xitiexiang: Real-time Air Quality Index and smog alert.
Pollution and air quality forecast for Xitiexiang. Today is Tuesday, June 2, 2026. The following air pollution values have been recorded for Xitiexiang:- particulate matter (PM10) suspended dust - 179 (Very bad Hazardous)
- particulate matter (PM2.5) dust - 35 (Unhealthy for Sensitive Groups)
- ozone (O3) - 0 (Good)
- nitrogen dioxide (NO2) - 0 (Good)
- sulfur dioxide (SO2) - 0 (Good)

What is the air quality in Xitiexiang today? Is the air polluted in Xitiexiang?. Is there smog?
What is the level of PM10 today in Xitiexiang? (particulate matter (PM10) suspended dust)
The current level of particulate matter PM10 in Xitiexiang is:
179 (Very bad Hazardous)
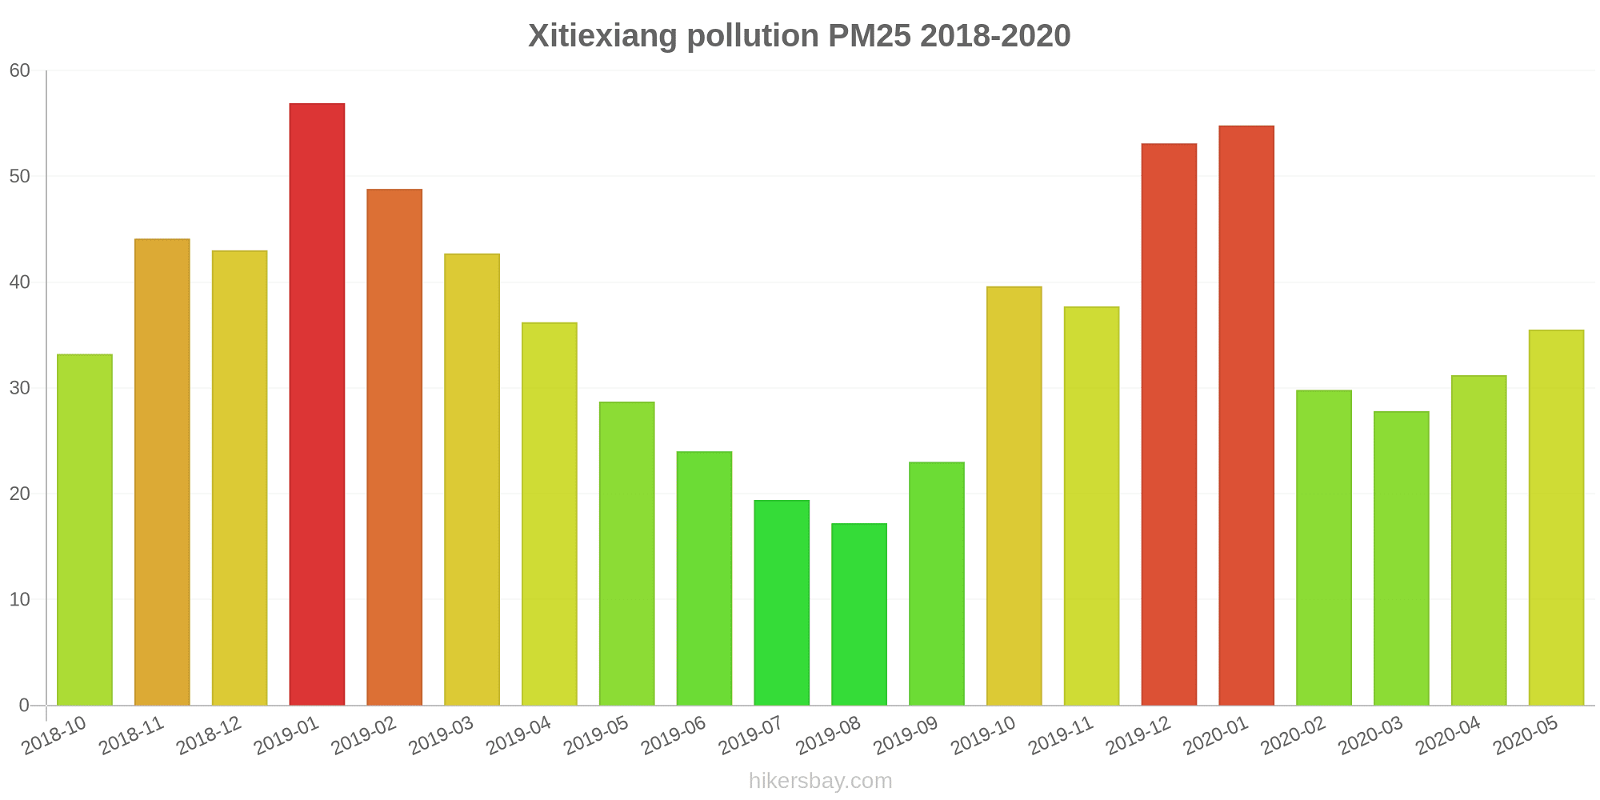
The highest PM10 values usually occur in month: 90 (January 2019).
The lowest value of particulate matter PM10 pollution in Xitiexiang is usually recorded in: August (37).
What is the current level of PM2.5 in Xitiexiang? (particulate matter (PM2.5) dust)
Today's PM2.5 level is:
35 (Unhealthy for Sensitive Groups)
For comparison, the highest level of PM2.5 in Xitiexiang in the last 7 days was: 56 (Friday, May 27, 2022) and the lowest: 56 (Friday, May 27, 2022).
The highest PM2.5 values were recorded: 57 (January 2019).
The lowest level of particulate matter PM2.5 pollution occurs in month: August (17).
How is the O3 level today in Xitiexiang? (ozone (O3))
0 (Good)
How high is the level of NO2? (nitrogen dioxide (NO2))
0 (Good)
What is the level of SO2 pollution? (sulfur dioxide (SO2))
0 (Good)
Current data Friday, May 27, 2022, 12:00 PM
PM10 179 (Very bad Hazardous)
PM2,5 35 (Unhealthy for Sensitive Groups)
O3 0 (Good)
NO2 0 (Good)
SO2 0 (Good)
Data on air pollution from recent days in Xitiexiang
index
2022-05-27
pm10
56
Unhealthy for Sensitive Groups
pm25
56
Unhealthy
o3
0
Good
no2
0
Good
so2
0
Good
data source »
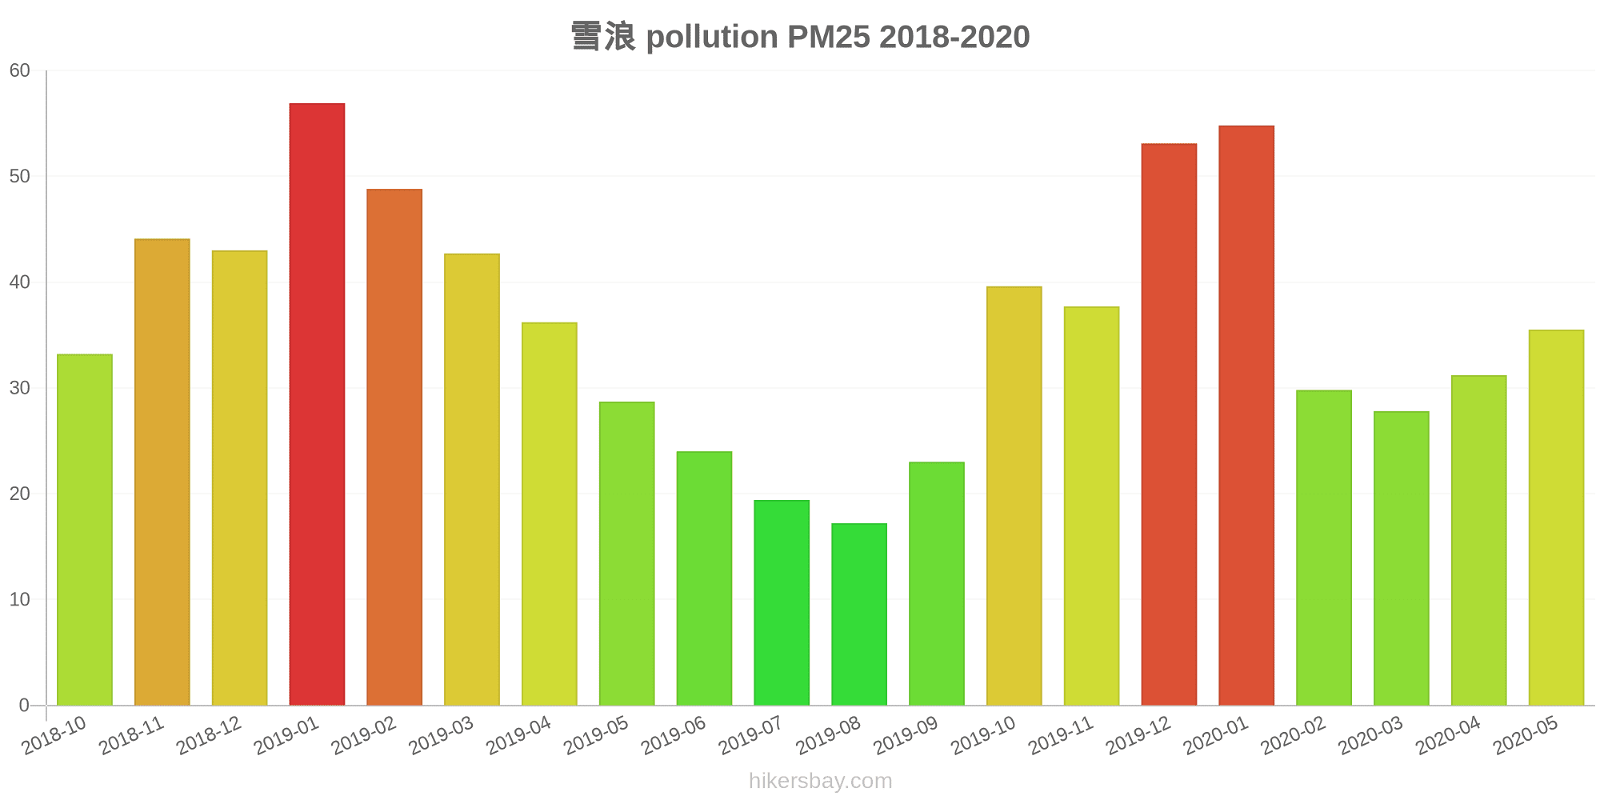
Air pollution in Xitiexiang from October 2018 to May 2020
index
2020-05
2020-04
2020-03
2020-02
2020-01
2019-12
2019-11
2019-10
2019-09
2019-08
2019-07
2019-06
2019-05
2019-04
2019-03
2019-02
2019-01
2018-12
2018-11
2018-10
pm25
36 (Unhealthy for Sensitive Groups)
31 (Moderate)
28 (Moderate)
30 (Moderate)
55 (Unhealthy for Sensitive Groups)
53 (Unhealthy for Sensitive Groups)
38 (Unhealthy for Sensitive Groups)
40 (Unhealthy for Sensitive Groups)
23 (Moderate)
17 (Moderate)
19 (Moderate)
24 (Moderate)
29 (Moderate)
36 (Unhealthy for Sensitive Groups)
43 (Unhealthy for Sensitive Groups)
49 (Unhealthy for Sensitive Groups)
57 (Unhealthy)
43 (Unhealthy for Sensitive Groups)
44 (Unhealthy for Sensitive Groups)
33 (Moderate)
co
669 (Good)
611 (Good)
643 (Good)
921 (Good)
899 (Good)
1 (Good)
816 (Good)
906 (Good)
846 (Good)
818 (Good)
745 (Good)
747 (Good)
633 (Good)
723 (Good)
772 (Good)
912 (Good)
820 (Good)
1 (Good)
954 (Good)
875 (Good)
no2
20 (Good)
31 (Good)
31 (Good)
23 (Good)
39 (Good)
56 (Moderate)
56 (Moderate)
46 (Moderate)
34 (Good)
22 (Good)
20 (Good)
24 (Good)
28 (Good)
31 (Good)
35 (Good)
35 (Good)
54 (Moderate)
53 (Moderate)
49 (Moderate)
39 (Good)
o3
165 (Unhealthy)
167 (Unhealthy)
125 (Unhealthy for Sensitive Groups)
87 (Moderate)
62 (Good)
67 (Good)
99 (Moderate)
123 (Unhealthy for Sensitive Groups)
163 (Unhealthy)
168 (Unhealthy)
169 (Unhealthy)
182 (Very Unhealthy)
173 (Unhealthy)
137 (Unhealthy for Sensitive Groups)
111 (Moderate)
80 (Moderate)
66 (Good)
47 (Good)
84 (Moderate)
112 (Moderate)
pm10
62 (Unhealthy for Sensitive Groups)
68 (Unhealthy for Sensitive Groups)
53 (Unhealthy for Sensitive Groups)
45 (Moderate)
74 (Unhealthy for Sensitive Groups)
79 (Unhealthy for Sensitive Groups)
87 (Unhealthy)
80 (Unhealthy for Sensitive Groups)
46 (Moderate)
37 (Moderate)
40 (Moderate)
45 (Moderate)
68 (Unhealthy for Sensitive Groups)
65 (Unhealthy for Sensitive Groups)
81 (Unhealthy)
72 (Unhealthy for Sensitive Groups)
90 (Unhealthy)
76 (Unhealthy for Sensitive Groups)
71 (Unhealthy for Sensitive Groups)
69 (Unhealthy for Sensitive Groups)
so2
6.6 (Good)
8.1 (Good)
6.7 (Good)
5.6 (Good)
6 (Good)
8.9 (Good)
9.6 (Good)
18 (Good)
6.5 (Good)
5.5 (Good)
7.5 (Good)
6.6 (Good)
8.6 (Good)
7.9 (Good)
8.4 (Good)
8.2 (Good)
9.9 (Good)
13 (Good)
11 (Good)
12 (Good)
data source »
雪浪
Friday, May 27, 2022, 12:00 PM
PM10 179 (Very bad Hazardous)
particulate matter (PM10) suspended dust
PM2,5 35 (Unhealthy for Sensitive Groups)
particulate matter (PM2.5) dust
O3 0.04 (Good)
ozone (O3)
NO2 0 (Good)
nitrogen dioxide (NO2)
SO2 0 (Good)
sulfur dioxide (SO2)
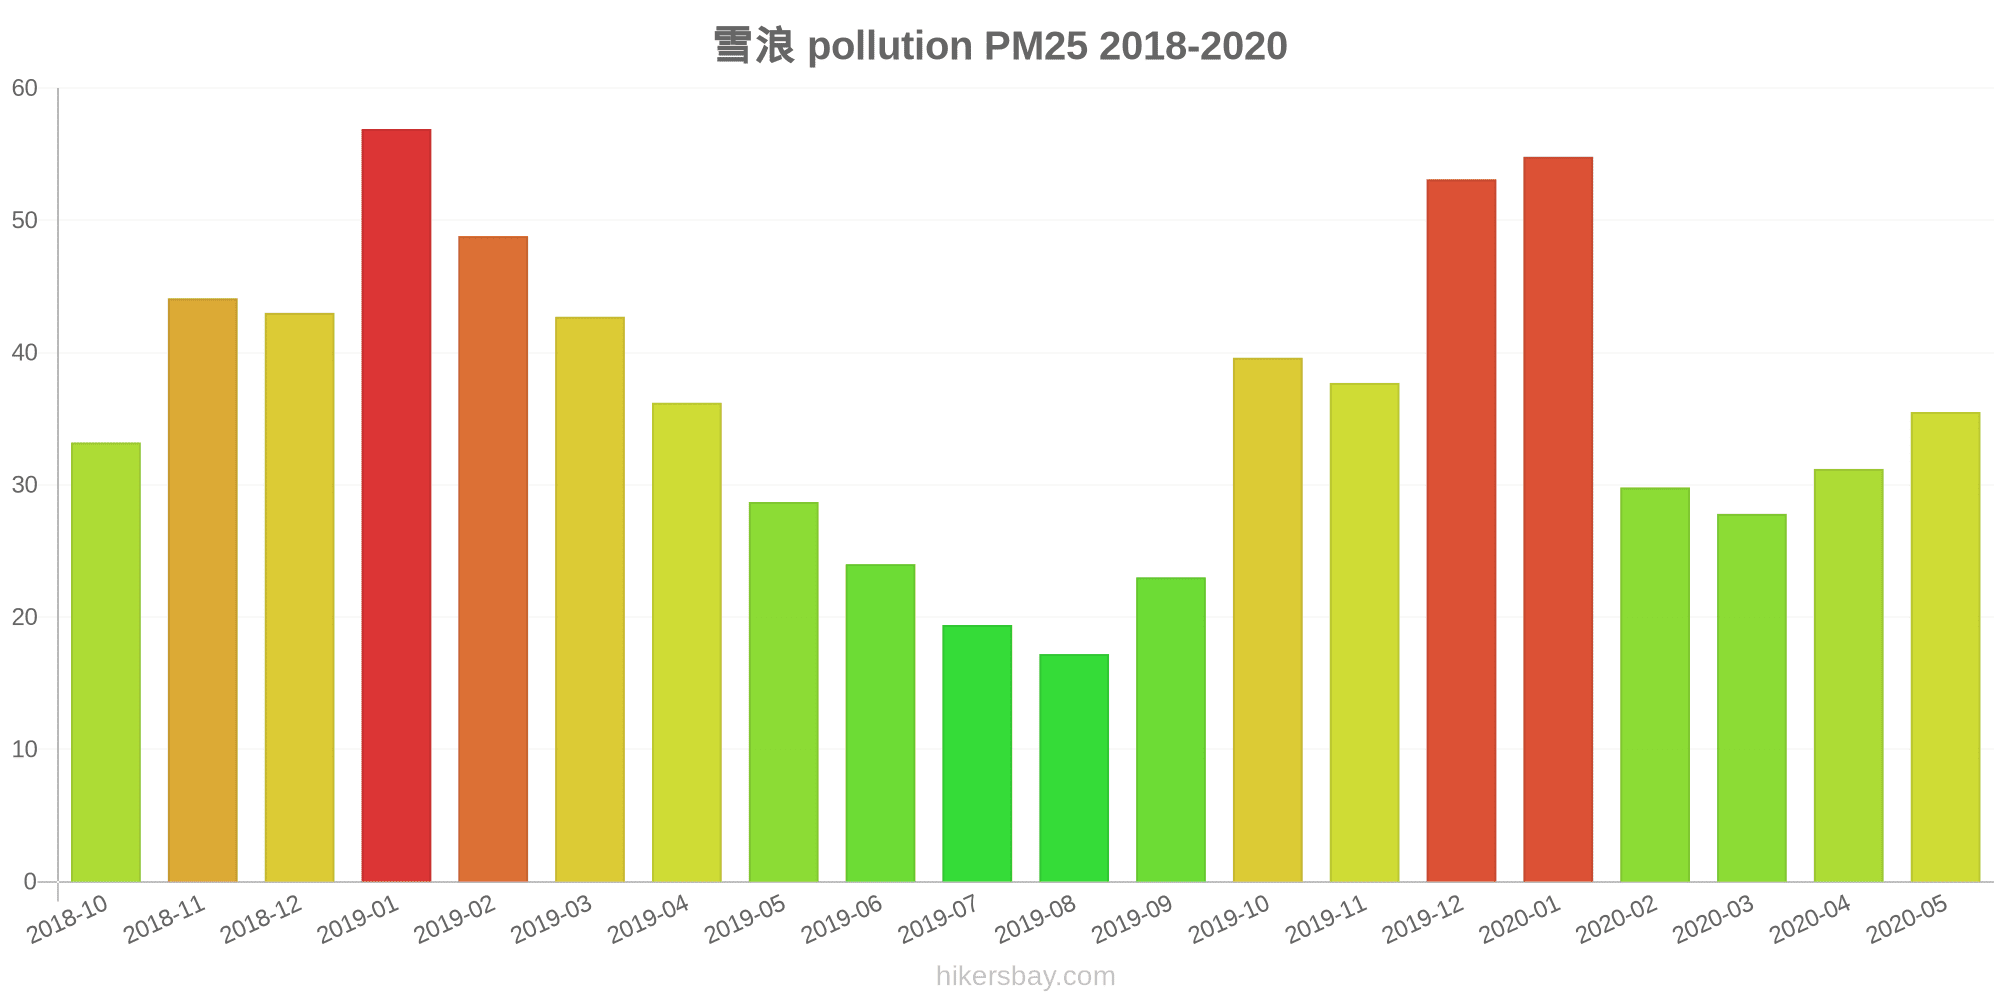
雪浪
index
2022-05-27
pm10
56
pm25
56
o3
0.03
no2
0
so2
0
雪浪
2018-10 2020-05
index
2020-05
2020-04
2020-03
2020-02
2020-01
2019-12
2019-11
2019-10
2019-09
2019-08
2019-07
2019-06
2019-05
2019-04
2019-03
2019-02
2019-01
2018-12
2018-11
2018-10
pm25
36
31
28
30
55
53
38
40
23
17
19
24
29
36
43
49
57
43
44
33
co
669
611
643
921
899
1
816
906
846
818
745
747
633
723
772
912
820
1
954
875
no2
20
31
31
23
39
56
56
46
34
22
20
24
28
31
35
35
54
53
49
39
o3
165
167
125
87
62
67
99
123
163
168
169
182
173
137
111
80
66
47
84
112
pm10
62
68
53
45
74
79
87
80
46
37
40
45
68
65
81
72
90
76
71
69
so2
6.6
8.1
6.7
5.6
6
8.9
9.6
18
6.5
5.5
7.5
6.6
8.6
7.9
8.4
8.2
9.9
13
11
12
* Pollution data source:
https://openaq.org
(ChinaAQIData)
The data is licensed under CC-By 4.0
PM10 179 (Very bad Hazardous)
PM2,5 35 (Unhealthy for Sensitive Groups)
O3 0 (Good)
NO2 0 (Good)
SO2 0 (Good)
Data on air pollution from recent days in Xitiexiang
| index | 2022-05-27 |
|---|---|
| pm10 | 56 Unhealthy for Sensitive Groups |
| pm25 | 56 Unhealthy |
| o3 | 0 Good |
| no2 | 0 Good |
| so2 | 0 Good |

| index | 2020-05 | 2020-04 | 2020-03 | 2020-02 | 2020-01 | 2019-12 | 2019-11 | 2019-10 | 2019-09 | 2019-08 | 2019-07 | 2019-06 | 2019-05 | 2019-04 | 2019-03 | 2019-02 | 2019-01 | 2018-12 | 2018-11 | 2018-10 |
|---|---|---|---|---|---|---|---|---|---|---|---|---|---|---|---|---|---|---|---|---|
| pm25 | 36 (Unhealthy for Sensitive Groups) | 31 (Moderate) | 28 (Moderate) | 30 (Moderate) | 55 (Unhealthy for Sensitive Groups) | 53 (Unhealthy for Sensitive Groups) | 38 (Unhealthy for Sensitive Groups) | 40 (Unhealthy for Sensitive Groups) | 23 (Moderate) | 17 (Moderate) | 19 (Moderate) | 24 (Moderate) | 29 (Moderate) | 36 (Unhealthy for Sensitive Groups) | 43 (Unhealthy for Sensitive Groups) | 49 (Unhealthy for Sensitive Groups) | 57 (Unhealthy) | 43 (Unhealthy for Sensitive Groups) | 44 (Unhealthy for Sensitive Groups) | 33 (Moderate) |
| co | 669 (Good) | 611 (Good) | 643 (Good) | 921 (Good) | 899 (Good) | 1 (Good) | 816 (Good) | 906 (Good) | 846 (Good) | 818 (Good) | 745 (Good) | 747 (Good) | 633 (Good) | 723 (Good) | 772 (Good) | 912 (Good) | 820 (Good) | 1 (Good) | 954 (Good) | 875 (Good) |
| no2 | 20 (Good) | 31 (Good) | 31 (Good) | 23 (Good) | 39 (Good) | 56 (Moderate) | 56 (Moderate) | 46 (Moderate) | 34 (Good) | 22 (Good) | 20 (Good) | 24 (Good) | 28 (Good) | 31 (Good) | 35 (Good) | 35 (Good) | 54 (Moderate) | 53 (Moderate) | 49 (Moderate) | 39 (Good) |
| o3 | 165 (Unhealthy) | 167 (Unhealthy) | 125 (Unhealthy for Sensitive Groups) | 87 (Moderate) | 62 (Good) | 67 (Good) | 99 (Moderate) | 123 (Unhealthy for Sensitive Groups) | 163 (Unhealthy) | 168 (Unhealthy) | 169 (Unhealthy) | 182 (Very Unhealthy) | 173 (Unhealthy) | 137 (Unhealthy for Sensitive Groups) | 111 (Moderate) | 80 (Moderate) | 66 (Good) | 47 (Good) | 84 (Moderate) | 112 (Moderate) |
| pm10 | 62 (Unhealthy for Sensitive Groups) | 68 (Unhealthy for Sensitive Groups) | 53 (Unhealthy for Sensitive Groups) | 45 (Moderate) | 74 (Unhealthy for Sensitive Groups) | 79 (Unhealthy for Sensitive Groups) | 87 (Unhealthy) | 80 (Unhealthy for Sensitive Groups) | 46 (Moderate) | 37 (Moderate) | 40 (Moderate) | 45 (Moderate) | 68 (Unhealthy for Sensitive Groups) | 65 (Unhealthy for Sensitive Groups) | 81 (Unhealthy) | 72 (Unhealthy for Sensitive Groups) | 90 (Unhealthy) | 76 (Unhealthy for Sensitive Groups) | 71 (Unhealthy for Sensitive Groups) | 69 (Unhealthy for Sensitive Groups) |
| so2 | 6.6 (Good) | 8.1 (Good) | 6.7 (Good) | 5.6 (Good) | 6 (Good) | 8.9 (Good) | 9.6 (Good) | 18 (Good) | 6.5 (Good) | 5.5 (Good) | 7.5 (Good) | 6.6 (Good) | 8.6 (Good) | 7.9 (Good) | 8.4 (Good) | 8.2 (Good) | 9.9 (Good) | 13 (Good) | 11 (Good) | 12 (Good) |
PM10 179 (Very bad Hazardous)
particulate matter (PM10) suspended dustPM2,5 35 (Unhealthy for Sensitive Groups)
particulate matter (PM2.5) dustO3 0.04 (Good)
ozone (O3)NO2 0 (Good)
nitrogen dioxide (NO2)SO2 0 (Good)
sulfur dioxide (SO2)雪浪
| index | 2022-05-27 |
|---|---|
| pm10 | 56 |
| pm25 | 56 |
| o3 | 0.03 |
| no2 | 0 |
| so2 | 0 |
雪浪
| index | 2020-05 | 2020-04 | 2020-03 | 2020-02 | 2020-01 | 2019-12 | 2019-11 | 2019-10 | 2019-09 | 2019-08 | 2019-07 | 2019-06 | 2019-05 | 2019-04 | 2019-03 | 2019-02 | 2019-01 | 2018-12 | 2018-11 | 2018-10 |
|---|---|---|---|---|---|---|---|---|---|---|---|---|---|---|---|---|---|---|---|---|
| pm25 | 36 | 31 | 28 | 30 | 55 | 53 | 38 | 40 | 23 | 17 | 19 | 24 | 29 | 36 | 43 | 49 | 57 | 43 | 44 | 33 |
| co | 669 | 611 | 643 | 921 | 899 | 1 | 816 | 906 | 846 | 818 | 745 | 747 | 633 | 723 | 772 | 912 | 820 | 1 | 954 | 875 |
| no2 | 20 | 31 | 31 | 23 | 39 | 56 | 56 | 46 | 34 | 22 | 20 | 24 | 28 | 31 | 35 | 35 | 54 | 53 | 49 | 39 |
| o3 | 165 | 167 | 125 | 87 | 62 | 67 | 99 | 123 | 163 | 168 | 169 | 182 | 173 | 137 | 111 | 80 | 66 | 47 | 84 | 112 |
| pm10 | 62 | 68 | 53 | 45 | 74 | 79 | 87 | 80 | 46 | 37 | 40 | 45 | 68 | 65 | 81 | 72 | 90 | 76 | 71 | 69 |
| so2 | 6.6 | 8.1 | 6.7 | 5.6 | 6 | 8.9 | 9.6 | 18 | 6.5 | 5.5 | 7.5 | 6.6 | 8.6 | 7.9 | 8.4 | 8.2 | 9.9 | 13 | 11 | 12 |