Air Pollution in Xinnongcun: Real-time Air Quality Index and smog alert.
Pollution and air quality forecast for Xinnongcun. Today is Tuesday, June 2, 2026. The following air pollution values have been recorded for Xinnongcun:- particulate matter (PM10) suspended dust - 179 (Very bad Hazardous)
- particulate matter (PM2.5) dust - 35 (Unhealthy for Sensitive Groups)
- ozone (O3) - 0 (Good)
- nitrogen dioxide (NO2) - 0 (Good)
- sulfur dioxide (SO2) - 0 (Good)

What is the air quality in Xinnongcun today? Is the air polluted in Xinnongcun?. Is there smog?
What is the level of PM10 today in Xinnongcun? (particulate matter (PM10) suspended dust)
The current level of particulate matter PM10 in Xinnongcun is:
179 (Very bad Hazardous)
The highest PM10 values usually occur in month: 101 (January 2019).
The lowest value of particulate matter PM10 pollution in Xinnongcun is usually recorded in: August (40).
What is the current level of PM2.5 in Xinnongcun? (particulate matter (PM2.5) dust)
Today's PM2.5 level is:
35 (Unhealthy for Sensitive Groups)
For comparison, the highest level of PM2.5 in Xinnongcun in the last 7 days was: 56 (Friday, May 27, 2022) and the lowest: 56 (Friday, May 27, 2022).
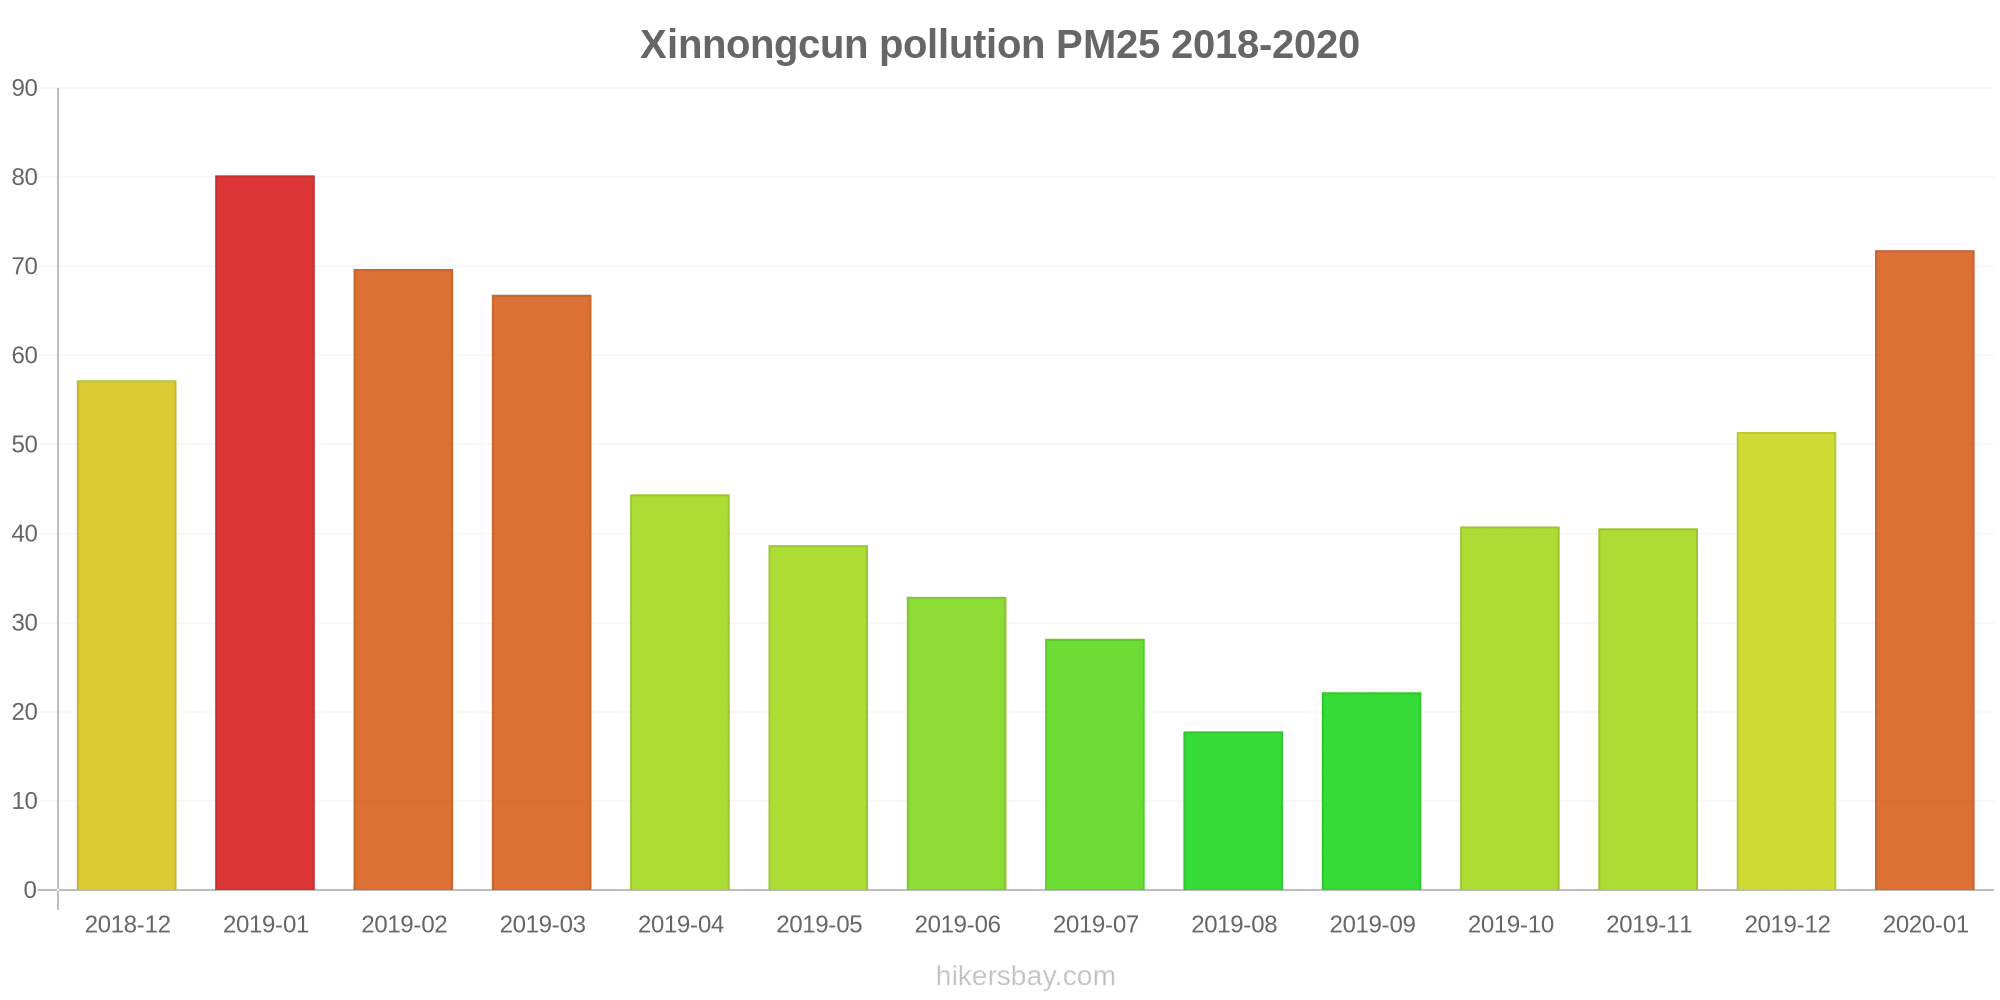
The highest PM2.5 values were recorded: 80 (January 2019).
The lowest level of particulate matter PM2.5 pollution occurs in month: August (18).
How is the O3 level today in Xinnongcun? (ozone (O3))
0 (Good)
How high is the level of NO2? (nitrogen dioxide (NO2))
0 (Good)
What is the level of SO2 pollution? (sulfur dioxide (SO2))
0 (Good)
Current data Friday, May 27, 2022, 12:00 PM
PM10 179 (Very bad Hazardous)
PM2,5 35 (Unhealthy for Sensitive Groups)
O3 0 (Good)
NO2 0 (Good)
SO2 0 (Good)
Data on air pollution from recent days in Xinnongcun
index
2022-05-27
pm10
56
Unhealthy for Sensitive Groups
pm25
56
Unhealthy
o3
0
Good
no2
0
Good
so2
0
Good
data source »
Air pollution in Xinnongcun from December 2018 to January 2020

index
2020-01
2019-12
2019-11
2019-10
2019-09
2019-08
2019-07
2019-06
2019-05
2019-04
2019-03
2019-02
2019-01
2018-12
pm25
72 (Unhealthy)
51 (Unhealthy for Sensitive Groups)
41 (Unhealthy for Sensitive Groups)
41 (Unhealthy for Sensitive Groups)
22 (Moderate)
18 (Moderate)
28 (Moderate)
33 (Moderate)
39 (Unhealthy for Sensitive Groups)
44 (Unhealthy for Sensitive Groups)
67 (Unhealthy)
70 (Unhealthy)
80 (Very Unhealthy)
57 (Unhealthy)
co
968 (Good)
814 (Good)
556 (Good)
670 (Good)
489 (Good)
540 (Good)
622 (Good)
568 (Good)
506 (Good)
603 (Good)
682 (Good)
815 (Good)
858 (Good)
632 (Good)
no2
39 (Good)
50 (Moderate)
45 (Moderate)
40 (Moderate)
24 (Good)
21 (Good)
30 (Good)
31 (Good)
41 (Moderate)
43 (Moderate)
48 (Moderate)
30 (Good)
42 (Moderate)
40 (Good)
o3
62 (Good)
72 (Moderate)
99 (Moderate)
124 (Unhealthy for Sensitive Groups)
136 (Unhealthy for Sensitive Groups)
154 (Unhealthy)
172 (Unhealthy)
181 (Very Unhealthy)
155 (Unhealthy)
130 (Unhealthy for Sensitive Groups)
120 (Unhealthy for Sensitive Groups)
90 (Moderate)
67 (Good)
63 (Good)
pm10
59 (Unhealthy for Sensitive Groups)
66 (Unhealthy for Sensitive Groups)
83 (Unhealthy)
83 (Unhealthy)
43 (Moderate)
40 (Moderate)
52 (Unhealthy for Sensitive Groups)
60 (Unhealthy for Sensitive Groups)
77 (Unhealthy for Sensitive Groups)
66 (Unhealthy for Sensitive Groups)
89 (Unhealthy)
73 (Unhealthy for Sensitive Groups)
101 (Unhealthy)
63 (Unhealthy for Sensitive Groups)
so2
6 (Good)
8.5 (Good)
9.2 (Good)
11 (Good)
8.5 (Good)
8 (Good)
8.9 (Good)
12 (Good)
12 (Good)
12 (Good)
12 (Good)
8.9 (Good)
11 (Good)
6.6 (Good)
data source »
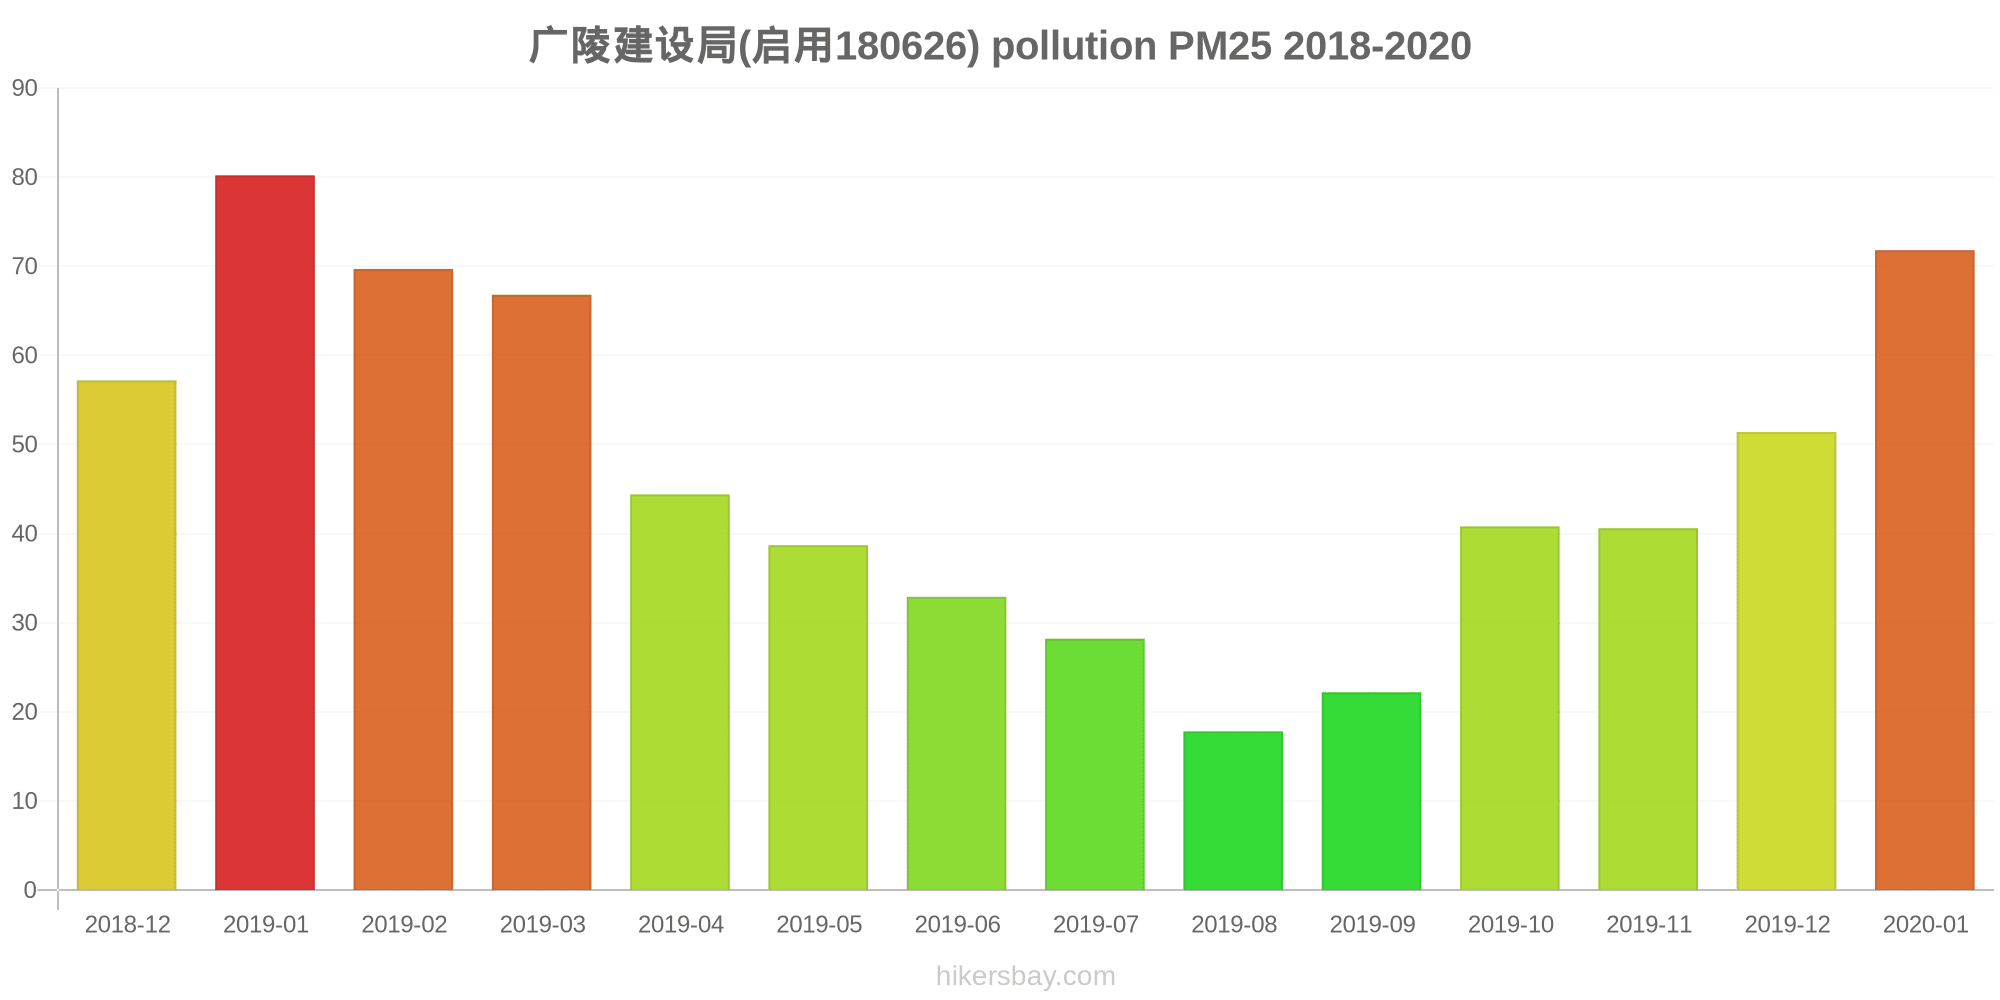
广陵建设局(启用180626)
Friday, May 27, 2022, 12:00 PM
PM10 179 (Very bad Hazardous)
particulate matter (PM10) suspended dust
PM2,5 35 (Unhealthy for Sensitive Groups)
particulate matter (PM2.5) dust
O3 0.04 (Good)
ozone (O3)
NO2 0 (Good)
nitrogen dioxide (NO2)
SO2 0 (Good)
sulfur dioxide (SO2)
广陵建设局(启用180626)
index
2022-05-27
pm10
56
pm25
56
o3
0.03
no2
0
so2
0
广陵建设局(启用180626)
2018-12 2020-01

index
2020-01
2019-12
2019-11
2019-10
2019-09
2019-08
2019-07
2019-06
2019-05
2019-04
2019-03
2019-02
2019-01
2018-12
pm25
72
51
41
41
22
18
28
33
39
44
67
70
80
57
co
968
814
556
670
489
540
622
568
506
603
682
815
858
632
no2
39
50
45
40
24
21
30
31
41
43
48
30
42
40
o3
62
72
99
124
136
154
172
181
155
130
120
90
67
63
pm10
59
66
83
83
43
40
52
60
77
66
89
73
101
63
so2
6
8.5
9.2
11
8.5
8
8.9
12
12
12
12
8.9
11
6.6
* Pollution data source:
https://openaq.org
()
The data is licensed under CC-By 4.0
PM10 179 (Very bad Hazardous)
PM2,5 35 (Unhealthy for Sensitive Groups)
O3 0 (Good)
NO2 0 (Good)
SO2 0 (Good)
Data on air pollution from recent days in Xinnongcun
| index | 2022-05-27 |
|---|---|
| pm10 | 56 Unhealthy for Sensitive Groups |
| pm25 | 56 Unhealthy |
| o3 | 0 Good |
| no2 | 0 Good |
| so2 | 0 Good |
| index | 2020-01 | 2019-12 | 2019-11 | 2019-10 | 2019-09 | 2019-08 | 2019-07 | 2019-06 | 2019-05 | 2019-04 | 2019-03 | 2019-02 | 2019-01 | 2018-12 |
|---|---|---|---|---|---|---|---|---|---|---|---|---|---|---|
| pm25 | 72 (Unhealthy) | 51 (Unhealthy for Sensitive Groups) | 41 (Unhealthy for Sensitive Groups) | 41 (Unhealthy for Sensitive Groups) | 22 (Moderate) | 18 (Moderate) | 28 (Moderate) | 33 (Moderate) | 39 (Unhealthy for Sensitive Groups) | 44 (Unhealthy for Sensitive Groups) | 67 (Unhealthy) | 70 (Unhealthy) | 80 (Very Unhealthy) | 57 (Unhealthy) |
| co | 968 (Good) | 814 (Good) | 556 (Good) | 670 (Good) | 489 (Good) | 540 (Good) | 622 (Good) | 568 (Good) | 506 (Good) | 603 (Good) | 682 (Good) | 815 (Good) | 858 (Good) | 632 (Good) |
| no2 | 39 (Good) | 50 (Moderate) | 45 (Moderate) | 40 (Moderate) | 24 (Good) | 21 (Good) | 30 (Good) | 31 (Good) | 41 (Moderate) | 43 (Moderate) | 48 (Moderate) | 30 (Good) | 42 (Moderate) | 40 (Good) |
| o3 | 62 (Good) | 72 (Moderate) | 99 (Moderate) | 124 (Unhealthy for Sensitive Groups) | 136 (Unhealthy for Sensitive Groups) | 154 (Unhealthy) | 172 (Unhealthy) | 181 (Very Unhealthy) | 155 (Unhealthy) | 130 (Unhealthy for Sensitive Groups) | 120 (Unhealthy for Sensitive Groups) | 90 (Moderate) | 67 (Good) | 63 (Good) |
| pm10 | 59 (Unhealthy for Sensitive Groups) | 66 (Unhealthy for Sensitive Groups) | 83 (Unhealthy) | 83 (Unhealthy) | 43 (Moderate) | 40 (Moderate) | 52 (Unhealthy for Sensitive Groups) | 60 (Unhealthy for Sensitive Groups) | 77 (Unhealthy for Sensitive Groups) | 66 (Unhealthy for Sensitive Groups) | 89 (Unhealthy) | 73 (Unhealthy for Sensitive Groups) | 101 (Unhealthy) | 63 (Unhealthy for Sensitive Groups) |
| so2 | 6 (Good) | 8.5 (Good) | 9.2 (Good) | 11 (Good) | 8.5 (Good) | 8 (Good) | 8.9 (Good) | 12 (Good) | 12 (Good) | 12 (Good) | 12 (Good) | 8.9 (Good) | 11 (Good) | 6.6 (Good) |
PM10 179 (Very bad Hazardous)
particulate matter (PM10) suspended dustPM2,5 35 (Unhealthy for Sensitive Groups)
particulate matter (PM2.5) dustO3 0.04 (Good)
ozone (O3)NO2 0 (Good)
nitrogen dioxide (NO2)SO2 0 (Good)
sulfur dioxide (SO2)广陵建设局(启用180626)
| index | 2022-05-27 |
|---|---|
| pm10 | 56 |
| pm25 | 56 |
| o3 | 0.03 |
| no2 | 0 |
| so2 | 0 |
广陵建设局(启用180626)
| index | 2020-01 | 2019-12 | 2019-11 | 2019-10 | 2019-09 | 2019-08 | 2019-07 | 2019-06 | 2019-05 | 2019-04 | 2019-03 | 2019-02 | 2019-01 | 2018-12 |
|---|---|---|---|---|---|---|---|---|---|---|---|---|---|---|
| pm25 | 72 | 51 | 41 | 41 | 22 | 18 | 28 | 33 | 39 | 44 | 67 | 70 | 80 | 57 |
| co | 968 | 814 | 556 | 670 | 489 | 540 | 622 | 568 | 506 | 603 | 682 | 815 | 858 | 632 |
| no2 | 39 | 50 | 45 | 40 | 24 | 21 | 30 | 31 | 41 | 43 | 48 | 30 | 42 | 40 |
| o3 | 62 | 72 | 99 | 124 | 136 | 154 | 172 | 181 | 155 | 130 | 120 | 90 | 67 | 63 |
| pm10 | 59 | 66 | 83 | 83 | 43 | 40 | 52 | 60 | 77 | 66 | 89 | 73 | 101 | 63 |
| so2 | 6 | 8.5 | 9.2 | 11 | 8.5 | 8 | 8.9 | 12 | 12 | 12 | 12 | 8.9 | 11 | 6.6 |