Air Pollution in Huangjincun: Real-time Air Quality Index and smog alert.
Pollution and air quality forecast for Huangjincun. Today is Tuesday, June 2, 2026. The following air pollution values have been recorded for Huangjincun:- particulate matter (PM10) suspended dust - 179 (Very bad Hazardous)
- particulate matter (PM2.5) dust - 35 (Unhealthy for Sensitive Groups)
- ozone (O3) - 0 (Good)
- nitrogen dioxide (NO2) - 0 (Good)
- sulfur dioxide (SO2) - 0 (Good)

What is the air quality in Huangjincun today? Is the air polluted in Huangjincun?. Is there smog?
What is the level of PM10 today in Huangjincun? (particulate matter (PM10) suspended dust)
The current level of particulate matter PM10 in Huangjincun is:
179 (Very bad Hazardous)
The highest PM10 values usually occur in month: 94 (January 2019).
The lowest value of particulate matter PM10 pollution in Huangjincun is usually recorded in: August (36).
What is the current level of PM2.5 in Huangjincun? (particulate matter (PM2.5) dust)
Today's PM2.5 level is:
35 (Unhealthy for Sensitive Groups)
For comparison, the highest level of PM2.5 in Huangjincun in the last 7 days was: 56 (Friday, May 27, 2022) and the lowest: 56 (Friday, May 27, 2022).
The highest PM2.5 values were recorded: 76 (January 2019).
The lowest level of particulate matter PM2.5 pollution occurs in month: August (19).
How is the O3 level today in Huangjincun? (ozone (O3))
0 (Good)
How high is the level of NO2? (nitrogen dioxide (NO2))
0 (Good)
What is the level of SO2 pollution? (sulfur dioxide (SO2))
0 (Good)
Current data Friday, May 27, 2022, 12:00 PM
PM10 179 (Very bad Hazardous)
PM2,5 35 (Unhealthy for Sensitive Groups)
O3 0 (Good)
NO2 0 (Good)
SO2 0 (Good)
Data on air pollution from recent days in Huangjincun
index
2022-05-27
pm10
56
Unhealthy for Sensitive Groups
pm25
56
Unhealthy
o3
0
Good
no2
0
Good
so2
0
Good
data source »
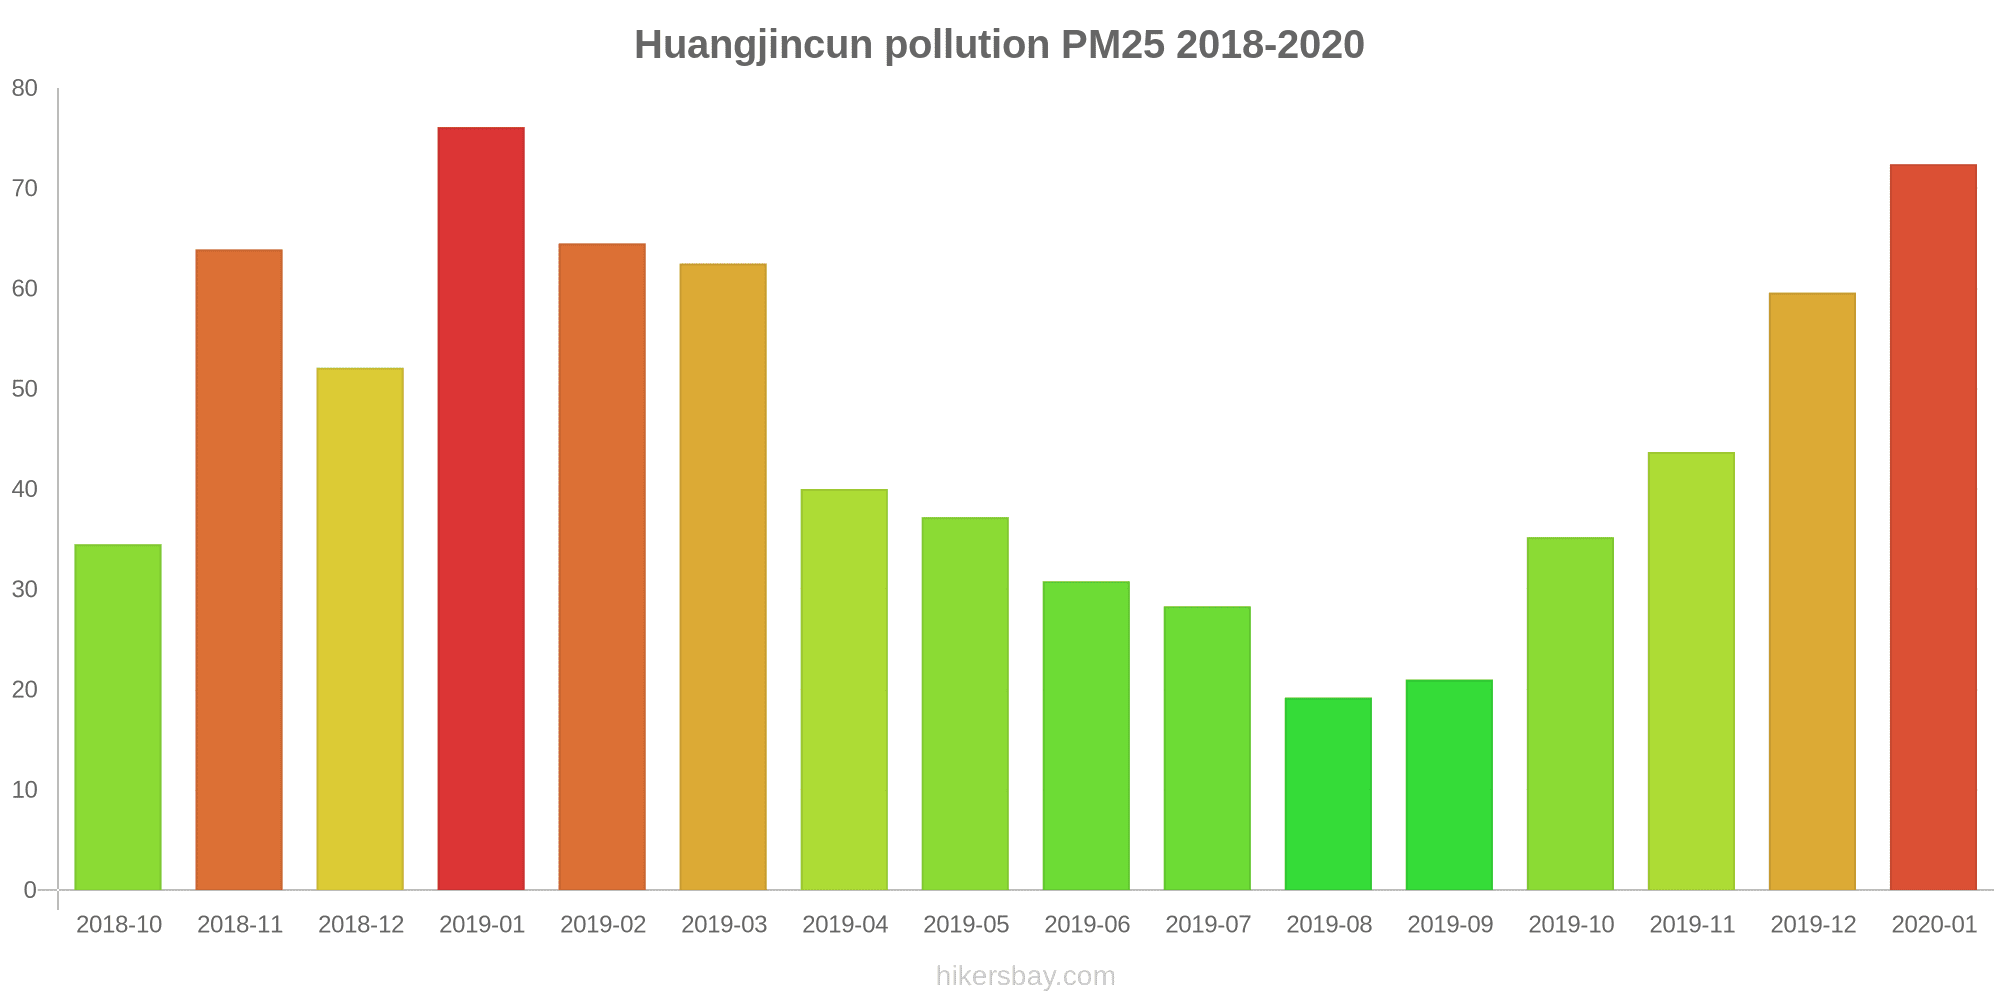
Air pollution in Huangjincun from October 2018 to January 2020

index
2020-01
2019-12
2019-11
2019-10
2019-09
2019-08
2019-07
2019-06
2019-05
2019-04
2019-03
2019-02
2019-01
2018-12
2018-11
2018-10
pm25
72 (Unhealthy)
60 (Unhealthy)
44 (Unhealthy for Sensitive Groups)
35 (Unhealthy for Sensitive Groups)
21 (Moderate)
19 (Moderate)
28 (Moderate)
31 (Moderate)
37 (Unhealthy for Sensitive Groups)
40 (Unhealthy for Sensitive Groups)
63 (Unhealthy)
65 (Unhealthy)
76 (Very Unhealthy)
52 (Unhealthy for Sensitive Groups)
64 (Unhealthy)
35 (Moderate)
co
952 (Good)
818 (Good)
439 (Good)
585 (Good)
424 (Good)
456 (Good)
509 (Good)
451 (Good)
445 (Good)
667 (Good)
620 (Good)
682 (Good)
810 (Good)
784 (Good)
936 (Good)
667 (Good)
no2
35 (Good)
48 (Moderate)
43 (Moderate)
33 (Good)
18 (Good)
16 (Good)
23 (Good)
23 (Good)
31 (Good)
31 (Good)
45 (Moderate)
26 (Good)
43 (Moderate)
37 (Good)
41 (Moderate)
39 (Good)
o3
55 (Good)
65 (Good)
97 (Moderate)
123 (Unhealthy for Sensitive Groups)
137 (Unhealthy for Sensitive Groups)
158 (Unhealthy)
173 (Unhealthy)
185 (Very Unhealthy)
173 (Unhealthy)
137 (Unhealthy for Sensitive Groups)
122 (Unhealthy for Sensitive Groups)
92 (Moderate)
83 (Moderate)
69 (Good)
90 (Moderate)
117 (Moderate)
pm10
58 (Unhealthy for Sensitive Groups)
75 (Unhealthy for Sensitive Groups)
85 (Unhealthy)
77 (Unhealthy for Sensitive Groups)
41 (Moderate)
36 (Moderate)
48 (Moderate)
50 (Moderate)
64 (Unhealthy for Sensitive Groups)
58 (Unhealthy for Sensitive Groups)
80 (Unhealthy for Sensitive Groups)
70 (Unhealthy for Sensitive Groups)
94 (Unhealthy)
89 (Unhealthy)
83 (Unhealthy)
57 (Unhealthy for Sensitive Groups)
so2
9.4 (Good)
8.7 (Good)
9.1 (Good)
12 (Good)
8.6 (Good)
10 (Good)
11 (Good)
8.5 (Good)
8.6 (Good)
13 (Good)
15 (Good)
7.3 (Good)
9.1 (Good)
10 (Good)
8.7 (Good)
8.1 (Good)
data source »
五台山医院(启用161107)
Friday, May 27, 2022, 12:00 PM
PM10 179 (Very bad Hazardous)
particulate matter (PM10) suspended dust
PM2,5 35 (Unhealthy for Sensitive Groups)
particulate matter (PM2.5) dust
O3 0.04 (Good)
ozone (O3)
NO2 0 (Good)
nitrogen dioxide (NO2)
SO2 0 (Good)
sulfur dioxide (SO2)
五台山医院(启用161107)
index
2022-05-27
pm10
56
pm25
56
o3
0.03
no2
0
so2
0
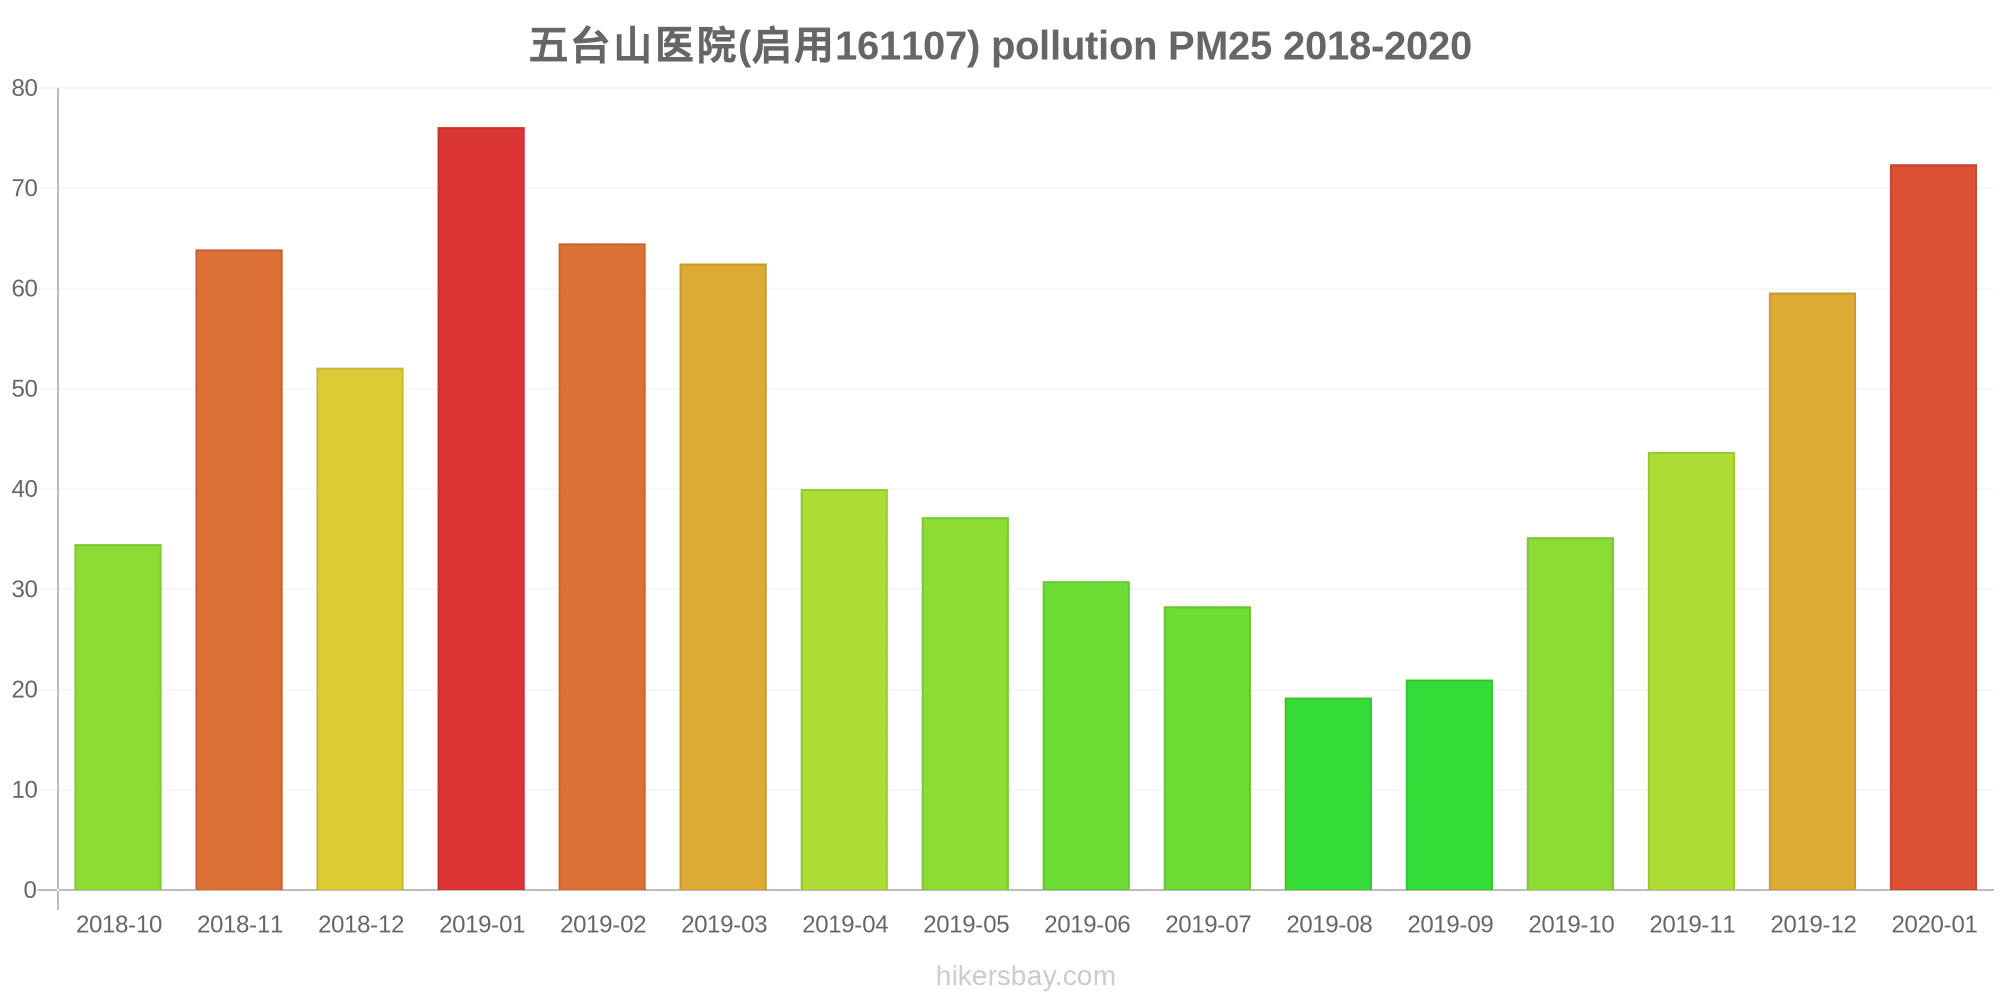
五台山医院(启用161107)
2018-10 2020-01

index
2020-01
2019-12
2019-11
2019-10
2019-09
2019-08
2019-07
2019-06
2019-05
2019-04
2019-03
2019-02
2019-01
2018-12
2018-11
2018-10
pm25
72
60
44
35
21
19
28
31
37
40
63
65
76
52
64
35
co
952
818
439
585
424
456
509
451
445
667
620
682
810
784
936
667
no2
35
48
43
33
18
16
23
23
31
31
45
26
43
37
41
39
o3
55
65
97
123
137
158
173
185
173
137
122
92
83
69
90
117
pm10
58
75
85
77
41
36
48
50
64
58
80
70
94
89
83
57
so2
9.4
8.7
9.1
12
8.6
10
11
8.5
8.6
13
15
7.3
9.1
10
8.7
8.1
* Pollution data source:
https://openaq.org
()
The data is licensed under CC-By 4.0
PM10 179 (Very bad Hazardous)
PM2,5 35 (Unhealthy for Sensitive Groups)
O3 0 (Good)
NO2 0 (Good)
SO2 0 (Good)
Data on air pollution from recent days in Huangjincun
| index | 2022-05-27 |
|---|---|
| pm10 | 56 Unhealthy for Sensitive Groups |
| pm25 | 56 Unhealthy |
| o3 | 0 Good |
| no2 | 0 Good |
| so2 | 0 Good |
| index | 2020-01 | 2019-12 | 2019-11 | 2019-10 | 2019-09 | 2019-08 | 2019-07 | 2019-06 | 2019-05 | 2019-04 | 2019-03 | 2019-02 | 2019-01 | 2018-12 | 2018-11 | 2018-10 |
|---|---|---|---|---|---|---|---|---|---|---|---|---|---|---|---|---|
| pm25 | 72 (Unhealthy) | 60 (Unhealthy) | 44 (Unhealthy for Sensitive Groups) | 35 (Unhealthy for Sensitive Groups) | 21 (Moderate) | 19 (Moderate) | 28 (Moderate) | 31 (Moderate) | 37 (Unhealthy for Sensitive Groups) | 40 (Unhealthy for Sensitive Groups) | 63 (Unhealthy) | 65 (Unhealthy) | 76 (Very Unhealthy) | 52 (Unhealthy for Sensitive Groups) | 64 (Unhealthy) | 35 (Moderate) |
| co | 952 (Good) | 818 (Good) | 439 (Good) | 585 (Good) | 424 (Good) | 456 (Good) | 509 (Good) | 451 (Good) | 445 (Good) | 667 (Good) | 620 (Good) | 682 (Good) | 810 (Good) | 784 (Good) | 936 (Good) | 667 (Good) |
| no2 | 35 (Good) | 48 (Moderate) | 43 (Moderate) | 33 (Good) | 18 (Good) | 16 (Good) | 23 (Good) | 23 (Good) | 31 (Good) | 31 (Good) | 45 (Moderate) | 26 (Good) | 43 (Moderate) | 37 (Good) | 41 (Moderate) | 39 (Good) |
| o3 | 55 (Good) | 65 (Good) | 97 (Moderate) | 123 (Unhealthy for Sensitive Groups) | 137 (Unhealthy for Sensitive Groups) | 158 (Unhealthy) | 173 (Unhealthy) | 185 (Very Unhealthy) | 173 (Unhealthy) | 137 (Unhealthy for Sensitive Groups) | 122 (Unhealthy for Sensitive Groups) | 92 (Moderate) | 83 (Moderate) | 69 (Good) | 90 (Moderate) | 117 (Moderate) |
| pm10 | 58 (Unhealthy for Sensitive Groups) | 75 (Unhealthy for Sensitive Groups) | 85 (Unhealthy) | 77 (Unhealthy for Sensitive Groups) | 41 (Moderate) | 36 (Moderate) | 48 (Moderate) | 50 (Moderate) | 64 (Unhealthy for Sensitive Groups) | 58 (Unhealthy for Sensitive Groups) | 80 (Unhealthy for Sensitive Groups) | 70 (Unhealthy for Sensitive Groups) | 94 (Unhealthy) | 89 (Unhealthy) | 83 (Unhealthy) | 57 (Unhealthy for Sensitive Groups) |
| so2 | 9.4 (Good) | 8.7 (Good) | 9.1 (Good) | 12 (Good) | 8.6 (Good) | 10 (Good) | 11 (Good) | 8.5 (Good) | 8.6 (Good) | 13 (Good) | 15 (Good) | 7.3 (Good) | 9.1 (Good) | 10 (Good) | 8.7 (Good) | 8.1 (Good) |
PM10 179 (Very bad Hazardous)
particulate matter (PM10) suspended dustPM2,5 35 (Unhealthy for Sensitive Groups)
particulate matter (PM2.5) dustO3 0.04 (Good)
ozone (O3)NO2 0 (Good)
nitrogen dioxide (NO2)SO2 0 (Good)
sulfur dioxide (SO2)五台山医院(启用161107)
| index | 2022-05-27 |
|---|---|
| pm10 | 56 |
| pm25 | 56 |
| o3 | 0.03 |
| no2 | 0 |
| so2 | 0 |
五台山医院(启用161107)
| index | 2020-01 | 2019-12 | 2019-11 | 2019-10 | 2019-09 | 2019-08 | 2019-07 | 2019-06 | 2019-05 | 2019-04 | 2019-03 | 2019-02 | 2019-01 | 2018-12 | 2018-11 | 2018-10 |
|---|---|---|---|---|---|---|---|---|---|---|---|---|---|---|---|---|
| pm25 | 72 | 60 | 44 | 35 | 21 | 19 | 28 | 31 | 37 | 40 | 63 | 65 | 76 | 52 | 64 | 35 |
| co | 952 | 818 | 439 | 585 | 424 | 456 | 509 | 451 | 445 | 667 | 620 | 682 | 810 | 784 | 936 | 667 |
| no2 | 35 | 48 | 43 | 33 | 18 | 16 | 23 | 23 | 31 | 31 | 45 | 26 | 43 | 37 | 41 | 39 |
| o3 | 55 | 65 | 97 | 123 | 137 | 158 | 173 | 185 | 173 | 137 | 122 | 92 | 83 | 69 | 90 | 117 |
| pm10 | 58 | 75 | 85 | 77 | 41 | 36 | 48 | 50 | 64 | 58 | 80 | 70 | 94 | 89 | 83 | 57 |
| so2 | 9.4 | 8.7 | 9.1 | 12 | 8.6 | 10 | 11 | 8.5 | 8.6 | 13 | 15 | 7.3 | 9.1 | 10 | 8.7 | 8.1 |