Air Pollution in Wangying: Real-time Air Quality Index and smog alert.
Pollution and air quality forecast for Wangying. Today is Tuesday, June 2, 2026. The following air pollution values have been recorded for Wangying:- particulate matter (PM10) suspended dust - 179 (Very bad Hazardous)
- particulate matter (PM2.5) dust - 35 (Unhealthy for Sensitive Groups)
- ozone (O3) - 0 (Good)
- nitrogen dioxide (NO2) - 0 (Good)
- sulfur dioxide (SO2) - 0 (Good)

What is the air quality in Wangying today? Is the air polluted in Wangying?. Is there smog?
What is the level of PM10 today in Wangying? (particulate matter (PM10) suspended dust)
The current level of particulate matter PM10 in Wangying is:
179 (Very bad Hazardous)
The highest PM10 values usually occur in month: 92 (March 2019).
The lowest value of particulate matter PM10 pollution in Wangying is usually recorded in: August (37).
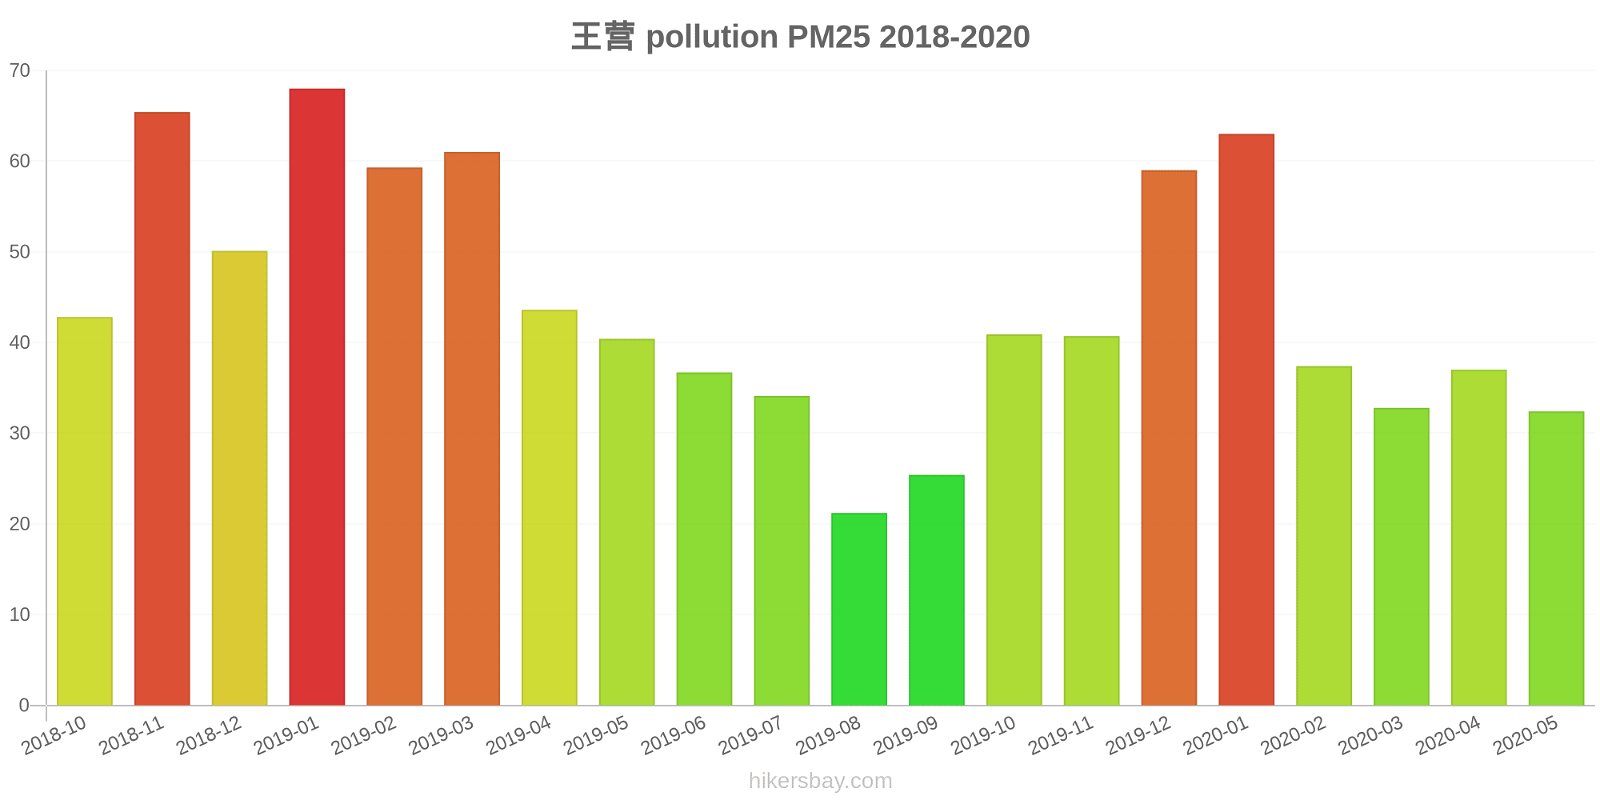
What is the current level of PM2.5 in Wangying? (particulate matter (PM2.5) dust)
Today's PM2.5 level is:
35 (Unhealthy for Sensitive Groups)
For comparison, the highest level of PM2.5 in Wangying in the last 7 days was: 56 (Friday, May 27, 2022) and the lowest: 56 (Friday, May 27, 2022).
The highest PM2.5 values were recorded: 68 (January 2019).
The lowest level of particulate matter PM2.5 pollution occurs in month: August (21).
How is the O3 level today in Wangying? (ozone (O3))
0 (Good)
How high is the level of NO2? (nitrogen dioxide (NO2))
0 (Good)
What is the level of SO2 pollution? (sulfur dioxide (SO2))
0 (Good)
Current data Friday, May 27, 2022, 12:00 PM
PM10 179 (Very bad Hazardous)
PM2,5 35 (Unhealthy for Sensitive Groups)
O3 0 (Good)
NO2 0 (Good)
SO2 0 (Good)
Data on air pollution from recent days in Wangying
index
2022-05-27
pm10
56
Unhealthy for Sensitive Groups
pm25
56
Unhealthy
o3
0
Good
no2
0
Good
so2
0
Good
data source »
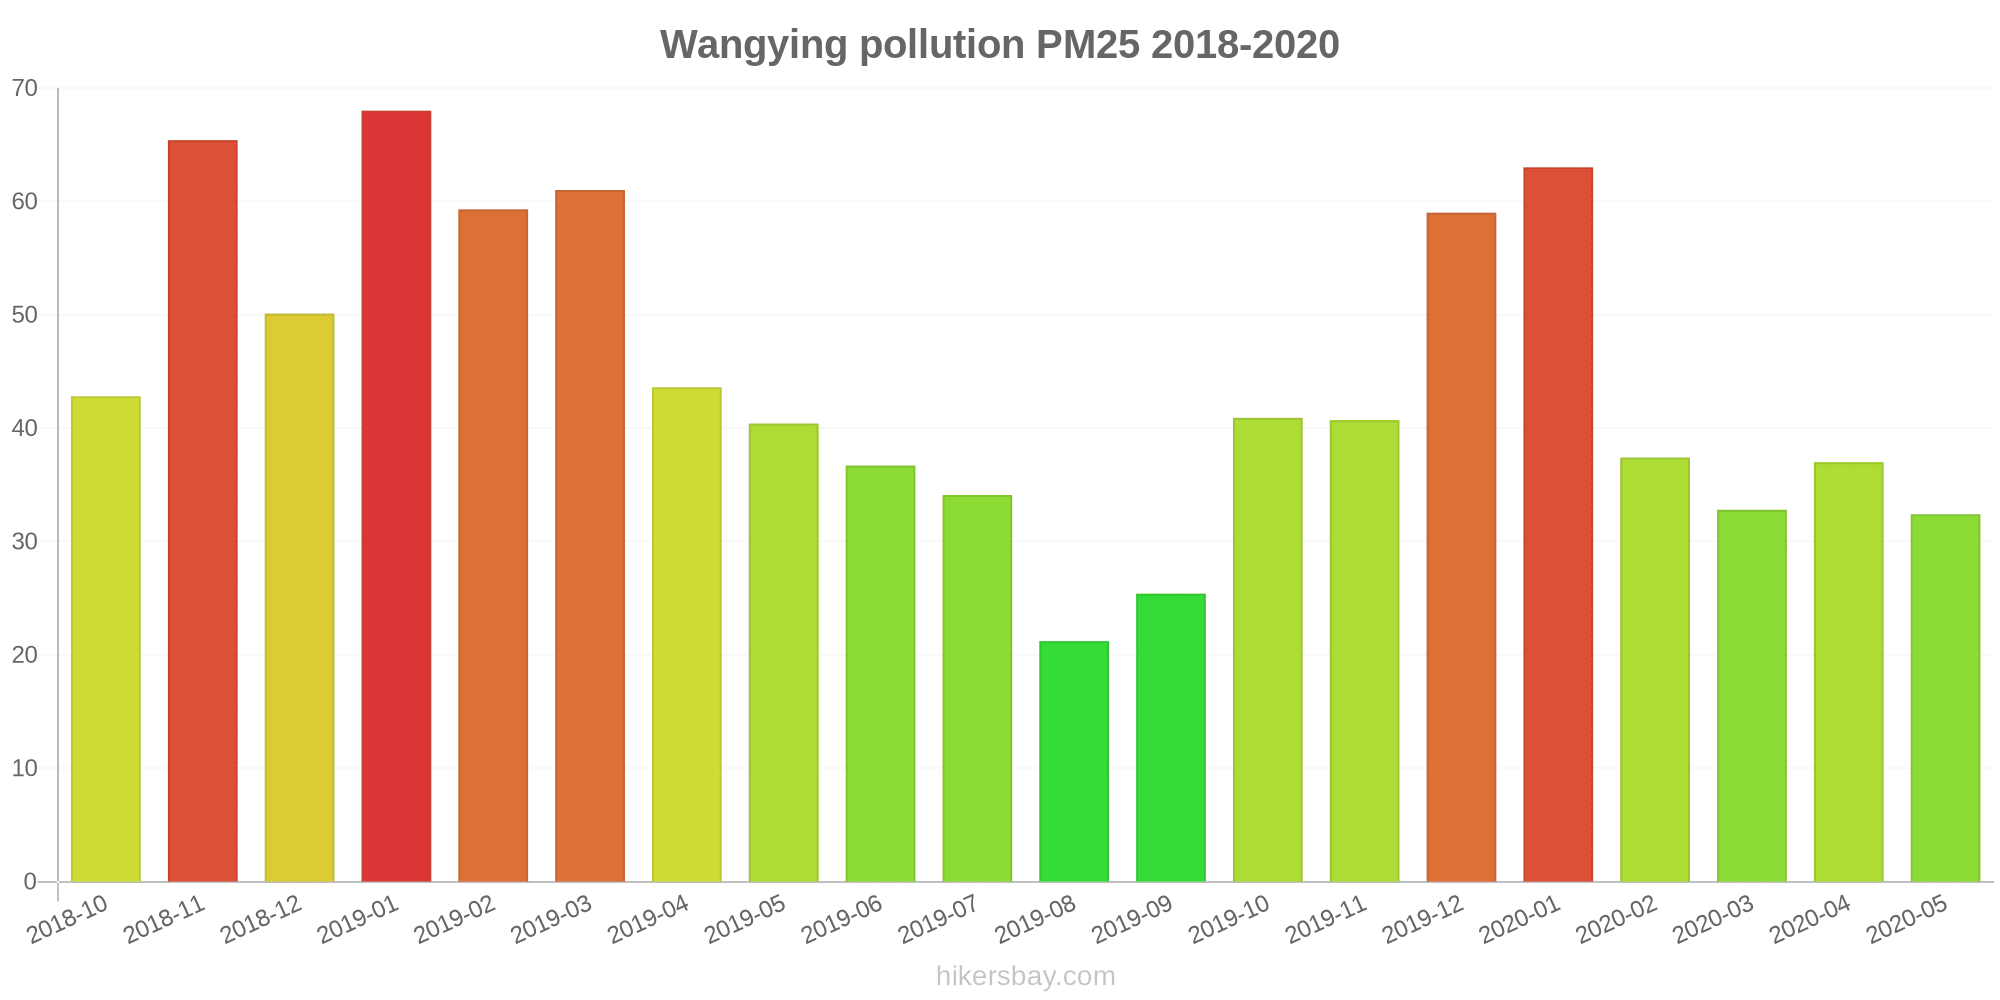
Air pollution in Wangying from October 2018 to May 2020

index
2020-05
2020-04
2020-03
2020-02
2020-01
2019-12
2019-11
2019-10
2019-09
2019-08
2019-07
2019-06
2019-05
2019-04
2019-03
2019-02
2019-01
2018-12
2018-11
2018-10
pm25
32 (Moderate)
37 (Unhealthy for Sensitive Groups)
33 (Moderate)
37 (Unhealthy for Sensitive Groups)
63 (Unhealthy)
59 (Unhealthy)
41 (Unhealthy for Sensitive Groups)
41 (Unhealthy for Sensitive Groups)
25 (Moderate)
21 (Moderate)
34 (Moderate)
37 (Unhealthy for Sensitive Groups)
40 (Unhealthy for Sensitive Groups)
44 (Unhealthy for Sensitive Groups)
61 (Unhealthy)
59 (Unhealthy)
68 (Unhealthy)
50 (Unhealthy for Sensitive Groups)
65 (Unhealthy)
43 (Unhealthy for Sensitive Groups)
co
916 (Good)
745 (Good)
755 (Good)
809 (Good)
1 (Good)
893 (Good)
707 (Good)
769 (Good)
674 (Good)
731 (Good)
846 (Good)
771 (Good)
659 (Good)
908 (Good)
931 (Good)
801 (Good)
776 (Good)
516 (Good)
911 (Good)
731 (Good)
no2
24 (Good)
33 (Good)
30 (Good)
18 (Good)
24 (Good)
39 (Good)
34 (Good)
31 (Good)
19 (Good)
16 (Good)
17 (Good)
23 (Good)
38 (Good)
32 (Good)
38 (Good)
24 (Good)
42 (Moderate)
37 (Good)
38 (Good)
39 (Good)
o3
148 (Unhealthy for Sensitive Groups)
153 (Unhealthy)
116 (Moderate)
97 (Moderate)
77 (Moderate)
74 (Moderate)
104 (Moderate)
125 (Unhealthy for Sensitive Groups)
128 (Unhealthy for Sensitive Groups)
151 (Unhealthy)
162 (Unhealthy)
191 (Very Unhealthy)
172 (Unhealthy)
143 (Unhealthy for Sensitive Groups)
130 (Unhealthy for Sensitive Groups)
98 (Moderate)
80 (Moderate)
68 (Good)
97 (Moderate)
123 (Unhealthy for Sensitive Groups)
pm10
49 (Moderate)
68 (Unhealthy for Sensitive Groups)
61 (Unhealthy for Sensitive Groups)
56 (Unhealthy for Sensitive Groups)
86 (Unhealthy)
89 (Unhealthy)
84 (Unhealthy)
79 (Unhealthy for Sensitive Groups)
43 (Moderate)
37 (Moderate)
44 (Moderate)
57 (Unhealthy for Sensitive Groups)
75 (Unhealthy for Sensitive Groups)
69 (Unhealthy for Sensitive Groups)
92 (Unhealthy)
78 (Unhealthy for Sensitive Groups)
92 (Unhealthy)
72 (Unhealthy for Sensitive Groups)
80 (Unhealthy)
66 (Unhealthy for Sensitive Groups)
so2
4.5 (Good)
6.7 (Good)
7 (Good)
6 (Good)
5.2 (Good)
7.7 (Good)
6.5 (Good)
6.1 (Good)
4.1 (Good)
4.7 (Good)
6.6 (Good)
8 (Good)
10 (Good)
9.1 (Good)
8.4 (Good)
4.8 (Good)
9.9 (Good)
11 (Good)
8.3 (Good)
9.2 (Good)
data source »
王营
Friday, May 27, 2022, 12:00 PM
PM10 179 (Very bad Hazardous)
particulate matter (PM10) suspended dust
PM2,5 35 (Unhealthy for Sensitive Groups)
particulate matter (PM2.5) dust
O3 0.04 (Good)
ozone (O3)
NO2 0 (Good)
nitrogen dioxide (NO2)
SO2 0 (Good)
sulfur dioxide (SO2)
王营
index
2022-05-27
pm10
56
pm25
56
o3
0.03
no2
0
so2
0
王营
2018-10 2020-05
index
2020-05
2020-04
2020-03
2020-02
2020-01
2019-12
2019-11
2019-10
2019-09
2019-08
2019-07
2019-06
2019-05
2019-04
2019-03
2019-02
2019-01
2018-12
2018-11
2018-10
pm25
32
37
33
37
63
59
41
41
25
21
34
37
40
44
61
59
68
50
65
43
co
916
745
755
809
1
893
707
769
674
731
846
771
659
908
931
801
776
516
911
731
no2
24
33
30
18
24
39
34
31
19
16
17
23
38
32
38
24
42
37
38
39
o3
148
153
116
97
77
74
104
125
128
151
162
191
172
143
130
98
80
68
97
123
pm10
49
68
61
56
86
89
84
79
43
37
44
57
75
69
92
78
92
72
80
66
so2
4.5
6.7
7
6
5.2
7.7
6.5
6.1
4.1
4.7
6.6
8
10
9.1
8.4
4.8
9.9
11
8.3
9.2
* Pollution data source:
https://openaq.org
(ChinaAQIData)
The data is licensed under CC-By 4.0
PM10 179 (Very bad Hazardous)
PM2,5 35 (Unhealthy for Sensitive Groups)
O3 0 (Good)
NO2 0 (Good)
SO2 0 (Good)
Data on air pollution from recent days in Wangying
| index | 2022-05-27 |
|---|---|
| pm10 | 56 Unhealthy for Sensitive Groups |
| pm25 | 56 Unhealthy |
| o3 | 0 Good |
| no2 | 0 Good |
| so2 | 0 Good |
| index | 2020-05 | 2020-04 | 2020-03 | 2020-02 | 2020-01 | 2019-12 | 2019-11 | 2019-10 | 2019-09 | 2019-08 | 2019-07 | 2019-06 | 2019-05 | 2019-04 | 2019-03 | 2019-02 | 2019-01 | 2018-12 | 2018-11 | 2018-10 |
|---|---|---|---|---|---|---|---|---|---|---|---|---|---|---|---|---|---|---|---|---|
| pm25 | 32 (Moderate) | 37 (Unhealthy for Sensitive Groups) | 33 (Moderate) | 37 (Unhealthy for Sensitive Groups) | 63 (Unhealthy) | 59 (Unhealthy) | 41 (Unhealthy for Sensitive Groups) | 41 (Unhealthy for Sensitive Groups) | 25 (Moderate) | 21 (Moderate) | 34 (Moderate) | 37 (Unhealthy for Sensitive Groups) | 40 (Unhealthy for Sensitive Groups) | 44 (Unhealthy for Sensitive Groups) | 61 (Unhealthy) | 59 (Unhealthy) | 68 (Unhealthy) | 50 (Unhealthy for Sensitive Groups) | 65 (Unhealthy) | 43 (Unhealthy for Sensitive Groups) |
| co | 916 (Good) | 745 (Good) | 755 (Good) | 809 (Good) | 1 (Good) | 893 (Good) | 707 (Good) | 769 (Good) | 674 (Good) | 731 (Good) | 846 (Good) | 771 (Good) | 659 (Good) | 908 (Good) | 931 (Good) | 801 (Good) | 776 (Good) | 516 (Good) | 911 (Good) | 731 (Good) |
| no2 | 24 (Good) | 33 (Good) | 30 (Good) | 18 (Good) | 24 (Good) | 39 (Good) | 34 (Good) | 31 (Good) | 19 (Good) | 16 (Good) | 17 (Good) | 23 (Good) | 38 (Good) | 32 (Good) | 38 (Good) | 24 (Good) | 42 (Moderate) | 37 (Good) | 38 (Good) | 39 (Good) |
| o3 | 148 (Unhealthy for Sensitive Groups) | 153 (Unhealthy) | 116 (Moderate) | 97 (Moderate) | 77 (Moderate) | 74 (Moderate) | 104 (Moderate) | 125 (Unhealthy for Sensitive Groups) | 128 (Unhealthy for Sensitive Groups) | 151 (Unhealthy) | 162 (Unhealthy) | 191 (Very Unhealthy) | 172 (Unhealthy) | 143 (Unhealthy for Sensitive Groups) | 130 (Unhealthy for Sensitive Groups) | 98 (Moderate) | 80 (Moderate) | 68 (Good) | 97 (Moderate) | 123 (Unhealthy for Sensitive Groups) |
| pm10 | 49 (Moderate) | 68 (Unhealthy for Sensitive Groups) | 61 (Unhealthy for Sensitive Groups) | 56 (Unhealthy for Sensitive Groups) | 86 (Unhealthy) | 89 (Unhealthy) | 84 (Unhealthy) | 79 (Unhealthy for Sensitive Groups) | 43 (Moderate) | 37 (Moderate) | 44 (Moderate) | 57 (Unhealthy for Sensitive Groups) | 75 (Unhealthy for Sensitive Groups) | 69 (Unhealthy for Sensitive Groups) | 92 (Unhealthy) | 78 (Unhealthy for Sensitive Groups) | 92 (Unhealthy) | 72 (Unhealthy for Sensitive Groups) | 80 (Unhealthy) | 66 (Unhealthy for Sensitive Groups) |
| so2 | 4.5 (Good) | 6.7 (Good) | 7 (Good) | 6 (Good) | 5.2 (Good) | 7.7 (Good) | 6.5 (Good) | 6.1 (Good) | 4.1 (Good) | 4.7 (Good) | 6.6 (Good) | 8 (Good) | 10 (Good) | 9.1 (Good) | 8.4 (Good) | 4.8 (Good) | 9.9 (Good) | 11 (Good) | 8.3 (Good) | 9.2 (Good) |
PM10 179 (Very bad Hazardous)
particulate matter (PM10) suspended dustPM2,5 35 (Unhealthy for Sensitive Groups)
particulate matter (PM2.5) dustO3 0.04 (Good)
ozone (O3)NO2 0 (Good)
nitrogen dioxide (NO2)SO2 0 (Good)
sulfur dioxide (SO2)王营
| index | 2022-05-27 |
|---|---|
| pm10 | 56 |
| pm25 | 56 |
| o3 | 0.03 |
| no2 | 0 |
| so2 | 0 |
王营

| index | 2020-05 | 2020-04 | 2020-03 | 2020-02 | 2020-01 | 2019-12 | 2019-11 | 2019-10 | 2019-09 | 2019-08 | 2019-07 | 2019-06 | 2019-05 | 2019-04 | 2019-03 | 2019-02 | 2019-01 | 2018-12 | 2018-11 | 2018-10 |
|---|---|---|---|---|---|---|---|---|---|---|---|---|---|---|---|---|---|---|---|---|
| pm25 | 32 | 37 | 33 | 37 | 63 | 59 | 41 | 41 | 25 | 21 | 34 | 37 | 40 | 44 | 61 | 59 | 68 | 50 | 65 | 43 |
| co | 916 | 745 | 755 | 809 | 1 | 893 | 707 | 769 | 674 | 731 | 846 | 771 | 659 | 908 | 931 | 801 | 776 | 516 | 911 | 731 |
| no2 | 24 | 33 | 30 | 18 | 24 | 39 | 34 | 31 | 19 | 16 | 17 | 23 | 38 | 32 | 38 | 24 | 42 | 37 | 38 | 39 |
| o3 | 148 | 153 | 116 | 97 | 77 | 74 | 104 | 125 | 128 | 151 | 162 | 191 | 172 | 143 | 130 | 98 | 80 | 68 | 97 | 123 |
| pm10 | 49 | 68 | 61 | 56 | 86 | 89 | 84 | 79 | 43 | 37 | 44 | 57 | 75 | 69 | 92 | 78 | 92 | 72 | 80 | 66 |
| so2 | 4.5 | 6.7 | 7 | 6 | 5.2 | 7.7 | 6.5 | 6.1 | 4.1 | 4.7 | 6.6 | 8 | 10 | 9.1 | 8.4 | 4.8 | 9.9 | 11 | 8.3 | 9.2 |