Air Pollution in Fangshencun: Real-time Air Quality Index and smog alert.
Pollution and air quality forecast for Fangshencun. Today is Tuesday, June 16, 2026. The following air pollution values have been recorded for Fangshencun:- nitrogen dioxide (NO2) - 7 (Good)
- particulate matter (PM10) suspended dust - 19 (Good)
- ozone (O3) - 91 (Moderate)
- particulate matter (PM2.5) dust - 10 (Good)
- sulfur dioxide (SO2) - 0 (Good)
- carbon monoxide (CO) - 100 (Good)

What is the air quality in Fangshencun today? Is the air polluted in Fangshencun?. Is there smog?
How high is the level of NO2? (nitrogen dioxide (NO2))
7 (Good)
What is the level of PM10 today in Fangshencun? (particulate matter (PM10) suspended dust)
The current level of particulate matter PM10 in Fangshencun is:
19 (Good)
The highest PM10 values usually occur in month: 206 (January 2020).
The lowest value of particulate matter PM10 pollution in Fangshencun is usually recorded in: August (33).
How is the O3 level today in Fangshencun? (ozone (O3))
91 (Moderate)
What is the current level of PM2.5 in Fangshencun? (particulate matter (PM2.5) dust)
Today's PM2.5 level is:
10 (Good)
For comparison, the highest level of PM2.5 in Fangshencun in the last 7 days was: 20 (Friday, May 27, 2022) and the lowest: 20 (Friday, May 27, 2022).
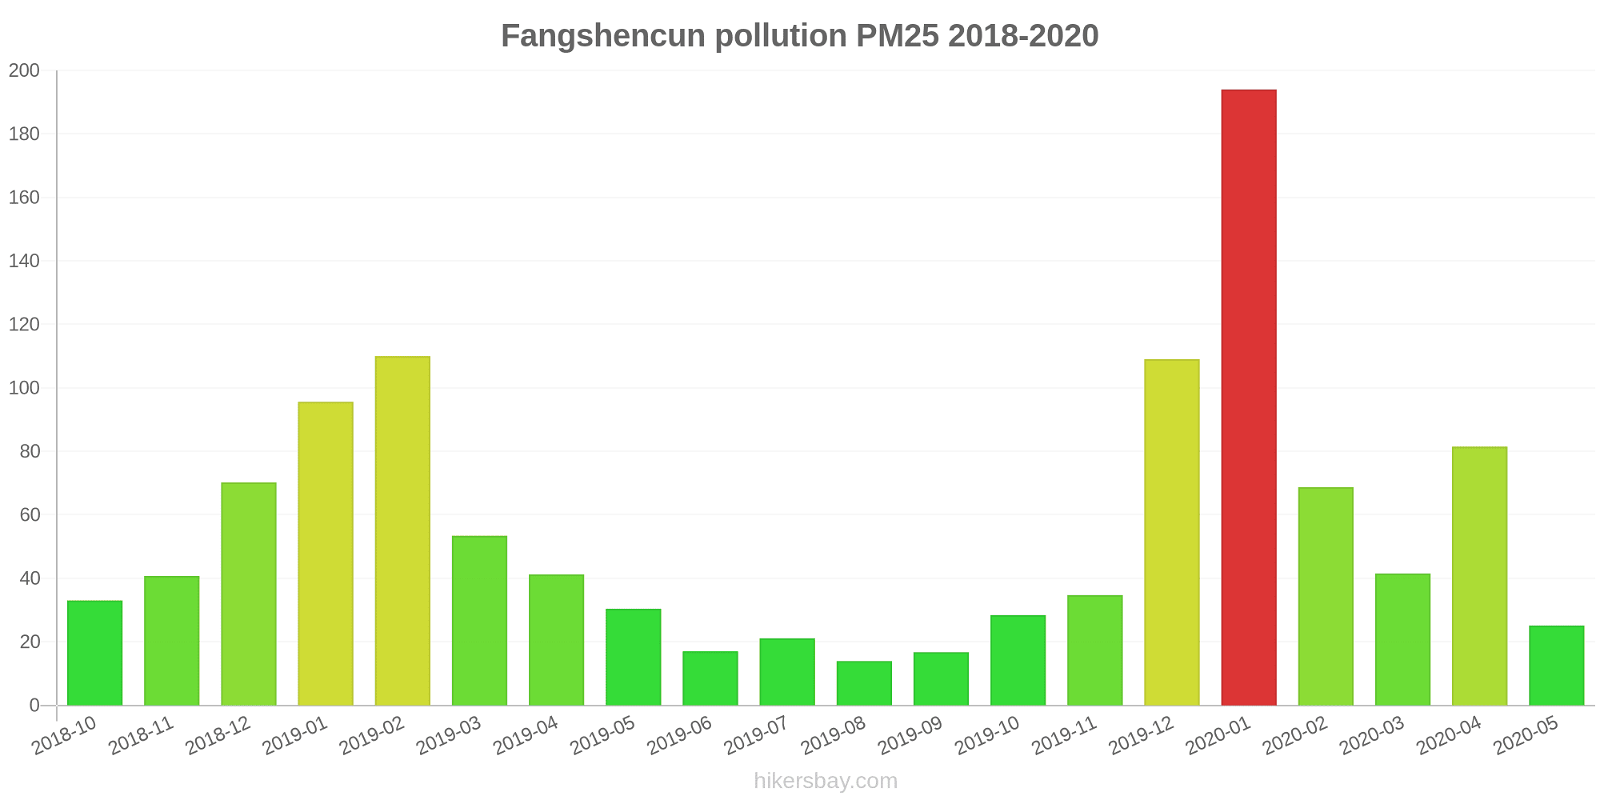
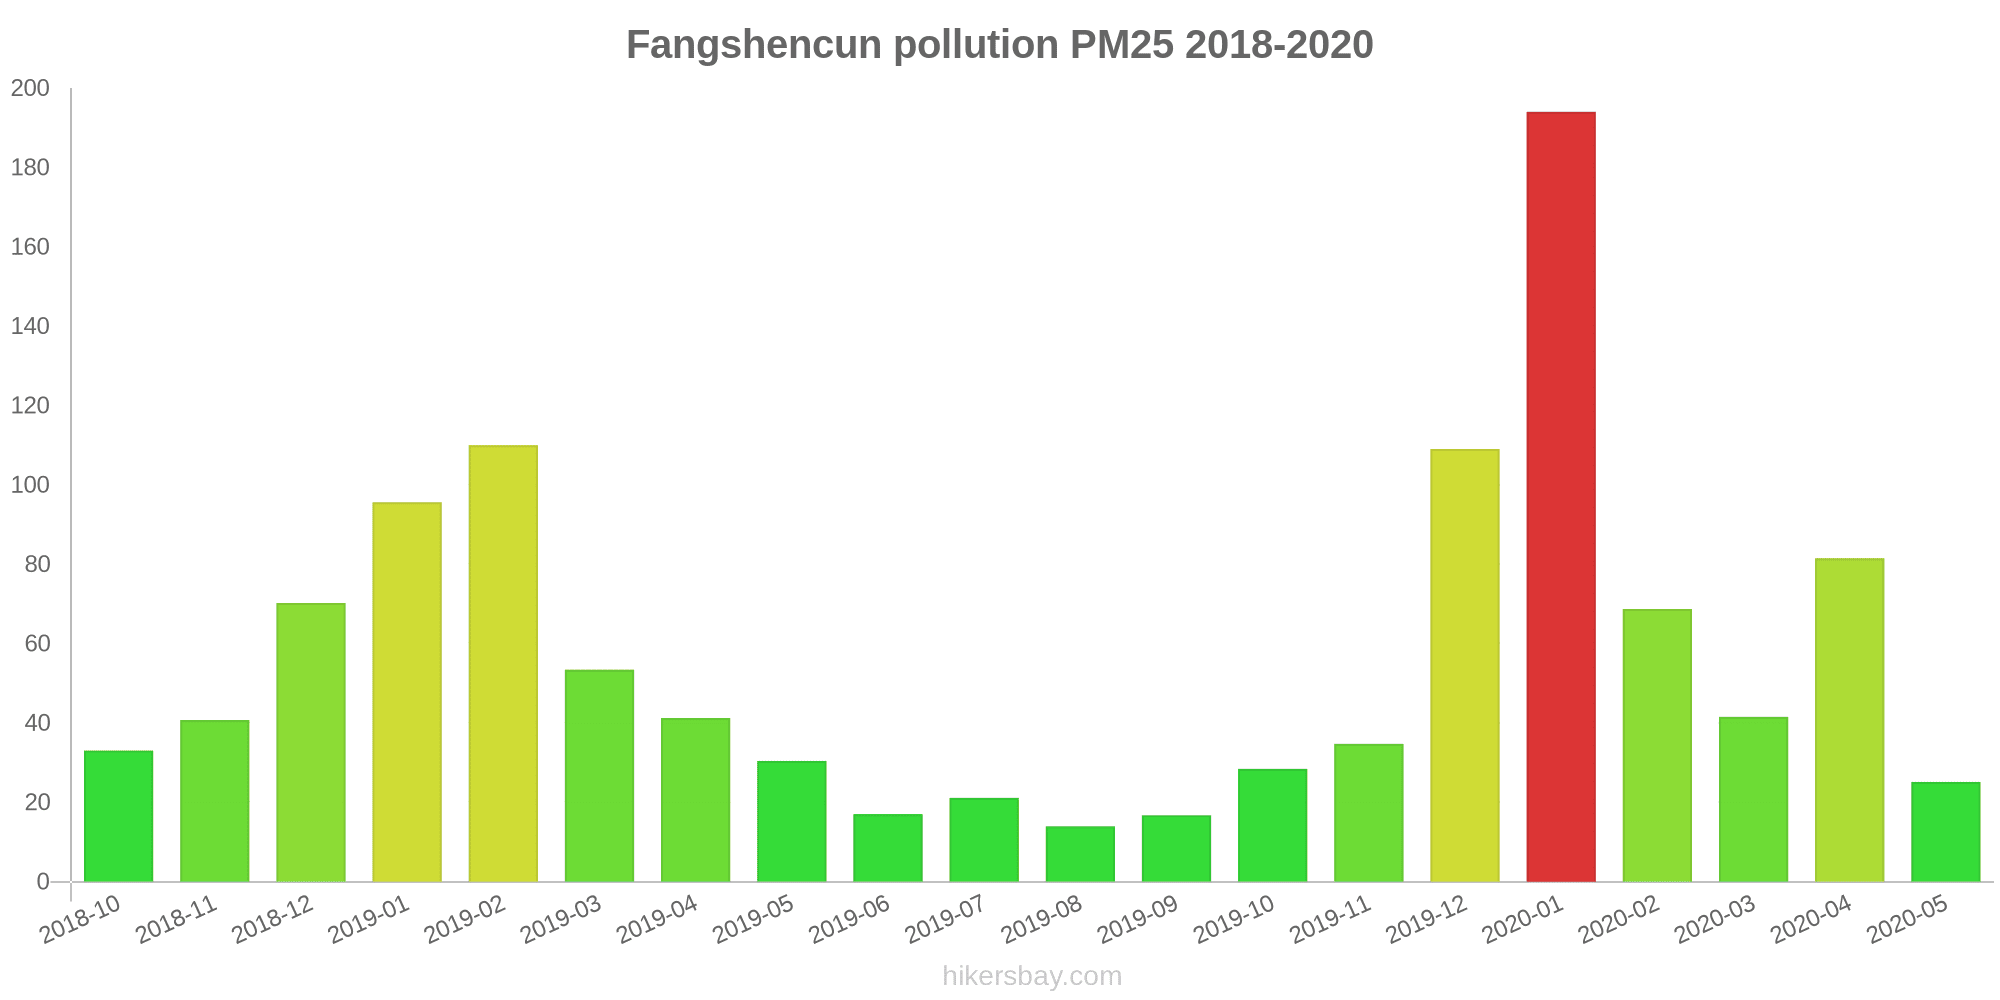
The highest PM2.5 values were recorded: 194 (January 2020).
The lowest level of particulate matter PM2.5 pollution occurs in month: August (14).
What is the level of SO2 pollution? (sulfur dioxide (SO2))
0 (Good)
How high is the CO level? (carbon monoxide (CO))
100 (Good)
Current data Friday, May 27, 2022, 12:00 PM
NO2 7 (Good)
PM10 19 (Good)
O3 91 (Moderate)
PM2,5 10 (Good)
SO2 0 (Good)
CO 100 (Good)
Data on air pollution from recent days in Fangshencun
index
2022-05-27
no2
20
Good
pm10
27
Moderate
o3
39
Good
pm25
20
Moderate
so2
5
Good
co
240
Good
data source »
Air pollution in Fangshencun from October 2018 to May 2020
index
2020-05
2020-04
2020-03
2020-02
2020-01
2019-12
2019-11
2019-10
2019-09
2019-08
2019-07
2019-06
2019-05
2019-04
2019-03
2019-02
2019-01
2018-12
2018-11
2018-10
pm25
25 (Moderate)
82 (Very Unhealthy)
42 (Unhealthy for Sensitive Groups)
69 (Unhealthy)
194 (Very bad Hazardous)
109 (Very Unhealthy)
35 (Moderate)
28 (Moderate)
17 (Moderate)
14 (Moderate)
21 (Moderate)
17 (Moderate)
30 (Moderate)
41 (Unhealthy for Sensitive Groups)
53 (Unhealthy for Sensitive Groups)
110 (Very bad Hazardous)
96 (Very Unhealthy)
70 (Unhealthy)
41 (Unhealthy for Sensitive Groups)
33 (Moderate)
co
635 (Good)
756 (Good)
663 (Good)
1 (Good)
1 (Good)
1 (Good)
696 (Good)
695 (Good)
556 (Good)
546 (Good)
422 (Good)
524 (Good)
546 (Good)
602 (Good)
942 (Good)
1 (Good)
1 (Good)
1 (Good)
964 (Good)
875 (Good)
no2
35 (Good)
41 (Moderate)
32 (Good)
35 (Good)
65 (Moderate)
50 (Moderate)
35 (Good)
39 (Good)
32 (Good)
28 (Good)
34 (Good)
31 (Good)
28 (Good)
34 (Good)
41 (Moderate)
44 (Moderate)
51 (Moderate)
42 (Moderate)
39 (Good)
41 (Moderate)
o3
110 (Moderate)
115 (Moderate)
108 (Moderate)
95 (Moderate)
54 (Good)
40 (Good)
51 (Good)
82 (Moderate)
94 (Moderate)
68 (Good)
116 (Moderate)
105 (Moderate)
115 (Moderate)
106 (Moderate)
102 (Moderate)
80 (Moderate)
61 (Good)
60 (Good)
53 (Good)
64 (Good)
so2
14 (Good)
17 (Good)
22 (Good)
35 (Good)
50 (Good)
38 (Good)
23 (Good)
14 (Good)
9.6 (Good)
7.2 (Good)
8.9 (Good)
8.3 (Good)
8.4 (Good)
13 (Good)
22 (Good)
42 (Good)
54 (Moderate)
51 (Moderate)
27 (Good)
16 (Good)
pm10
57 (Unhealthy for Sensitive Groups)
103 (Unhealthy)
57 (Unhealthy for Sensitive Groups)
80 (Unhealthy for Sensitive Groups)
206 (Very bad Hazardous)
124 (Very Unhealthy)
55 (Unhealthy for Sensitive Groups)
71 (Unhealthy for Sensitive Groups)
52 (Unhealthy for Sensitive Groups)
33 (Moderate)
55 (Unhealthy for Sensitive Groups)
52 (Unhealthy for Sensitive Groups)
83 (Unhealthy)
129 (Very Unhealthy)
97 (Unhealthy)
126 (Very Unhealthy)
128 (Very Unhealthy)
80 (Unhealthy)
64 (Unhealthy for Sensitive Groups)
59 (Unhealthy for Sensitive Groups)
data source »
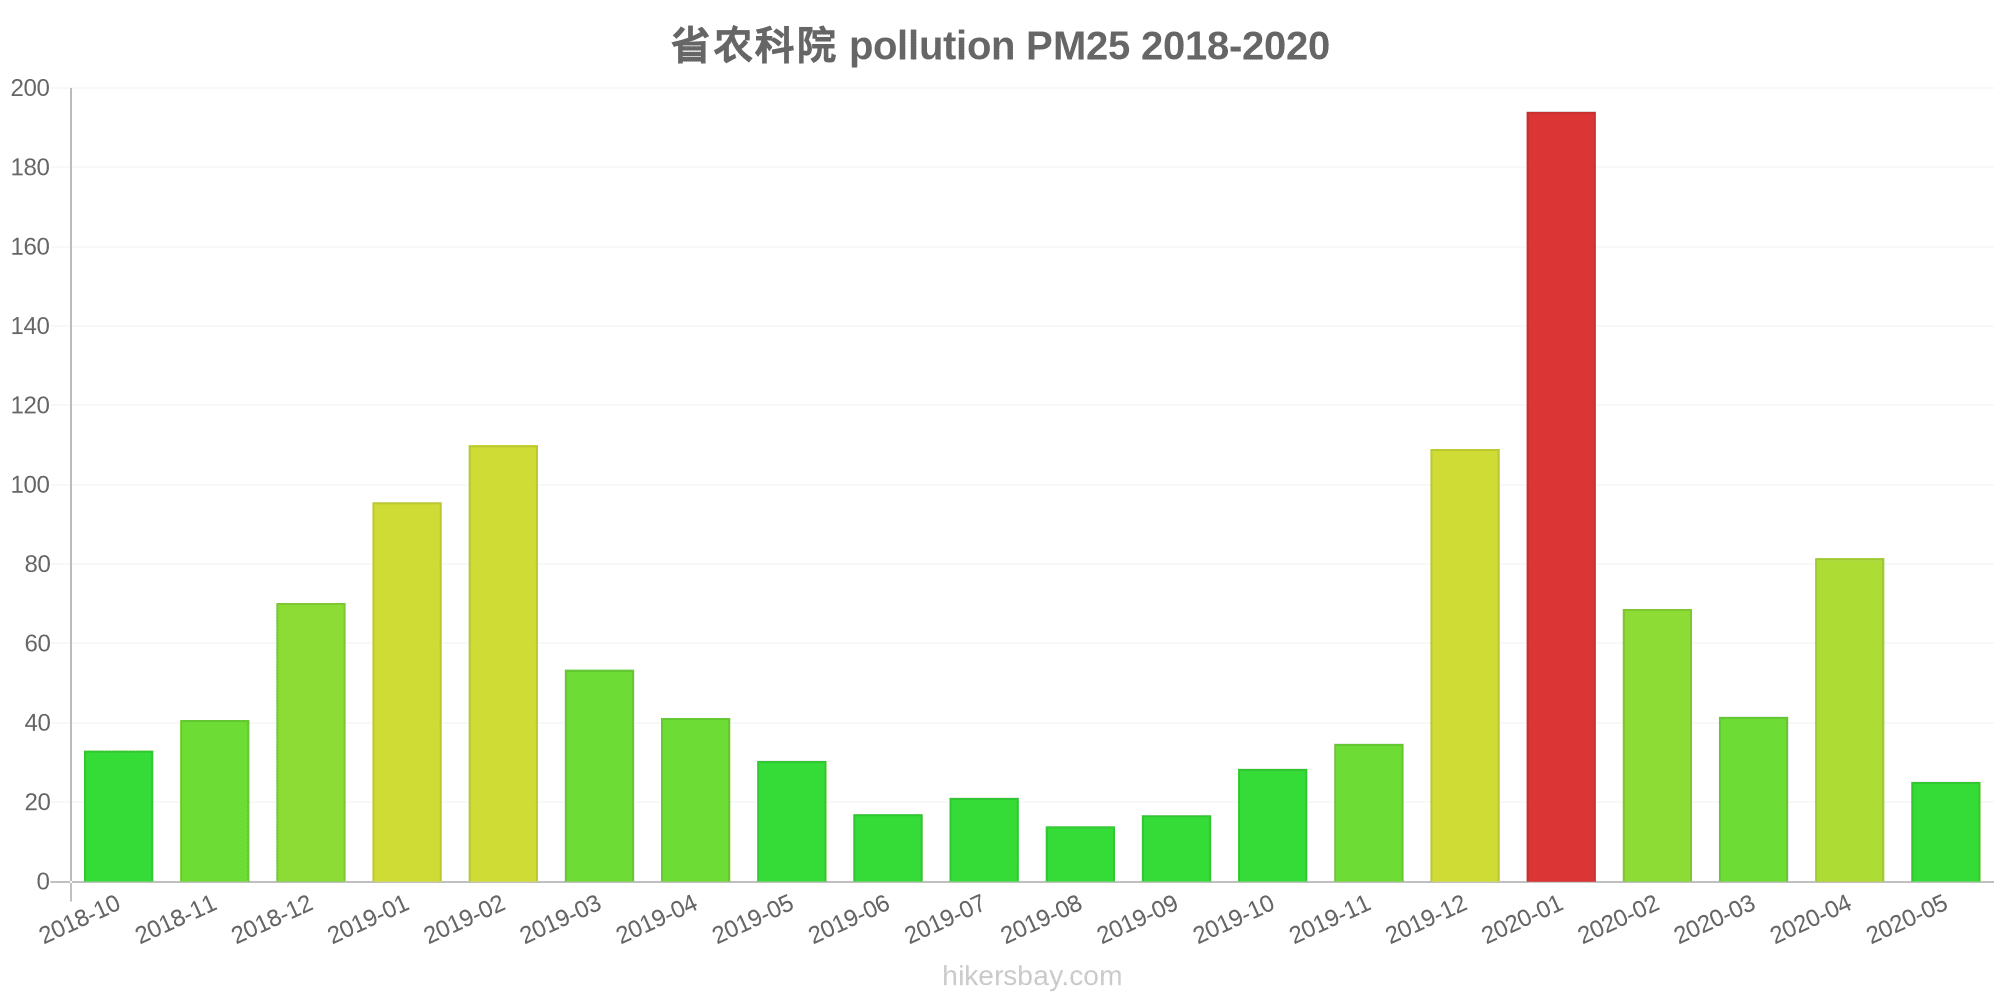
省农科院
Friday, May 27, 2022, 12:00 PM
NO2 7.3 (Good)
nitrogen dioxide (NO2)
PM10 19 (Good)
particulate matter (PM10) suspended dust
O3 91 (Moderate)
ozone (O3)
PM2,5 10 (Good)
particulate matter (PM2.5) dust
SO2 0.1 (Good)
sulfur dioxide (SO2)
CO 100 (Good)
carbon monoxide (CO)
省农科院
index
2022-05-27
no2
20
pm10
27
o3
39
pm25
20
so2
4.9
co
240
省农科院
2018-10 2020-05

index
2020-05
2020-04
2020-03
2020-02
2020-01
2019-12
2019-11
2019-10
2019-09
2019-08
2019-07
2019-06
2019-05
2019-04
2019-03
2019-02
2019-01
2018-12
2018-11
2018-10
pm25
25
82
42
69
194
109
35
28
17
14
21
17
30
41
53
110
96
70
41
33
co
635
756
663
1
1
1
696
695
556
546
422
524
546
602
942
1
1
1
964
875
no2
35
41
32
35
65
50
35
39
32
28
34
31
28
34
41
44
51
42
39
41
o3
110
115
108
95
54
40
51
82
94
68
116
105
115
106
102
80
61
60
53
64
pm10
57
103
57
80
206
124
55
71
52
33
55
52
83
129
97
126
128
80
64
59
so2
14
17
22
35
50
38
23
14
9.6
7.2
8.9
8.3
8.4
13
22
42
54
51
27
16
* Pollution data source:
https://openaq.org
(ChinaAQIData)
The data is licensed under CC-By 4.0
NO2 7 (Good)
PM10 19 (Good)
O3 91 (Moderate)
PM2,5 10 (Good)
SO2 0 (Good)
CO 100 (Good)
Data on air pollution from recent days in Fangshencun
| index | 2022-05-27 |
|---|---|
| no2 | 20 Good |
| pm10 | 27 Moderate |
| o3 | 39 Good |
| pm25 | 20 Moderate |
| so2 | 5 Good |
| co | 240 Good |
| index | 2020-05 | 2020-04 | 2020-03 | 2020-02 | 2020-01 | 2019-12 | 2019-11 | 2019-10 | 2019-09 | 2019-08 | 2019-07 | 2019-06 | 2019-05 | 2019-04 | 2019-03 | 2019-02 | 2019-01 | 2018-12 | 2018-11 | 2018-10 |
|---|---|---|---|---|---|---|---|---|---|---|---|---|---|---|---|---|---|---|---|---|
| pm25 | 25 (Moderate) | 82 (Very Unhealthy) | 42 (Unhealthy for Sensitive Groups) | 69 (Unhealthy) | 194 (Very bad Hazardous) | 109 (Very Unhealthy) | 35 (Moderate) | 28 (Moderate) | 17 (Moderate) | 14 (Moderate) | 21 (Moderate) | 17 (Moderate) | 30 (Moderate) | 41 (Unhealthy for Sensitive Groups) | 53 (Unhealthy for Sensitive Groups) | 110 (Very bad Hazardous) | 96 (Very Unhealthy) | 70 (Unhealthy) | 41 (Unhealthy for Sensitive Groups) | 33 (Moderate) |
| co | 635 (Good) | 756 (Good) | 663 (Good) | 1 (Good) | 1 (Good) | 1 (Good) | 696 (Good) | 695 (Good) | 556 (Good) | 546 (Good) | 422 (Good) | 524 (Good) | 546 (Good) | 602 (Good) | 942 (Good) | 1 (Good) | 1 (Good) | 1 (Good) | 964 (Good) | 875 (Good) |
| no2 | 35 (Good) | 41 (Moderate) | 32 (Good) | 35 (Good) | 65 (Moderate) | 50 (Moderate) | 35 (Good) | 39 (Good) | 32 (Good) | 28 (Good) | 34 (Good) | 31 (Good) | 28 (Good) | 34 (Good) | 41 (Moderate) | 44 (Moderate) | 51 (Moderate) | 42 (Moderate) | 39 (Good) | 41 (Moderate) |
| o3 | 110 (Moderate) | 115 (Moderate) | 108 (Moderate) | 95 (Moderate) | 54 (Good) | 40 (Good) | 51 (Good) | 82 (Moderate) | 94 (Moderate) | 68 (Good) | 116 (Moderate) | 105 (Moderate) | 115 (Moderate) | 106 (Moderate) | 102 (Moderate) | 80 (Moderate) | 61 (Good) | 60 (Good) | 53 (Good) | 64 (Good) |
| so2 | 14 (Good) | 17 (Good) | 22 (Good) | 35 (Good) | 50 (Good) | 38 (Good) | 23 (Good) | 14 (Good) | 9.6 (Good) | 7.2 (Good) | 8.9 (Good) | 8.3 (Good) | 8.4 (Good) | 13 (Good) | 22 (Good) | 42 (Good) | 54 (Moderate) | 51 (Moderate) | 27 (Good) | 16 (Good) |
| pm10 | 57 (Unhealthy for Sensitive Groups) | 103 (Unhealthy) | 57 (Unhealthy for Sensitive Groups) | 80 (Unhealthy for Sensitive Groups) | 206 (Very bad Hazardous) | 124 (Very Unhealthy) | 55 (Unhealthy for Sensitive Groups) | 71 (Unhealthy for Sensitive Groups) | 52 (Unhealthy for Sensitive Groups) | 33 (Moderate) | 55 (Unhealthy for Sensitive Groups) | 52 (Unhealthy for Sensitive Groups) | 83 (Unhealthy) | 129 (Very Unhealthy) | 97 (Unhealthy) | 126 (Very Unhealthy) | 128 (Very Unhealthy) | 80 (Unhealthy) | 64 (Unhealthy for Sensitive Groups) | 59 (Unhealthy for Sensitive Groups) |
NO2 7.3 (Good)
nitrogen dioxide (NO2)PM10 19 (Good)
particulate matter (PM10) suspended dustO3 91 (Moderate)
ozone (O3)PM2,5 10 (Good)
particulate matter (PM2.5) dustSO2 0.1 (Good)
sulfur dioxide (SO2)CO 100 (Good)
carbon monoxide (CO)省农科院
| index | 2022-05-27 |
|---|---|
| no2 | 20 |
| pm10 | 27 |
| o3 | 39 |
| pm25 | 20 |
| so2 | 4.9 |
| co | 240 |
省农科院
| index | 2020-05 | 2020-04 | 2020-03 | 2020-02 | 2020-01 | 2019-12 | 2019-11 | 2019-10 | 2019-09 | 2019-08 | 2019-07 | 2019-06 | 2019-05 | 2019-04 | 2019-03 | 2019-02 | 2019-01 | 2018-12 | 2018-11 | 2018-10 |
|---|---|---|---|---|---|---|---|---|---|---|---|---|---|---|---|---|---|---|---|---|
| pm25 | 25 | 82 | 42 | 69 | 194 | 109 | 35 | 28 | 17 | 14 | 21 | 17 | 30 | 41 | 53 | 110 | 96 | 70 | 41 | 33 |
| co | 635 | 756 | 663 | 1 | 1 | 1 | 696 | 695 | 556 | 546 | 422 | 524 | 546 | 602 | 942 | 1 | 1 | 1 | 964 | 875 |
| no2 | 35 | 41 | 32 | 35 | 65 | 50 | 35 | 39 | 32 | 28 | 34 | 31 | 28 | 34 | 41 | 44 | 51 | 42 | 39 | 41 |
| o3 | 110 | 115 | 108 | 95 | 54 | 40 | 51 | 82 | 94 | 68 | 116 | 105 | 115 | 106 | 102 | 80 | 61 | 60 | 53 | 64 |
| pm10 | 57 | 103 | 57 | 80 | 206 | 124 | 55 | 71 | 52 | 33 | 55 | 52 | 83 | 129 | 97 | 126 | 128 | 80 | 64 | 59 |
| so2 | 14 | 17 | 22 | 35 | 50 | 38 | 23 | 14 | 9.6 | 7.2 | 8.9 | 8.3 | 8.4 | 13 | 22 | 42 | 54 | 51 | 27 | 16 |