Air Pollution in Jilecun: Real-time Air Quality Index and smog alert.
Pollution and air quality forecast for Jilecun. Today is Tuesday, June 16, 2026. The following air pollution values have been recorded for Jilecun:- nitrogen dioxide (NO2) - 7 (Good)
- particulate matter (PM10) suspended dust - 19 (Good)
- ozone (O3) - 91 (Moderate)
- particulate matter (PM2.5) dust - 10 (Good)
- sulfur dioxide (SO2) - 0 (Good)
- carbon monoxide (CO) - 100 (Good)

What is the air quality in Jilecun today? Is the air polluted in Jilecun?. Is there smog?
How high is the level of NO2? (nitrogen dioxide (NO2))
7 (Good)
What is the level of PM10 today in Jilecun? (particulate matter (PM10) suspended dust)
The current level of particulate matter PM10 in Jilecun is:
19 (Good)
The highest PM10 values usually occur in month: 157 (January 2020).
The lowest value of particulate matter PM10 pollution in Jilecun is usually recorded in: August (22).
How is the O3 level today in Jilecun? (ozone (O3))
91 (Moderate)
What is the current level of PM2.5 in Jilecun? (particulate matter (PM2.5) dust)
Today's PM2.5 level is:
10 (Good)
For comparison, the highest level of PM2.5 in Jilecun in the last 7 days was: 20 (Friday, May 27, 2022) and the lowest: 20 (Friday, May 27, 2022).
The highest PM2.5 values were recorded: 142 (January 2020).
The lowest level of particulate matter PM2.5 pollution occurs in month: August (9.6).
What is the level of SO2 pollution? (sulfur dioxide (SO2))
0 (Good)
How high is the CO level? (carbon monoxide (CO))
100 (Good)
Current data Friday, May 27, 2022, 12:00 PM
NO2 7 (Good)
PM10 19 (Good)
O3 91 (Moderate)
PM2,5 10 (Good)
SO2 0 (Good)
CO 100 (Good)
Data on air pollution from recent days in Jilecun
index
2022-05-27
no2
20
Good
pm10
27
Moderate
o3
39
Good
pm25
20
Moderate
so2
5
Good
co
240
Good
data source »
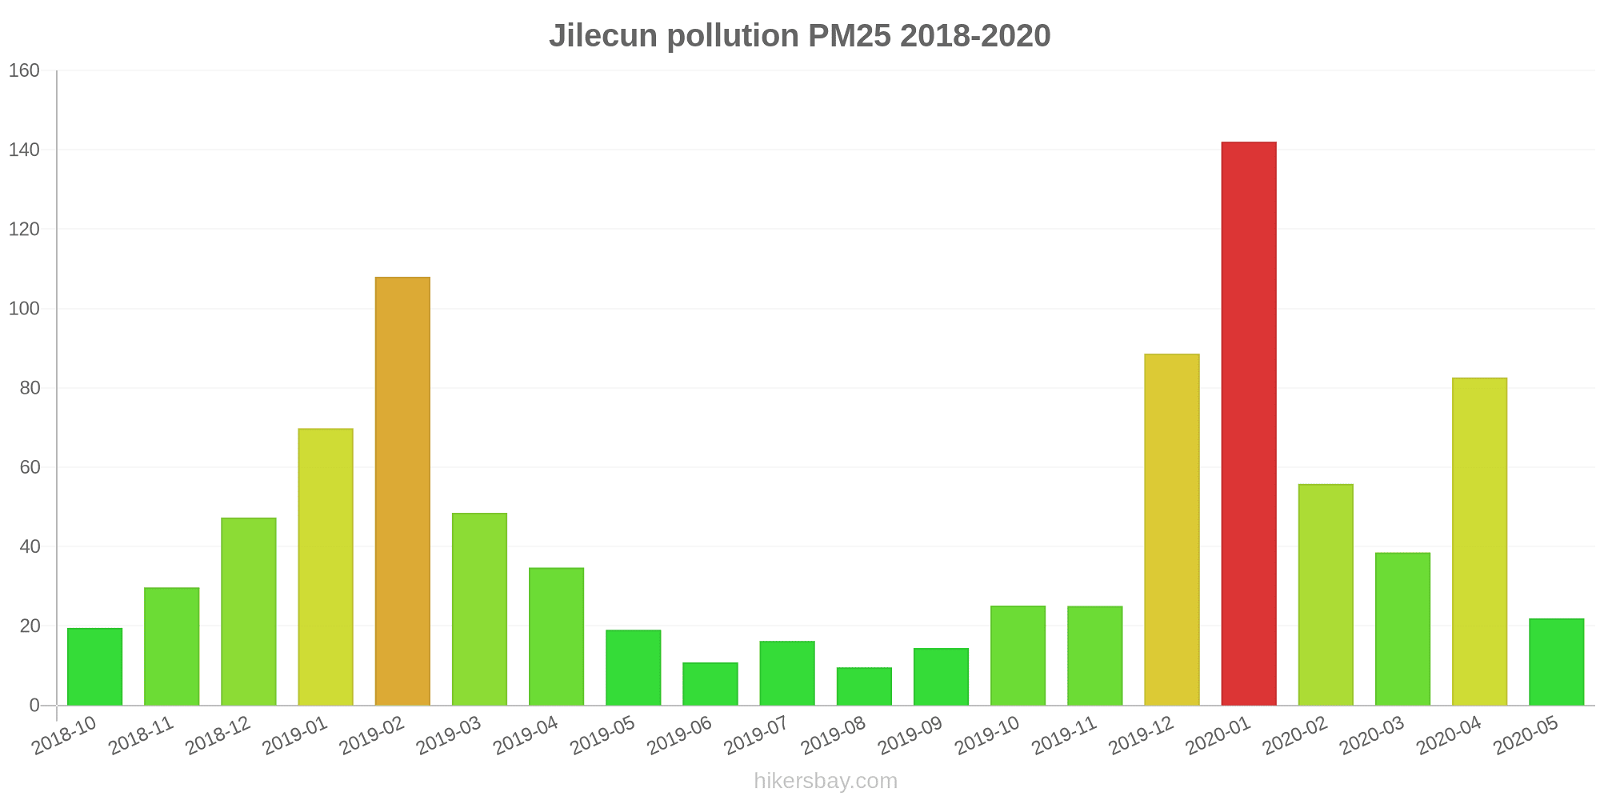
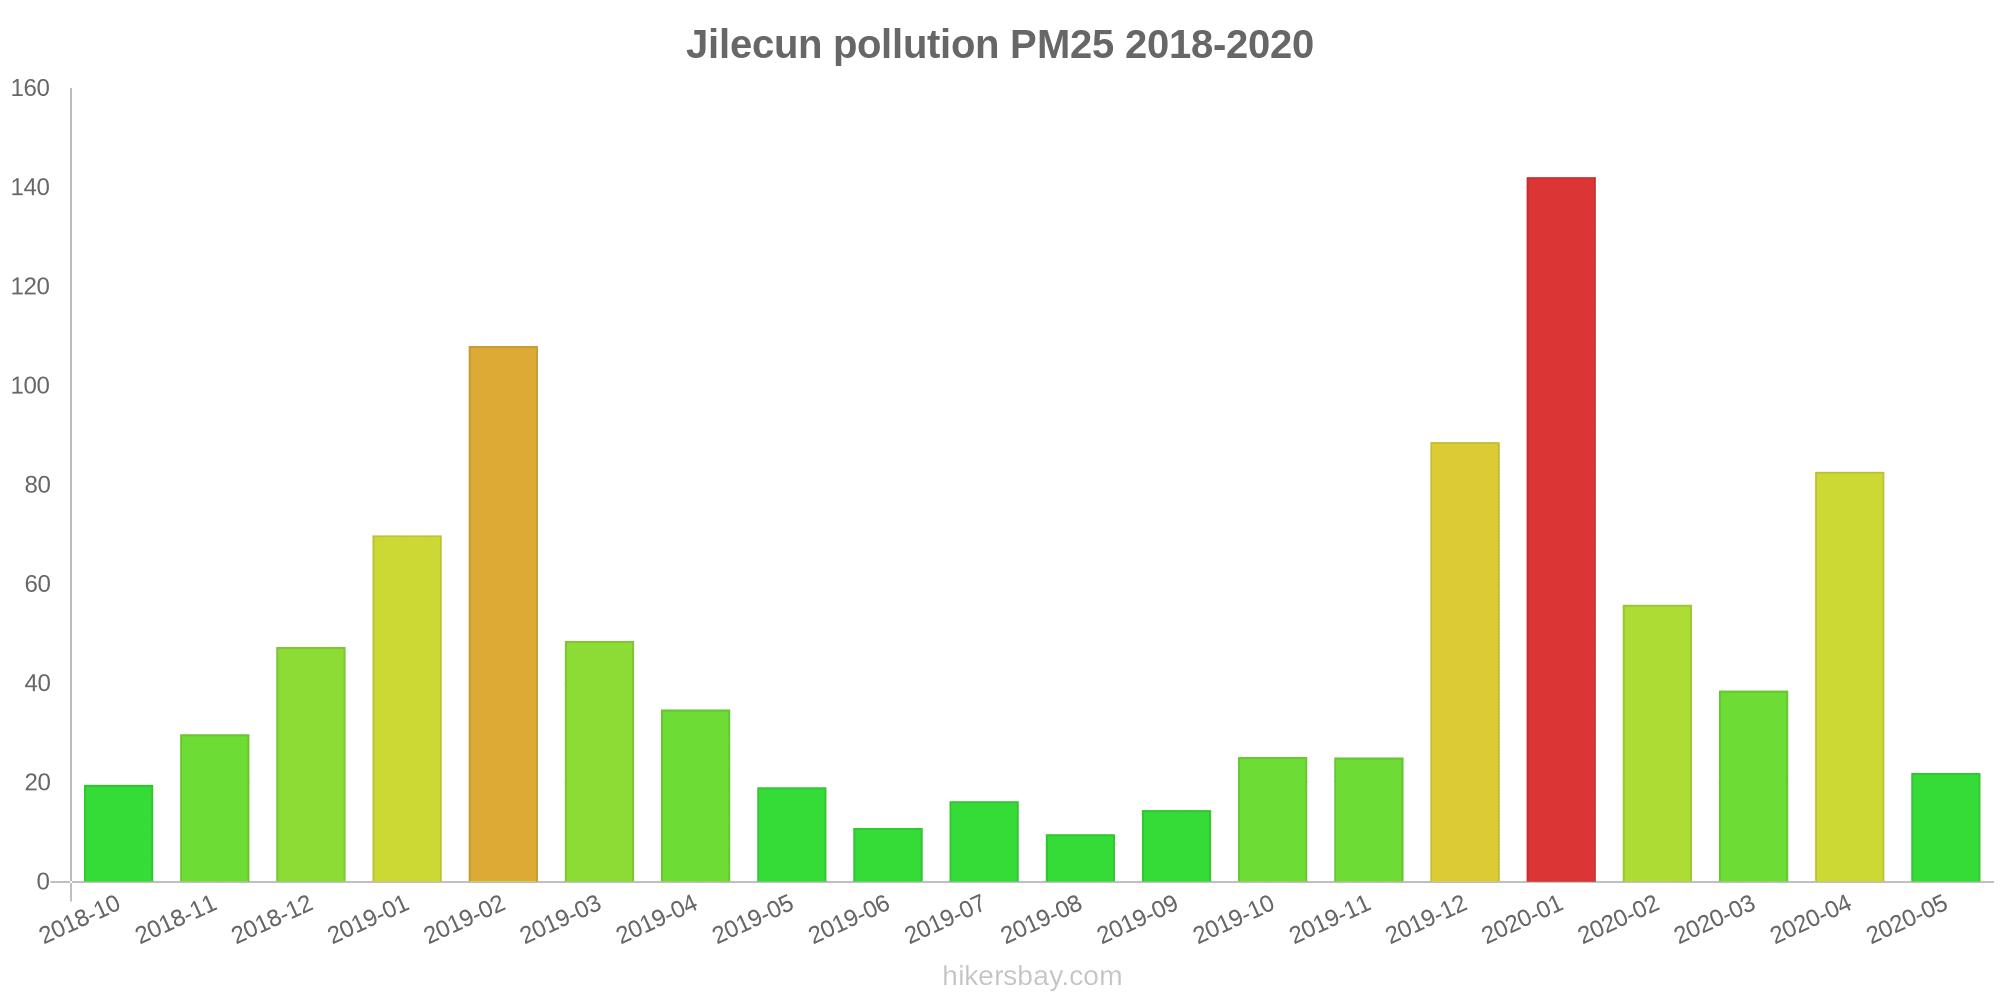
Air pollution in Jilecun from October 2018 to May 2020
index
2020-05
2020-04
2020-03
2020-02
2020-01
2019-12
2019-11
2019-10
2019-09
2019-08
2019-07
2019-06
2019-05
2019-04
2019-03
2019-02
2019-01
2018-12
2018-11
2018-10
pm25
22 (Moderate)
83 (Very Unhealthy)
39 (Unhealthy for Sensitive Groups)
56 (Unhealthy)
142 (Very bad Hazardous)
89 (Very Unhealthy)
25 (Moderate)
25 (Moderate)
14 (Moderate)
9.6 (Good)
16 (Moderate)
11 (Good)
19 (Moderate)
35 (Moderate)
49 (Unhealthy for Sensitive Groups)
108 (Very Unhealthy)
70 (Unhealthy)
47 (Unhealthy for Sensitive Groups)
30 (Moderate)
20 (Moderate)
co
391 (Good)
581 (Good)
484 (Good)
690 (Good)
1 (Good)
917 (Good)
510 (Good)
507 (Good)
576 (Good)
531 (Good)
636 (Good)
515 (Good)
572 (Good)
500 (Good)
747 (Good)
877 (Good)
1 (Good)
784 (Good)
846 (Good)
681 (Good)
no2
29 (Good)
33 (Good)
25 (Good)
22 (Good)
57 (Moderate)
47 (Moderate)
33 (Good)
39 (Good)
35 (Good)
25 (Good)
32 (Good)
32 (Good)
32 (Good)
35 (Good)
43 (Moderate)
42 (Moderate)
45 (Moderate)
36 (Good)
37 (Good)
41 (Moderate)
o3
126 (Unhealthy for Sensitive Groups)
111 (Moderate)
97 (Moderate)
93 (Moderate)
61 (Good)
46 (Good)
54 (Good)
79 (Moderate)
85 (Moderate)
60 (Good)
111 (Moderate)
99 (Moderate)
118 (Moderate)
109 (Moderate)
101 (Moderate)
86 (Moderate)
46 (Good)
44 (Good)
53 (Good)
63 (Good)
pm10
48 (Moderate)
89 (Unhealthy)
52 (Unhealthy for Sensitive Groups)
65 (Unhealthy for Sensitive Groups)
157 (Very bad Hazardous)
109 (Unhealthy)
41 (Moderate)
58 (Unhealthy for Sensitive Groups)
38 (Moderate)
22 (Moderate)
35 (Moderate)
29 (Moderate)
56 (Unhealthy for Sensitive Groups)
98 (Unhealthy)
80 (Unhealthy)
113 (Very Unhealthy)
95 (Unhealthy)
60 (Unhealthy for Sensitive Groups)
59 (Unhealthy for Sensitive Groups)
47 (Moderate)
so2
9.3 (Good)
12 (Good)
12 (Good)
22 (Good)
40 (Good)
22 (Good)
12 (Good)
12 (Good)
7.6 (Good)
5.8 (Good)
8.4 (Good)
7.8 (Good)
9 (Good)
9.2 (Good)
16 (Good)
20 (Good)
23 (Good)
15 (Good)
13 (Good)
9.2 (Good)
data source »
Quality of life in Jilecun
Green and Parks in the City
Jilecun
63%
Mongolia: 27%
Bhutan: 82%
Hong Kong: 52%
Myanmar: 33%
particulate matter PM2.5
Jilecun
52 (Unhealthy for Sensitive Groups)
Pleasure of spending time in the city
Jilecun
22%
Mongolia: 22%
Bhutan: 61%
Hong Kong: 43%
Myanmar: 24%
particulate matter PM10
Jilecun
74 (Unhealthy for Sensitive Groups)
Air Pollution
Jilecun
85%
Mongolia: 87%
Bhutan: 45%
Hong Kong: 67%
Myanmar: 83%
Garbage Disposal
Jilecun
38%
Mongolia: 27%
Bhutan: 47%
Hong Kong: 52%
Myanmar: 12%
Availability and quality of drinking water
Jilecun
34%
Mongolia: 46%
Bhutan: 64%
Hong Kong: 66%
Myanmar: 34%
Cleanliness and tidiness
Jilecun
53%
Mongolia: 29%
Bhutan: 57%
Hong Kong: 54%
Myanmar: 18%
Noise and Light pollution
Jilecun
53%
Mongolia: 48%
Bhutan: 55%
Hong Kong: 66%
Myanmar: 52%
Water Pollution
Jilecun
63%
Mongolia: 68%
Bhutan: 56%
Hong Kong: 53%
Myanmar: 74%
Source: Numbeo
松北商大
Friday, May 27, 2022, 12:00 PM
NO2 7.3 (Good)
nitrogen dioxide (NO2)
PM10 19 (Good)
particulate matter (PM10) suspended dust
O3 91 (Moderate)
ozone (O3)
PM2,5 10 (Good)
particulate matter (PM2.5) dust
SO2 0.1 (Good)
sulfur dioxide (SO2)
CO 100 (Good)
carbon monoxide (CO)
松北商大
index
2022-05-27
no2
20
pm10
27
o3
39
pm25
20
so2
4.9
co
240
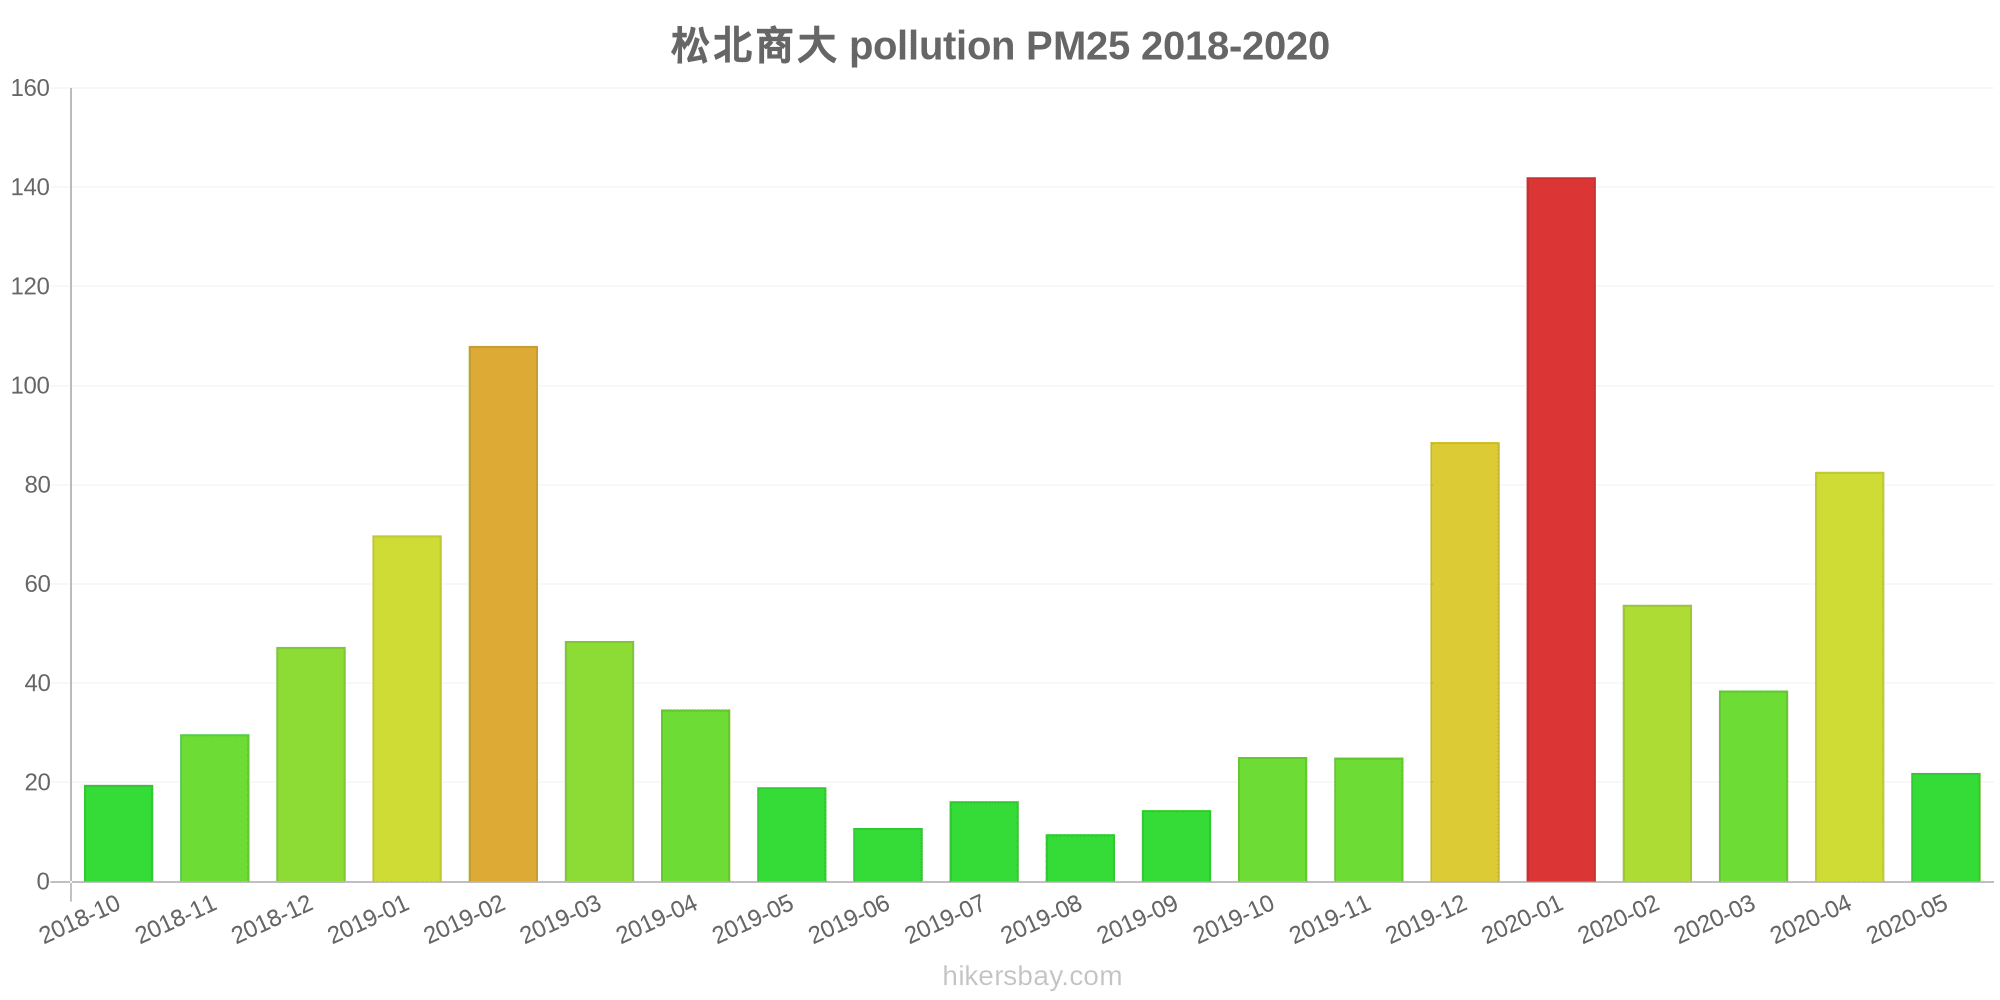
松北商大
2018-10 2020-05

index
2020-05
2020-04
2020-03
2020-02
2020-01
2019-12
2019-11
2019-10
2019-09
2019-08
2019-07
2019-06
2019-05
2019-04
2019-03
2019-02
2019-01
2018-12
2018-11
2018-10
pm25
22
83
39
56
142
89
25
25
14
9.6
16
11
19
35
49
108
70
47
30
20
co
391
581
484
690
1
917
510
507
576
531
636
515
572
500
747
877
1
784
846
681
no2
29
33
25
22
57
47
33
39
35
25
32
32
32
35
43
42
45
36
37
41
o3
126
111
97
93
61
46
54
79
85
60
111
99
118
109
101
86
46
44
53
63
pm10
48
89
52
65
157
109
41
58
38
22
35
29
56
98
80
113
95
60
59
47
so2
9.3
12
12
22
40
22
12
12
7.6
5.8
8.4
7.8
9
9.2
16
20
23
15
13
9.2
* Pollution data source:
https://openaq.org
(ChinaAQIData)
The data is licensed under CC-By 4.0
NO2 7 (Good)
PM10 19 (Good)
O3 91 (Moderate)
PM2,5 10 (Good)
SO2 0 (Good)
CO 100 (Good)
Data on air pollution from recent days in Jilecun
| index | 2022-05-27 |
|---|---|
| no2 | 20 Good |
| pm10 | 27 Moderate |
| o3 | 39 Good |
| pm25 | 20 Moderate |
| so2 | 5 Good |
| co | 240 Good |
| index | 2020-05 | 2020-04 | 2020-03 | 2020-02 | 2020-01 | 2019-12 | 2019-11 | 2019-10 | 2019-09 | 2019-08 | 2019-07 | 2019-06 | 2019-05 | 2019-04 | 2019-03 | 2019-02 | 2019-01 | 2018-12 | 2018-11 | 2018-10 |
|---|---|---|---|---|---|---|---|---|---|---|---|---|---|---|---|---|---|---|---|---|
| pm25 | 22 (Moderate) | 83 (Very Unhealthy) | 39 (Unhealthy for Sensitive Groups) | 56 (Unhealthy) | 142 (Very bad Hazardous) | 89 (Very Unhealthy) | 25 (Moderate) | 25 (Moderate) | 14 (Moderate) | 9.6 (Good) | 16 (Moderate) | 11 (Good) | 19 (Moderate) | 35 (Moderate) | 49 (Unhealthy for Sensitive Groups) | 108 (Very Unhealthy) | 70 (Unhealthy) | 47 (Unhealthy for Sensitive Groups) | 30 (Moderate) | 20 (Moderate) |
| co | 391 (Good) | 581 (Good) | 484 (Good) | 690 (Good) | 1 (Good) | 917 (Good) | 510 (Good) | 507 (Good) | 576 (Good) | 531 (Good) | 636 (Good) | 515 (Good) | 572 (Good) | 500 (Good) | 747 (Good) | 877 (Good) | 1 (Good) | 784 (Good) | 846 (Good) | 681 (Good) |
| no2 | 29 (Good) | 33 (Good) | 25 (Good) | 22 (Good) | 57 (Moderate) | 47 (Moderate) | 33 (Good) | 39 (Good) | 35 (Good) | 25 (Good) | 32 (Good) | 32 (Good) | 32 (Good) | 35 (Good) | 43 (Moderate) | 42 (Moderate) | 45 (Moderate) | 36 (Good) | 37 (Good) | 41 (Moderate) |
| o3 | 126 (Unhealthy for Sensitive Groups) | 111 (Moderate) | 97 (Moderate) | 93 (Moderate) | 61 (Good) | 46 (Good) | 54 (Good) | 79 (Moderate) | 85 (Moderate) | 60 (Good) | 111 (Moderate) | 99 (Moderate) | 118 (Moderate) | 109 (Moderate) | 101 (Moderate) | 86 (Moderate) | 46 (Good) | 44 (Good) | 53 (Good) | 63 (Good) |
| pm10 | 48 (Moderate) | 89 (Unhealthy) | 52 (Unhealthy for Sensitive Groups) | 65 (Unhealthy for Sensitive Groups) | 157 (Very bad Hazardous) | 109 (Unhealthy) | 41 (Moderate) | 58 (Unhealthy for Sensitive Groups) | 38 (Moderate) | 22 (Moderate) | 35 (Moderate) | 29 (Moderate) | 56 (Unhealthy for Sensitive Groups) | 98 (Unhealthy) | 80 (Unhealthy) | 113 (Very Unhealthy) | 95 (Unhealthy) | 60 (Unhealthy for Sensitive Groups) | 59 (Unhealthy for Sensitive Groups) | 47 (Moderate) |
| so2 | 9.3 (Good) | 12 (Good) | 12 (Good) | 22 (Good) | 40 (Good) | 22 (Good) | 12 (Good) | 12 (Good) | 7.6 (Good) | 5.8 (Good) | 8.4 (Good) | 7.8 (Good) | 9 (Good) | 9.2 (Good) | 16 (Good) | 20 (Good) | 23 (Good) | 15 (Good) | 13 (Good) | 9.2 (Good) |
Green and Parks in the City
Jilecun 63%
Mongolia: 27% Bhutan: 82% Hong Kong: 52% Myanmar: 33%particulate matter PM2.5
Jilecun 52 (Unhealthy for Sensitive Groups)
Pleasure of spending time in the city
Jilecun 22%
Mongolia: 22% Bhutan: 61% Hong Kong: 43% Myanmar: 24%particulate matter PM10
Jilecun 74 (Unhealthy for Sensitive Groups)
Air Pollution
Jilecun 85%
Mongolia: 87% Bhutan: 45% Hong Kong: 67% Myanmar: 83%Garbage Disposal
Jilecun 38%
Mongolia: 27% Bhutan: 47% Hong Kong: 52% Myanmar: 12%Availability and quality of drinking water
Jilecun 34%
Mongolia: 46% Bhutan: 64% Hong Kong: 66% Myanmar: 34%Cleanliness and tidiness
Jilecun 53%
Mongolia: 29% Bhutan: 57% Hong Kong: 54% Myanmar: 18%Noise and Light pollution
Jilecun 53%
Mongolia: 48% Bhutan: 55% Hong Kong: 66% Myanmar: 52%Water Pollution
Jilecun 63%
Mongolia: 68% Bhutan: 56% Hong Kong: 53% Myanmar: 74%NO2 7.3 (Good)
nitrogen dioxide (NO2)PM10 19 (Good)
particulate matter (PM10) suspended dustO3 91 (Moderate)
ozone (O3)PM2,5 10 (Good)
particulate matter (PM2.5) dustSO2 0.1 (Good)
sulfur dioxide (SO2)CO 100 (Good)
carbon monoxide (CO)松北商大
| index | 2022-05-27 |
|---|---|
| no2 | 20 |
| pm10 | 27 |
| o3 | 39 |
| pm25 | 20 |
| so2 | 4.9 |
| co | 240 |
松北商大
| index | 2020-05 | 2020-04 | 2020-03 | 2020-02 | 2020-01 | 2019-12 | 2019-11 | 2019-10 | 2019-09 | 2019-08 | 2019-07 | 2019-06 | 2019-05 | 2019-04 | 2019-03 | 2019-02 | 2019-01 | 2018-12 | 2018-11 | 2018-10 |
|---|---|---|---|---|---|---|---|---|---|---|---|---|---|---|---|---|---|---|---|---|
| pm25 | 22 | 83 | 39 | 56 | 142 | 89 | 25 | 25 | 14 | 9.6 | 16 | 11 | 19 | 35 | 49 | 108 | 70 | 47 | 30 | 20 |
| co | 391 | 581 | 484 | 690 | 1 | 917 | 510 | 507 | 576 | 531 | 636 | 515 | 572 | 500 | 747 | 877 | 1 | 784 | 846 | 681 |
| no2 | 29 | 33 | 25 | 22 | 57 | 47 | 33 | 39 | 35 | 25 | 32 | 32 | 32 | 35 | 43 | 42 | 45 | 36 | 37 | 41 |
| o3 | 126 | 111 | 97 | 93 | 61 | 46 | 54 | 79 | 85 | 60 | 111 | 99 | 118 | 109 | 101 | 86 | 46 | 44 | 53 | 63 |
| pm10 | 48 | 89 | 52 | 65 | 157 | 109 | 41 | 58 | 38 | 22 | 35 | 29 | 56 | 98 | 80 | 113 | 95 | 60 | 59 | 47 |
| so2 | 9.3 | 12 | 12 | 22 | 40 | 22 | 12 | 12 | 7.6 | 5.8 | 8.4 | 7.8 | 9 | 9.2 | 16 | 20 | 23 | 15 | 13 | 9.2 |