Air Pollution in Anhuaicun: Real-time Air Quality Index and smog alert.
Pollution and air quality forecast for Anhuaicun. Today is Tuesday, June 2, 2026. The following air pollution values have been recorded for Anhuaicun:- particulate matter (PM10) suspended dust - 179 (Very bad Hazardous)
- particulate matter (PM2.5) dust - 35 (Unhealthy for Sensitive Groups)
- ozone (O3) - 0 (Good)
- nitrogen dioxide (NO2) - 0 (Good)
- sulfur dioxide (SO2) - 0 (Good)

What is the air quality in Anhuaicun today? Is the air polluted in Anhuaicun?. Is there smog?
What is the level of PM10 today in Anhuaicun? (particulate matter (PM10) suspended dust)
The current level of particulate matter PM10 in Anhuaicun is:
179 (Very bad Hazardous)
The highest PM10 values usually occur in month: 118 (January 2019).
The lowest value of particulate matter PM10 pollution in Anhuaicun is usually recorded in: February (37).
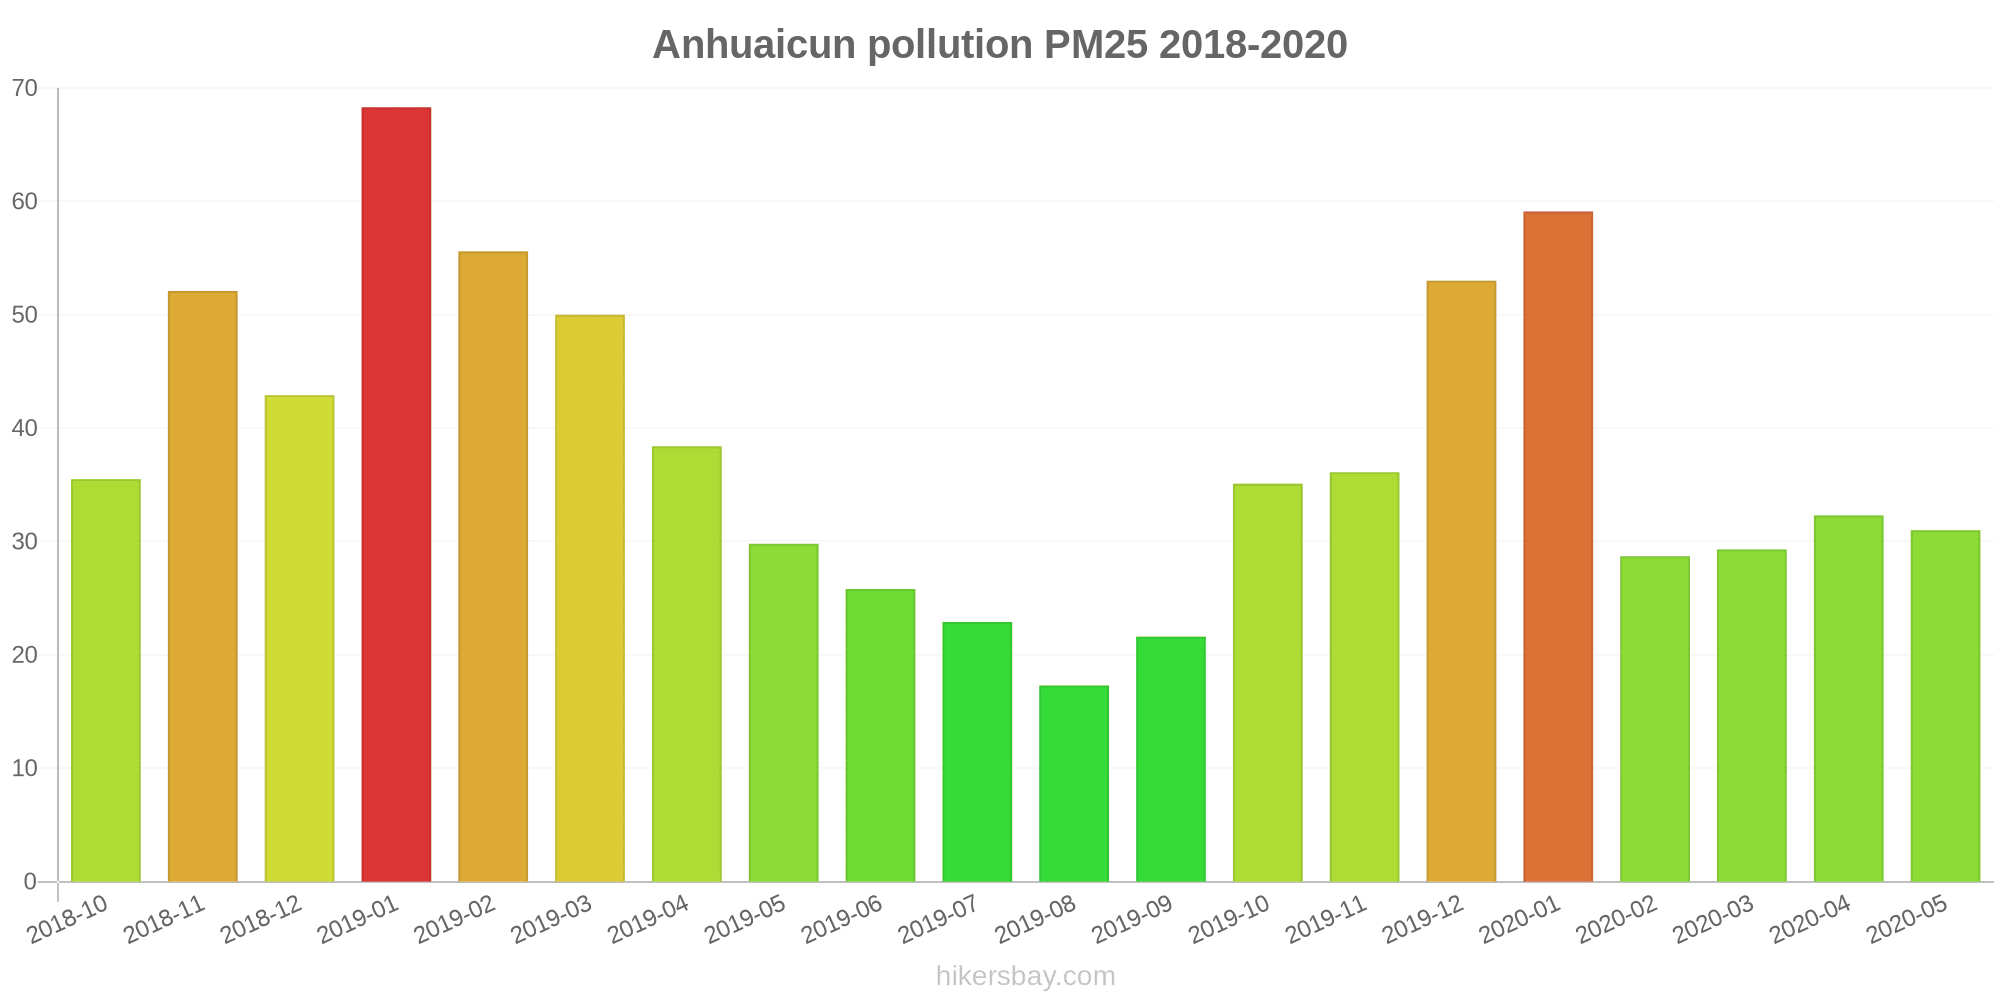
What is the current level of PM2.5 in Anhuaicun? (particulate matter (PM2.5) dust)
Today's PM2.5 level is:
35 (Unhealthy for Sensitive Groups)
For comparison, the highest level of PM2.5 in Anhuaicun in the last 7 days was: 56 (Friday, May 27, 2022) and the lowest: 56 (Friday, May 27, 2022).
The highest PM2.5 values were recorded: 68 (January 2019).
The lowest level of particulate matter PM2.5 pollution occurs in month: August (17).
How is the O3 level today in Anhuaicun? (ozone (O3))
0 (Good)
How high is the level of NO2? (nitrogen dioxide (NO2))
0 (Good)
What is the level of SO2 pollution? (sulfur dioxide (SO2))
0 (Good)
Current data Friday, May 27, 2022, 12:00 PM
PM10 179 (Very bad Hazardous)
PM2,5 35 (Unhealthy for Sensitive Groups)
O3 0 (Good)
NO2 0 (Good)
SO2 0 (Good)
Data on air pollution from recent days in Anhuaicun
index
2022-05-27
pm10
56
Unhealthy for Sensitive Groups
pm25
56
Unhealthy
o3
0
Good
no2
0
Good
so2
0
Good
data source »
Air pollution in Anhuaicun from October 2018 to May 2020

index
2020-05
2020-04
2020-03
2020-02
2020-01
2019-12
2019-11
2019-10
2019-09
2019-08
2019-07
2019-06
2019-05
2019-04
2019-03
2019-02
2019-01
2018-12
2018-11
2018-10
pm25
31 (Moderate)
32 (Moderate)
29 (Moderate)
29 (Moderate)
59 (Unhealthy)
53 (Unhealthy for Sensitive Groups)
36 (Unhealthy for Sensitive Groups)
35 (Unhealthy for Sensitive Groups)
22 (Moderate)
17 (Moderate)
23 (Moderate)
26 (Moderate)
30 (Moderate)
38 (Unhealthy for Sensitive Groups)
50 (Unhealthy for Sensitive Groups)
56 (Unhealthy)
68 (Unhealthy)
43 (Unhealthy for Sensitive Groups)
52 (Unhealthy for Sensitive Groups)
36 (Unhealthy for Sensitive Groups)
co
912 (Good)
906 (Good)
620 (Good)
730 (Good)
718 (Good)
949 (Good)
678 (Good)
728 (Good)
686 (Good)
547 (Good)
594 (Good)
560 (Good)
779 (Good)
807 (Good)
964 (Good)
844 (Good)
1 (Good)
775 (Good)
901 (Good)
619 (Good)
no2
29 (Good)
45 (Moderate)
38 (Good)
21 (Good)
39 (Good)
62 (Moderate)
66 (Moderate)
50 (Moderate)
46 (Moderate)
32 (Good)
36 (Good)
33 (Good)
45 (Moderate)
48 (Moderate)
52 (Moderate)
40 (Good)
56 (Moderate)
47 (Moderate)
50 (Moderate)
48 (Moderate)
o3
145 (Unhealthy for Sensitive Groups)
142 (Unhealthy for Sensitive Groups)
110 (Moderate)
90 (Moderate)
60 (Good)
67 (Good)
101 (Moderate)
121 (Unhealthy for Sensitive Groups)
156 (Unhealthy)
155 (Unhealthy)
165 (Unhealthy)
187 (Very Unhealthy)
161 (Unhealthy)
129 (Unhealthy for Sensitive Groups)
116 (Moderate)
94 (Moderate)
65 (Good)
56 (Good)
91 (Moderate)
122 (Unhealthy for Sensitive Groups)
pm10
52 (Unhealthy for Sensitive Groups)
67 (Unhealthy for Sensitive Groups)
51 (Unhealthy for Sensitive Groups)
37 (Moderate)
69 (Unhealthy for Sensitive Groups)
76 (Unhealthy for Sensitive Groups)
80 (Unhealthy)
84 (Unhealthy)
52 (Unhealthy for Sensitive Groups)
43 (Moderate)
50 (Moderate)
54 (Unhealthy for Sensitive Groups)
73 (Unhealthy for Sensitive Groups)
80 (Unhealthy)
102 (Unhealthy)
86 (Unhealthy)
118 (Very Unhealthy)
84 (Unhealthy)
93 (Unhealthy)
90 (Unhealthy)
so2
8.6 (Good)
10 (Good)
5.8 (Good)
5.6 (Good)
4.6 (Good)
7.2 (Good)
10 (Good)
9.9 (Good)
8 (Good)
8.8 (Good)
8.6 (Good)
5.7 (Good)
9.9 (Good)
14 (Good)
13 (Good)
5.7 (Good)
13 (Good)
10 (Good)
7.2 (Good)
6.5 (Good)
data source »
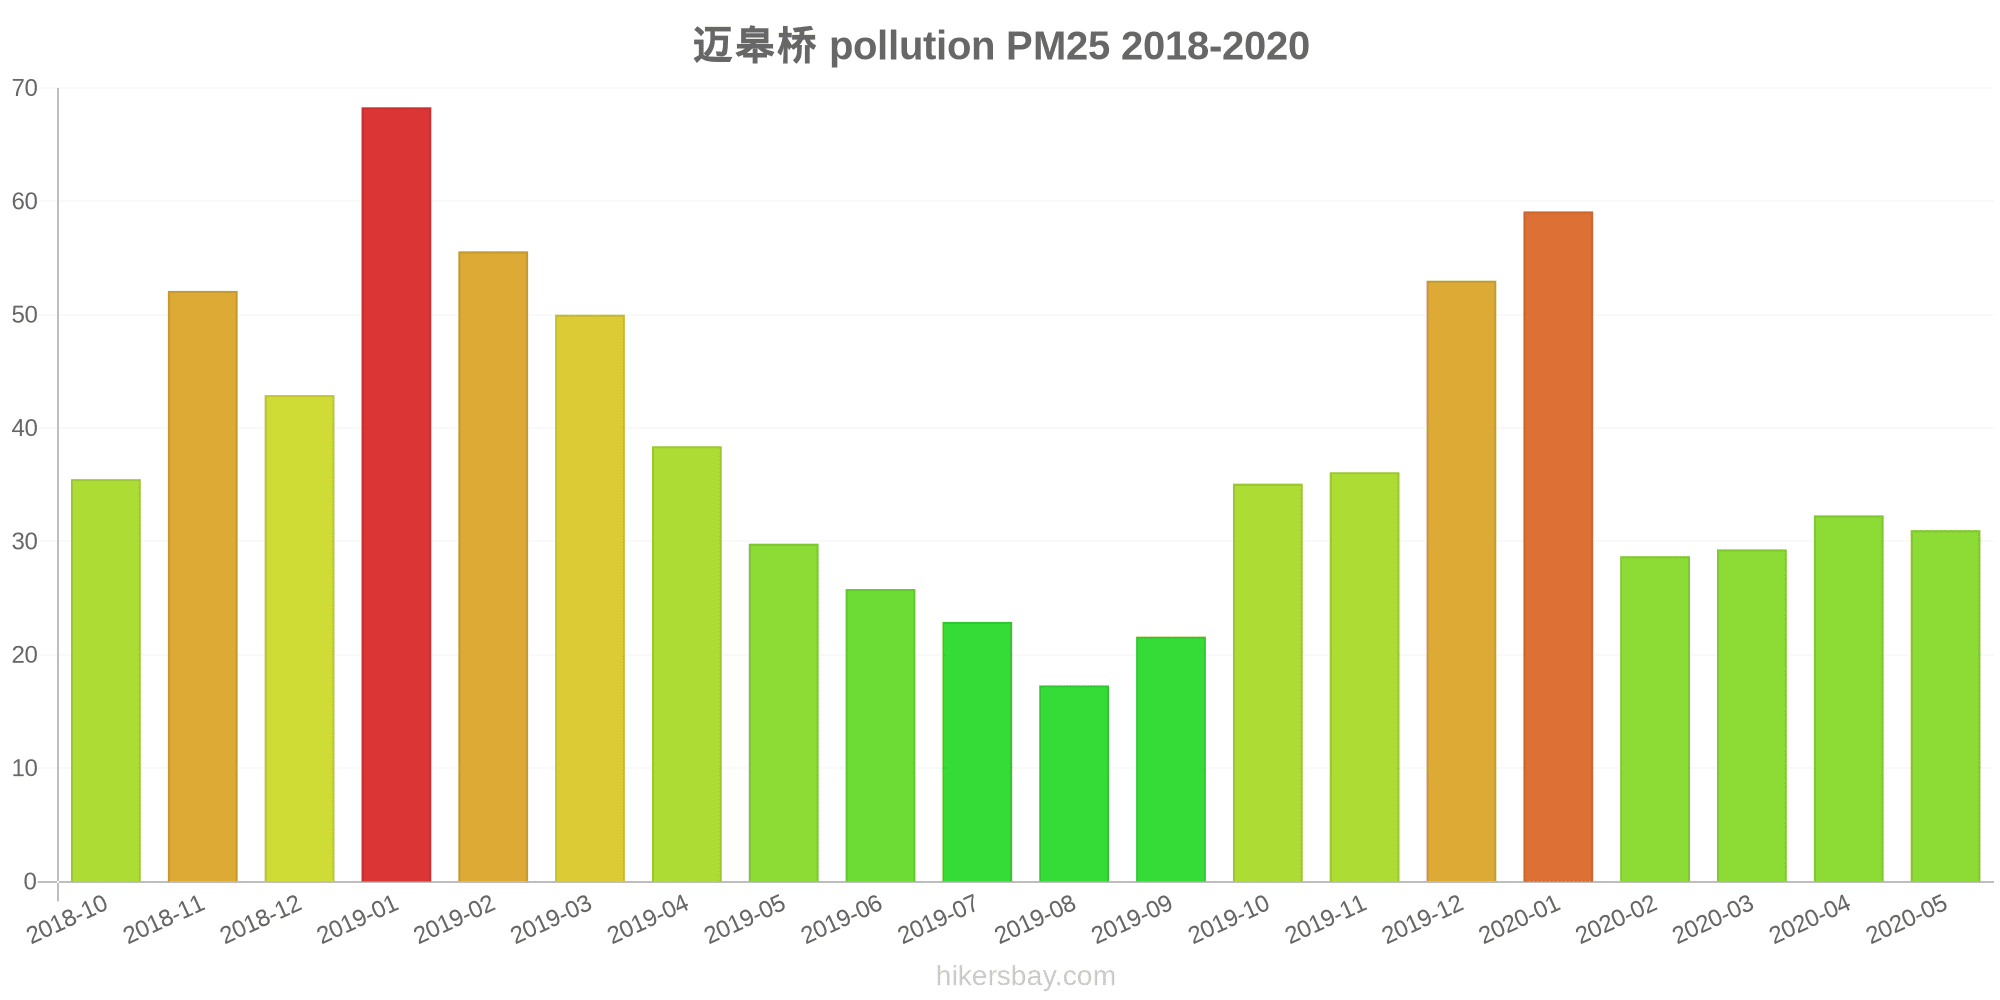
迈皋桥
Friday, May 27, 2022, 12:00 PM
PM10 179 (Very bad Hazardous)
particulate matter (PM10) suspended dust
PM2,5 35 (Unhealthy for Sensitive Groups)
particulate matter (PM2.5) dust
O3 0.04 (Good)
ozone (O3)
NO2 0 (Good)
nitrogen dioxide (NO2)
SO2 0 (Good)
sulfur dioxide (SO2)
迈皋桥
index
2022-05-27
pm10
56
pm25
56
o3
0.03
no2
0
so2
0
迈皋桥
2018-10 2020-05

index
2020-05
2020-04
2020-03
2020-02
2020-01
2019-12
2019-11
2019-10
2019-09
2019-08
2019-07
2019-06
2019-05
2019-04
2019-03
2019-02
2019-01
2018-12
2018-11
2018-10
pm25
31
32
29
29
59
53
36
35
22
17
23
26
30
38
50
56
68
43
52
36
co
912
906
620
730
718
949
678
728
686
547
594
560
779
807
964
844
1
775
901
619
no2
29
45
38
21
39
62
66
50
46
32
36
33
45
48
52
40
56
47
50
48
o3
145
142
110
90
60
67
101
121
156
155
165
187
161
129
116
94
65
56
91
122
pm10
52
67
51
37
69
76
80
84
52
43
50
54
73
80
102
86
118
84
93
90
so2
8.6
10
5.8
5.6
4.6
7.2
10
9.9
8
8.8
8.6
5.7
9.9
14
13
5.7
13
10
7.2
6.5
* Pollution data source:
https://openaq.org
(ChinaAQIData)
The data is licensed under CC-By 4.0
PM10 179 (Very bad Hazardous)
PM2,5 35 (Unhealthy for Sensitive Groups)
O3 0 (Good)
NO2 0 (Good)
SO2 0 (Good)
Data on air pollution from recent days in Anhuaicun
| index | 2022-05-27 |
|---|---|
| pm10 | 56 Unhealthy for Sensitive Groups |
| pm25 | 56 Unhealthy |
| o3 | 0 Good |
| no2 | 0 Good |
| so2 | 0 Good |
| index | 2020-05 | 2020-04 | 2020-03 | 2020-02 | 2020-01 | 2019-12 | 2019-11 | 2019-10 | 2019-09 | 2019-08 | 2019-07 | 2019-06 | 2019-05 | 2019-04 | 2019-03 | 2019-02 | 2019-01 | 2018-12 | 2018-11 | 2018-10 |
|---|---|---|---|---|---|---|---|---|---|---|---|---|---|---|---|---|---|---|---|---|
| pm25 | 31 (Moderate) | 32 (Moderate) | 29 (Moderate) | 29 (Moderate) | 59 (Unhealthy) | 53 (Unhealthy for Sensitive Groups) | 36 (Unhealthy for Sensitive Groups) | 35 (Unhealthy for Sensitive Groups) | 22 (Moderate) | 17 (Moderate) | 23 (Moderate) | 26 (Moderate) | 30 (Moderate) | 38 (Unhealthy for Sensitive Groups) | 50 (Unhealthy for Sensitive Groups) | 56 (Unhealthy) | 68 (Unhealthy) | 43 (Unhealthy for Sensitive Groups) | 52 (Unhealthy for Sensitive Groups) | 36 (Unhealthy for Sensitive Groups) |
| co | 912 (Good) | 906 (Good) | 620 (Good) | 730 (Good) | 718 (Good) | 949 (Good) | 678 (Good) | 728 (Good) | 686 (Good) | 547 (Good) | 594 (Good) | 560 (Good) | 779 (Good) | 807 (Good) | 964 (Good) | 844 (Good) | 1 (Good) | 775 (Good) | 901 (Good) | 619 (Good) |
| no2 | 29 (Good) | 45 (Moderate) | 38 (Good) | 21 (Good) | 39 (Good) | 62 (Moderate) | 66 (Moderate) | 50 (Moderate) | 46 (Moderate) | 32 (Good) | 36 (Good) | 33 (Good) | 45 (Moderate) | 48 (Moderate) | 52 (Moderate) | 40 (Good) | 56 (Moderate) | 47 (Moderate) | 50 (Moderate) | 48 (Moderate) |
| o3 | 145 (Unhealthy for Sensitive Groups) | 142 (Unhealthy for Sensitive Groups) | 110 (Moderate) | 90 (Moderate) | 60 (Good) | 67 (Good) | 101 (Moderate) | 121 (Unhealthy for Sensitive Groups) | 156 (Unhealthy) | 155 (Unhealthy) | 165 (Unhealthy) | 187 (Very Unhealthy) | 161 (Unhealthy) | 129 (Unhealthy for Sensitive Groups) | 116 (Moderate) | 94 (Moderate) | 65 (Good) | 56 (Good) | 91 (Moderate) | 122 (Unhealthy for Sensitive Groups) |
| pm10 | 52 (Unhealthy for Sensitive Groups) | 67 (Unhealthy for Sensitive Groups) | 51 (Unhealthy for Sensitive Groups) | 37 (Moderate) | 69 (Unhealthy for Sensitive Groups) | 76 (Unhealthy for Sensitive Groups) | 80 (Unhealthy) | 84 (Unhealthy) | 52 (Unhealthy for Sensitive Groups) | 43 (Moderate) | 50 (Moderate) | 54 (Unhealthy for Sensitive Groups) | 73 (Unhealthy for Sensitive Groups) | 80 (Unhealthy) | 102 (Unhealthy) | 86 (Unhealthy) | 118 (Very Unhealthy) | 84 (Unhealthy) | 93 (Unhealthy) | 90 (Unhealthy) |
| so2 | 8.6 (Good) | 10 (Good) | 5.8 (Good) | 5.6 (Good) | 4.6 (Good) | 7.2 (Good) | 10 (Good) | 9.9 (Good) | 8 (Good) | 8.8 (Good) | 8.6 (Good) | 5.7 (Good) | 9.9 (Good) | 14 (Good) | 13 (Good) | 5.7 (Good) | 13 (Good) | 10 (Good) | 7.2 (Good) | 6.5 (Good) |
PM10 179 (Very bad Hazardous)
particulate matter (PM10) suspended dustPM2,5 35 (Unhealthy for Sensitive Groups)
particulate matter (PM2.5) dustO3 0.04 (Good)
ozone (O3)NO2 0 (Good)
nitrogen dioxide (NO2)SO2 0 (Good)
sulfur dioxide (SO2)迈皋桥
| index | 2022-05-27 |
|---|---|
| pm10 | 56 |
| pm25 | 56 |
| o3 | 0.03 |
| no2 | 0 |
| so2 | 0 |
迈皋桥
| index | 2020-05 | 2020-04 | 2020-03 | 2020-02 | 2020-01 | 2019-12 | 2019-11 | 2019-10 | 2019-09 | 2019-08 | 2019-07 | 2019-06 | 2019-05 | 2019-04 | 2019-03 | 2019-02 | 2019-01 | 2018-12 | 2018-11 | 2018-10 |
|---|---|---|---|---|---|---|---|---|---|---|---|---|---|---|---|---|---|---|---|---|
| pm25 | 31 | 32 | 29 | 29 | 59 | 53 | 36 | 35 | 22 | 17 | 23 | 26 | 30 | 38 | 50 | 56 | 68 | 43 | 52 | 36 |
| co | 912 | 906 | 620 | 730 | 718 | 949 | 678 | 728 | 686 | 547 | 594 | 560 | 779 | 807 | 964 | 844 | 1 | 775 | 901 | 619 |
| no2 | 29 | 45 | 38 | 21 | 39 | 62 | 66 | 50 | 46 | 32 | 36 | 33 | 45 | 48 | 52 | 40 | 56 | 47 | 50 | 48 |
| o3 | 145 | 142 | 110 | 90 | 60 | 67 | 101 | 121 | 156 | 155 | 165 | 187 | 161 | 129 | 116 | 94 | 65 | 56 | 91 | 122 |
| pm10 | 52 | 67 | 51 | 37 | 69 | 76 | 80 | 84 | 52 | 43 | 50 | 54 | 73 | 80 | 102 | 86 | 118 | 84 | 93 | 90 |
| so2 | 8.6 | 10 | 5.8 | 5.6 | 4.6 | 7.2 | 10 | 9.9 | 8 | 8.8 | 8.6 | 5.7 | 9.9 | 14 | 13 | 5.7 | 13 | 10 | 7.2 | 6.5 |