Air Pollution in Hongshancun: Real-time Air Quality Index and smog alert.
Pollution and air quality forecast for Hongshancun. Today is Tuesday, June 2, 2026. The following air pollution values have been recorded for Hongshancun:- particulate matter (PM10) suspended dust - 179 (Very bad Hazardous)
- particulate matter (PM2.5) dust - 35 (Unhealthy for Sensitive Groups)
- ozone (O3) - 0 (Good)
- nitrogen dioxide (NO2) - 0 (Good)
- sulfur dioxide (SO2) - 0 (Good)

What is the air quality in Hongshancun today? Is the air polluted in Hongshancun?. Is there smog?
What is the level of PM10 today in Hongshancun? (particulate matter (PM10) suspended dust)
The current level of particulate matter PM10 in Hongshancun is:
179 (Very bad Hazardous)
The highest PM10 values usually occur in month: 103 (January 2019).
The lowest value of particulate matter PM10 pollution in Hongshancun is usually recorded in: August (30).
What is the current level of PM2.5 in Hongshancun? (particulate matter (PM2.5) dust)
Today's PM2.5 level is:
35 (Unhealthy for Sensitive Groups)
For comparison, the highest level of PM2.5 in Hongshancun in the last 7 days was: 56 (Friday, May 27, 2022) and the lowest: 56 (Friday, May 27, 2022).
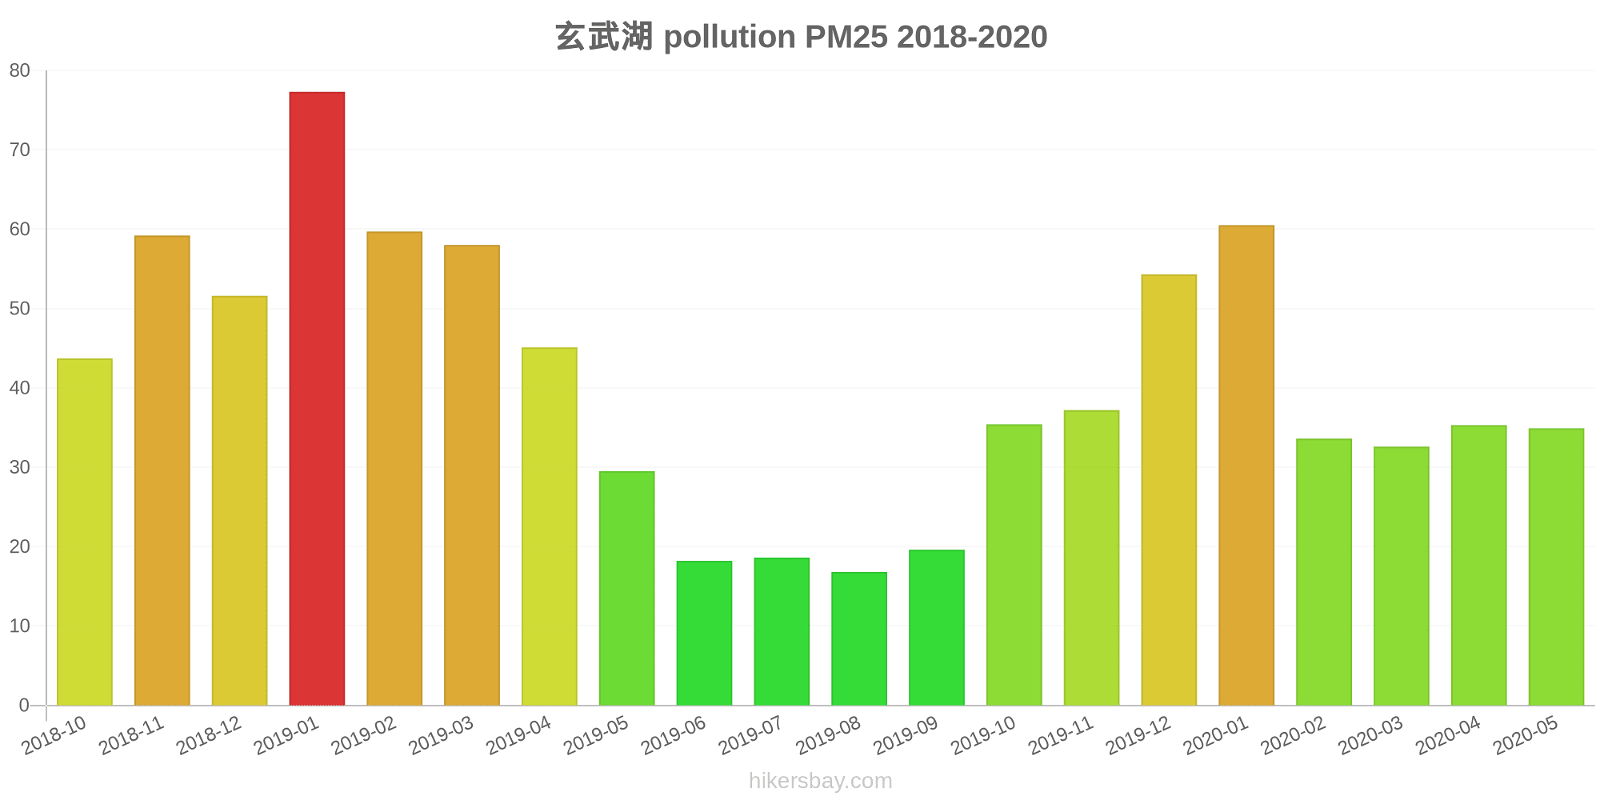
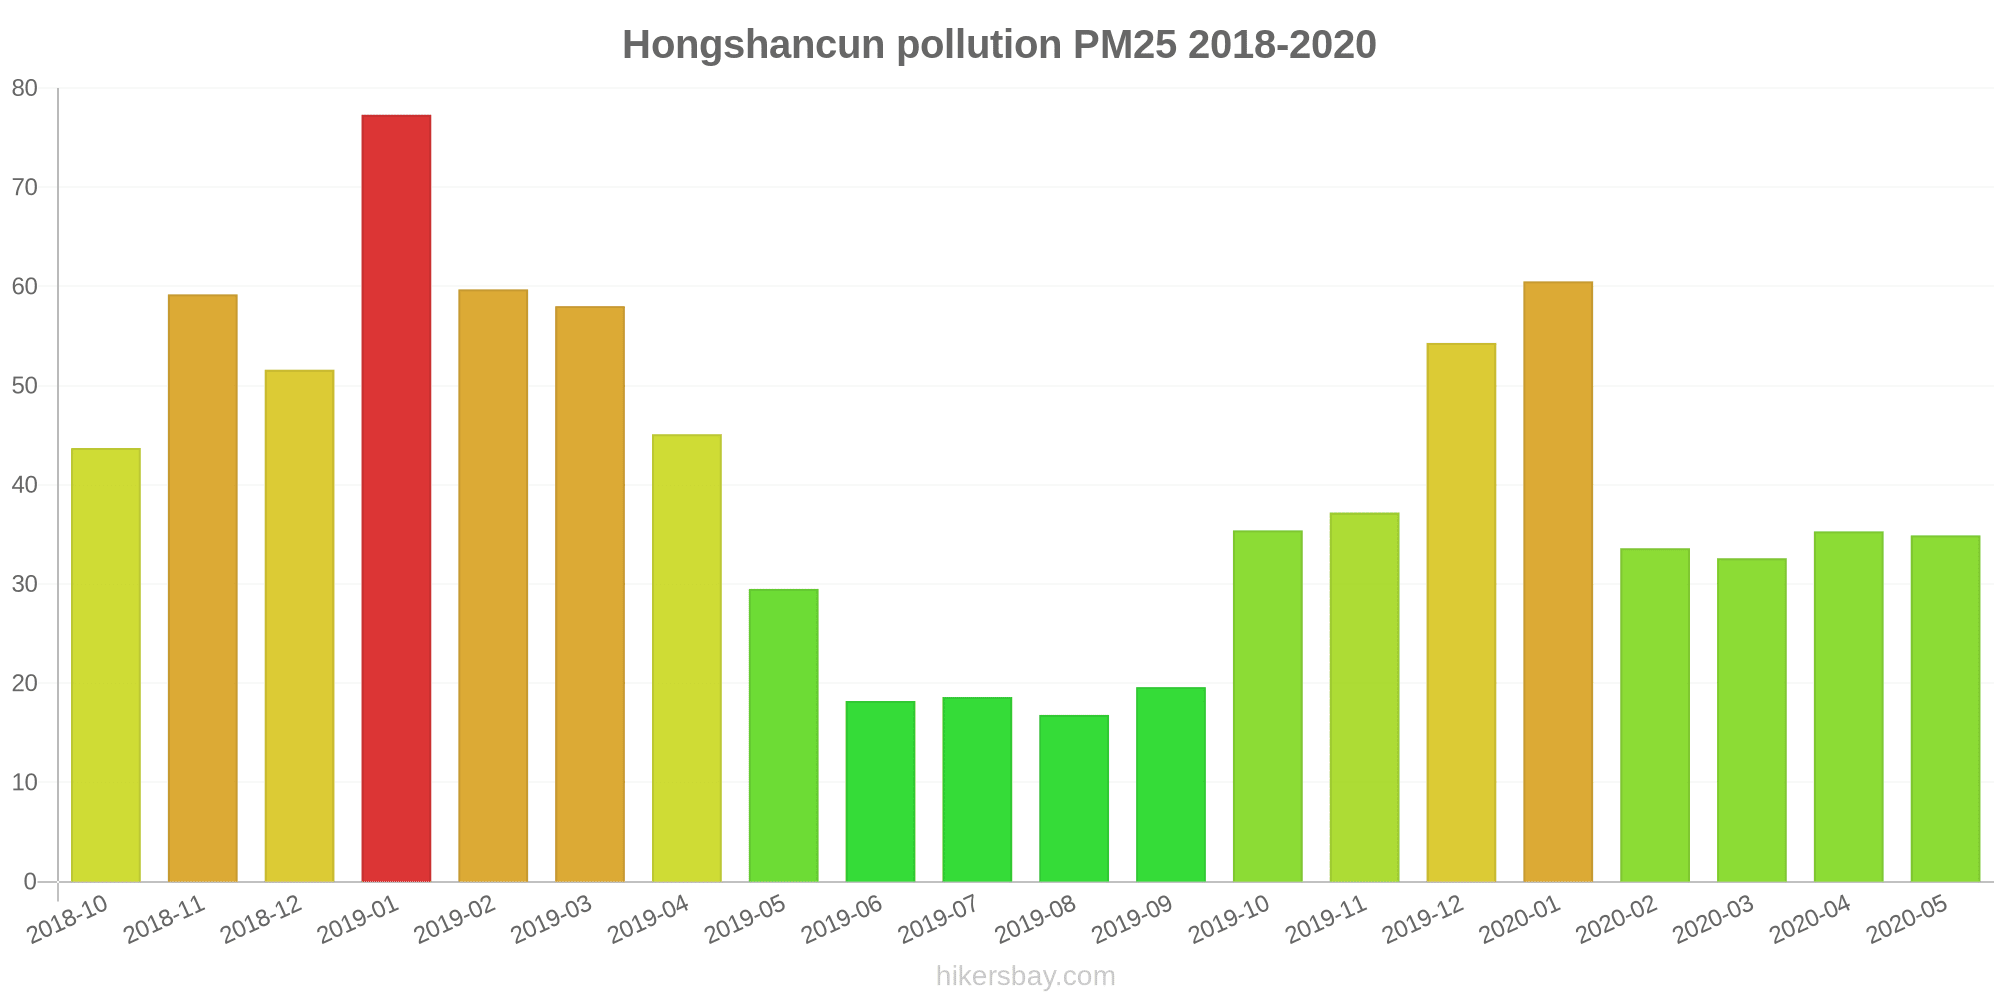
The highest PM2.5 values were recorded: 77 (January 2019).
The lowest level of particulate matter PM2.5 pollution occurs in month: August (17).
How is the O3 level today in Hongshancun? (ozone (O3))
0 (Good)
How high is the level of NO2? (nitrogen dioxide (NO2))
0 (Good)
What is the level of SO2 pollution? (sulfur dioxide (SO2))
0 (Good)
Current data Friday, May 27, 2022, 12:00 PM
PM10 179 (Very bad Hazardous)
PM2,5 35 (Unhealthy for Sensitive Groups)
O3 0 (Good)
NO2 0 (Good)
SO2 0 (Good)
Data on air pollution from recent days in Hongshancun
index
2022-05-27
pm10
56
Unhealthy for Sensitive Groups
pm25
56
Unhealthy
o3
0
Good
no2
0
Good
so2
0
Good
data source »
Air pollution in Hongshancun from October 2018 to May 2020

index
2020-05
2020-04
2020-03
2020-02
2020-01
2019-12
2019-11
2019-10
2019-09
2019-08
2019-07
2019-06
2019-05
2019-04
2019-03
2019-02
2019-01
2018-12
2018-11
2018-10
pm25
35 (Moderate)
35 (Unhealthy for Sensitive Groups)
33 (Moderate)
34 (Moderate)
61 (Unhealthy)
54 (Unhealthy for Sensitive Groups)
37 (Unhealthy for Sensitive Groups)
35 (Unhealthy for Sensitive Groups)
20 (Moderate)
17 (Moderate)
19 (Moderate)
18 (Moderate)
30 (Moderate)
45 (Unhealthy for Sensitive Groups)
58 (Unhealthy)
60 (Unhealthy)
77 (Very Unhealthy)
52 (Unhealthy for Sensitive Groups)
59 (Unhealthy)
44 (Unhealthy for Sensitive Groups)
co
645 (Good)
1 (Good)
997 (Good)
732 (Good)
684 (Good)
973 (Good)
674 (Good)
615 (Good)
595 (Good)
545 (Good)
627 (Good)
806 (Good)
611 (Good)
706 (Good)
715 (Good)
800 (Good)
967 (Good)
768 (Good)
877 (Good)
651 (Good)
no2
30 (Good)
45 (Moderate)
43 (Moderate)
26 (Good)
43 (Moderate)
52 (Moderate)
53 (Moderate)
52 (Moderate)
43 (Moderate)
28 (Good)
31 (Good)
23 (Good)
26 (Good)
44 (Moderate)
61 (Moderate)
43 (Moderate)
55 (Moderate)
46 (Moderate)
51 (Moderate)
47 (Moderate)
o3
141 (Unhealthy for Sensitive Groups)
147 (Unhealthy for Sensitive Groups)
116 (Moderate)
98 (Moderate)
71 (Moderate)
68 (Good)
101 (Moderate)
119 (Moderate)
155 (Unhealthy)
151 (Unhealthy)
163 (Unhealthy)
184 (Very Unhealthy)
167 (Unhealthy)
128 (Unhealthy for Sensitive Groups)
118 (Moderate)
89 (Moderate)
70 (Good)
51 (Good)
89 (Moderate)
114 (Moderate)
pm10
50 (Moderate)
61 (Unhealthy for Sensitive Groups)
54 (Unhealthy for Sensitive Groups)
40 (Moderate)
75 (Unhealthy for Sensitive Groups)
79 (Unhealthy for Sensitive Groups)
77 (Unhealthy for Sensitive Groups)
75 (Unhealthy for Sensitive Groups)
39 (Moderate)
30 (Moderate)
34 (Moderate)
35 (Moderate)
53 (Unhealthy for Sensitive Groups)
63 (Unhealthy for Sensitive Groups)
87 (Unhealthy)
77 (Unhealthy for Sensitive Groups)
103 (Unhealthy)
75 (Unhealthy for Sensitive Groups)
76 (Unhealthy for Sensitive Groups)
65 (Unhealthy for Sensitive Groups)
so2
9.5 (Good)
9.2 (Good)
8.5 (Good)
7.2 (Good)
5.2 (Good)
8.1 (Good)
7 (Good)
7 (Good)
4.9 (Good)
5.3 (Good)
6.8 (Good)
9.4 (Good)
14 (Good)
11 (Good)
16 (Good)
6.6 (Good)
8.9 (Good)
7.7 (Good)
6.7 (Good)
7.4 (Good)
data source »
玄武湖
Friday, May 27, 2022, 12:00 PM
PM10 179 (Very bad Hazardous)
particulate matter (PM10) suspended dust
PM2,5 35 (Unhealthy for Sensitive Groups)
particulate matter (PM2.5) dust
O3 0.04 (Good)
ozone (O3)
NO2 0 (Good)
nitrogen dioxide (NO2)
SO2 0 (Good)
sulfur dioxide (SO2)
玄武湖
index
2022-05-27
pm10
56
pm25
56
o3
0.03
no2
0
so2
0
玄武湖
2018-10 2020-05
index
2020-05
2020-04
2020-03
2020-02
2020-01
2019-12
2019-11
2019-10
2019-09
2019-08
2019-07
2019-06
2019-05
2019-04
2019-03
2019-02
2019-01
2018-12
2018-11
2018-10
pm25
35
35
33
34
61
54
37
35
20
17
19
18
30
45
58
60
77
52
59
44
co
645
1
997
732
684
973
674
615
595
545
627
806
611
706
715
800
967
768
877
651
no2
30
45
43
26
43
52
53
52
43
28
31
23
26
44
61
43
55
46
51
47
o3
141
147
116
98
71
68
101
119
155
151
163
184
167
128
118
89
70
51
89
114
pm10
50
61
54
40
75
79
77
75
39
30
34
35
53
63
87
77
103
75
76
65
so2
9.5
9.2
8.5
7.2
5.2
8.1
7
7
4.9
5.3
6.8
9.4
14
11
16
6.6
8.9
7.7
6.7
7.4
* Pollution data source:
https://openaq.org
(ChinaAQIData)
The data is licensed under CC-By 4.0
PM10 179 (Very bad Hazardous)
PM2,5 35 (Unhealthy for Sensitive Groups)
O3 0 (Good)
NO2 0 (Good)
SO2 0 (Good)
Data on air pollution from recent days in Hongshancun
| index | 2022-05-27 |
|---|---|
| pm10 | 56 Unhealthy for Sensitive Groups |
| pm25 | 56 Unhealthy |
| o3 | 0 Good |
| no2 | 0 Good |
| so2 | 0 Good |
| index | 2020-05 | 2020-04 | 2020-03 | 2020-02 | 2020-01 | 2019-12 | 2019-11 | 2019-10 | 2019-09 | 2019-08 | 2019-07 | 2019-06 | 2019-05 | 2019-04 | 2019-03 | 2019-02 | 2019-01 | 2018-12 | 2018-11 | 2018-10 |
|---|---|---|---|---|---|---|---|---|---|---|---|---|---|---|---|---|---|---|---|---|
| pm25 | 35 (Moderate) | 35 (Unhealthy for Sensitive Groups) | 33 (Moderate) | 34 (Moderate) | 61 (Unhealthy) | 54 (Unhealthy for Sensitive Groups) | 37 (Unhealthy for Sensitive Groups) | 35 (Unhealthy for Sensitive Groups) | 20 (Moderate) | 17 (Moderate) | 19 (Moderate) | 18 (Moderate) | 30 (Moderate) | 45 (Unhealthy for Sensitive Groups) | 58 (Unhealthy) | 60 (Unhealthy) | 77 (Very Unhealthy) | 52 (Unhealthy for Sensitive Groups) | 59 (Unhealthy) | 44 (Unhealthy for Sensitive Groups) |
| co | 645 (Good) | 1 (Good) | 997 (Good) | 732 (Good) | 684 (Good) | 973 (Good) | 674 (Good) | 615 (Good) | 595 (Good) | 545 (Good) | 627 (Good) | 806 (Good) | 611 (Good) | 706 (Good) | 715 (Good) | 800 (Good) | 967 (Good) | 768 (Good) | 877 (Good) | 651 (Good) |
| no2 | 30 (Good) | 45 (Moderate) | 43 (Moderate) | 26 (Good) | 43 (Moderate) | 52 (Moderate) | 53 (Moderate) | 52 (Moderate) | 43 (Moderate) | 28 (Good) | 31 (Good) | 23 (Good) | 26 (Good) | 44 (Moderate) | 61 (Moderate) | 43 (Moderate) | 55 (Moderate) | 46 (Moderate) | 51 (Moderate) | 47 (Moderate) |
| o3 | 141 (Unhealthy for Sensitive Groups) | 147 (Unhealthy for Sensitive Groups) | 116 (Moderate) | 98 (Moderate) | 71 (Moderate) | 68 (Good) | 101 (Moderate) | 119 (Moderate) | 155 (Unhealthy) | 151 (Unhealthy) | 163 (Unhealthy) | 184 (Very Unhealthy) | 167 (Unhealthy) | 128 (Unhealthy for Sensitive Groups) | 118 (Moderate) | 89 (Moderate) | 70 (Good) | 51 (Good) | 89 (Moderate) | 114 (Moderate) |
| pm10 | 50 (Moderate) | 61 (Unhealthy for Sensitive Groups) | 54 (Unhealthy for Sensitive Groups) | 40 (Moderate) | 75 (Unhealthy for Sensitive Groups) | 79 (Unhealthy for Sensitive Groups) | 77 (Unhealthy for Sensitive Groups) | 75 (Unhealthy for Sensitive Groups) | 39 (Moderate) | 30 (Moderate) | 34 (Moderate) | 35 (Moderate) | 53 (Unhealthy for Sensitive Groups) | 63 (Unhealthy for Sensitive Groups) | 87 (Unhealthy) | 77 (Unhealthy for Sensitive Groups) | 103 (Unhealthy) | 75 (Unhealthy for Sensitive Groups) | 76 (Unhealthy for Sensitive Groups) | 65 (Unhealthy for Sensitive Groups) |
| so2 | 9.5 (Good) | 9.2 (Good) | 8.5 (Good) | 7.2 (Good) | 5.2 (Good) | 8.1 (Good) | 7 (Good) | 7 (Good) | 4.9 (Good) | 5.3 (Good) | 6.8 (Good) | 9.4 (Good) | 14 (Good) | 11 (Good) | 16 (Good) | 6.6 (Good) | 8.9 (Good) | 7.7 (Good) | 6.7 (Good) | 7.4 (Good) |
PM10 179 (Very bad Hazardous)
particulate matter (PM10) suspended dustPM2,5 35 (Unhealthy for Sensitive Groups)
particulate matter (PM2.5) dustO3 0.04 (Good)
ozone (O3)NO2 0 (Good)
nitrogen dioxide (NO2)SO2 0 (Good)
sulfur dioxide (SO2)玄武湖
| index | 2022-05-27 |
|---|---|
| pm10 | 56 |
| pm25 | 56 |
| o3 | 0.03 |
| no2 | 0 |
| so2 | 0 |
玄武湖

| index | 2020-05 | 2020-04 | 2020-03 | 2020-02 | 2020-01 | 2019-12 | 2019-11 | 2019-10 | 2019-09 | 2019-08 | 2019-07 | 2019-06 | 2019-05 | 2019-04 | 2019-03 | 2019-02 | 2019-01 | 2018-12 | 2018-11 | 2018-10 |
|---|---|---|---|---|---|---|---|---|---|---|---|---|---|---|---|---|---|---|---|---|
| pm25 | 35 | 35 | 33 | 34 | 61 | 54 | 37 | 35 | 20 | 17 | 19 | 18 | 30 | 45 | 58 | 60 | 77 | 52 | 59 | 44 |
| co | 645 | 1 | 997 | 732 | 684 | 973 | 674 | 615 | 595 | 545 | 627 | 806 | 611 | 706 | 715 | 800 | 967 | 768 | 877 | 651 |
| no2 | 30 | 45 | 43 | 26 | 43 | 52 | 53 | 52 | 43 | 28 | 31 | 23 | 26 | 44 | 61 | 43 | 55 | 46 | 51 | 47 |
| o3 | 141 | 147 | 116 | 98 | 71 | 68 | 101 | 119 | 155 | 151 | 163 | 184 | 167 | 128 | 118 | 89 | 70 | 51 | 89 | 114 |
| pm10 | 50 | 61 | 54 | 40 | 75 | 79 | 77 | 75 | 39 | 30 | 34 | 35 | 53 | 63 | 87 | 77 | 103 | 75 | 76 | 65 |
| so2 | 9.5 | 9.2 | 8.5 | 7.2 | 5.2 | 8.1 | 7 | 7 | 4.9 | 5.3 | 6.8 | 9.4 | 14 | 11 | 16 | 6.6 | 8.9 | 7.7 | 6.7 | 7.4 |