Air Pollution in Xiangfang Xincun: Real-time Air Quality Index and smog alert.
Pollution and air quality forecast for Xiangfang Xincun. Today is Tuesday, June 2, 2026. The following air pollution values have been recorded for Xiangfang Xincun:- particulate matter (PM10) suspended dust - 179 (Very bad Hazardous)
- particulate matter (PM2.5) dust - 35 (Unhealthy for Sensitive Groups)
- ozone (O3) - 0 (Good)
- nitrogen dioxide (NO2) - 0 (Good)
- sulfur dioxide (SO2) - 0 (Good)

What is the air quality in Xiangfang Xincun today? Is the air polluted in Xiangfang Xincun?. Is there smog?
What is the level of PM10 today in Xiangfang Xincun? (particulate matter (PM10) suspended dust)
The current level of particulate matter PM10 in Xiangfang Xincun is:
179 (Very bad Hazardous)
The highest PM10 values usually occur in month: 106 (January 2019).
The lowest value of particulate matter PM10 pollution in Xiangfang Xincun is usually recorded in: August (34).
What is the current level of PM2.5 in Xiangfang Xincun? (particulate matter (PM2.5) dust)
Today's PM2.5 level is:
35 (Unhealthy for Sensitive Groups)
For comparison, the highest level of PM2.5 in Xiangfang Xincun in the last 7 days was: 56 (Friday, May 27, 2022) and the lowest: 56 (Friday, May 27, 2022).
The highest PM2.5 values were recorded: 73 (January 2019).
The lowest level of particulate matter PM2.5 pollution occurs in month: August (22).
How is the O3 level today in Xiangfang Xincun? (ozone (O3))
0 (Good)
How high is the level of NO2? (nitrogen dioxide (NO2))
0 (Good)
What is the level of SO2 pollution? (sulfur dioxide (SO2))
0 (Good)
Current data Friday, May 27, 2022, 12:00 PM
PM10 179 (Very bad Hazardous)
PM2,5 35 (Unhealthy for Sensitive Groups)
O3 0 (Good)
NO2 0 (Good)
SO2 0 (Good)
Data on air pollution from recent days in Xiangfang Xincun
index
2022-05-27
pm10
56
Unhealthy for Sensitive Groups
pm25
56
Unhealthy
o3
0
Good
no2
0
Good
so2
0
Good
data source »
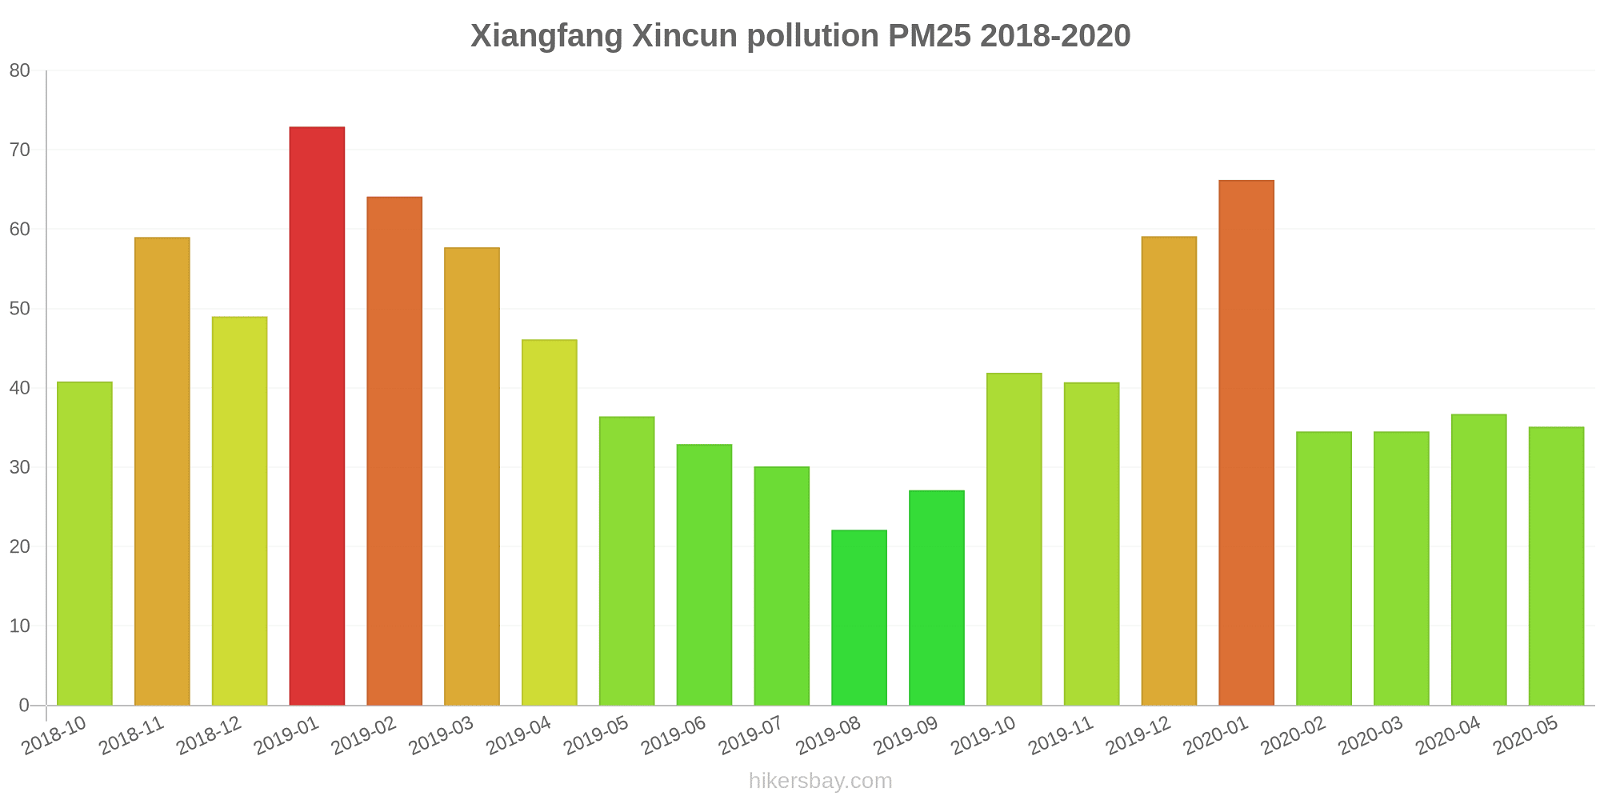
Air pollution in Xiangfang Xincun from October 2018 to May 2020
index
2020-05
2020-04
2020-03
2020-02
2020-01
2019-12
2019-11
2019-10
2019-09
2019-08
2019-07
2019-06
2019-05
2019-04
2019-03
2019-02
2019-01
2018-12
2018-11
2018-10
pm25
35 (Unhealthy for Sensitive Groups)
37 (Unhealthy for Sensitive Groups)
35 (Moderate)
35 (Moderate)
66 (Unhealthy)
59 (Unhealthy)
41 (Unhealthy for Sensitive Groups)
42 (Unhealthy for Sensitive Groups)
27 (Moderate)
22 (Moderate)
30 (Moderate)
33 (Moderate)
36 (Unhealthy for Sensitive Groups)
46 (Unhealthy for Sensitive Groups)
58 (Unhealthy)
64 (Unhealthy)
73 (Unhealthy)
49 (Unhealthy for Sensitive Groups)
59 (Unhealthy)
41 (Unhealthy for Sensitive Groups)
co
1 (Good)
677 (Good)
766 (Good)
729 (Good)
861 (Good)
1 (Good)
935 (Good)
1 (Good)
930 (Good)
801 (Good)
932 (Good)
1 (Good)
887 (Good)
983 (Good)
1 (Good)
1 (Good)
1 (Good)
1 (Good)
1 (Good)
743 (Good)
no2
35 (Good)
47 (Moderate)
34 (Good)
28 (Good)
40 (Moderate)
60 (Moderate)
52 (Moderate)
47 (Moderate)
33 (Good)
26 (Good)
29 (Good)
23 (Good)
34 (Good)
38 (Good)
47 (Moderate)
34 (Good)
52 (Moderate)
46 (Moderate)
47 (Moderate)
42 (Moderate)
o3
150 (Unhealthy)
147 (Unhealthy for Sensitive Groups)
110 (Moderate)
92 (Moderate)
68 (Good)
66 (Good)
104 (Moderate)
126 (Unhealthy for Sensitive Groups)
161 (Unhealthy)
165 (Unhealthy)
166 (Unhealthy)
191 (Very Unhealthy)
170 (Unhealthy)
135 (Unhealthy for Sensitive Groups)
107 (Moderate)
83 (Moderate)
56 (Good)
49 (Good)
82 (Moderate)
115 (Moderate)
pm10
56 (Unhealthy for Sensitive Groups)
67 (Unhealthy for Sensitive Groups)
56 (Unhealthy for Sensitive Groups)
43 (Moderate)
77 (Unhealthy for Sensitive Groups)
80 (Unhealthy)
79 (Unhealthy for Sensitive Groups)
76 (Unhealthy for Sensitive Groups)
43 (Moderate)
34 (Moderate)
44 (Moderate)
49 (Moderate)
65 (Unhealthy for Sensitive Groups)
71 (Unhealthy for Sensitive Groups)
92 (Unhealthy)
78 (Unhealthy for Sensitive Groups)
106 (Unhealthy)
79 (Unhealthy for Sensitive Groups)
85 (Unhealthy)
75 (Unhealthy for Sensitive Groups)
so2
10 (Good)
10 (Good)
8.8 (Good)
6.5 (Good)
9 (Good)
11 (Good)
10 (Good)
12 (Good)
8.7 (Good)
11 (Good)
10 (Good)
11 (Good)
13 (Good)
14 (Good)
15 (Good)
11 (Good)
12 (Good)
11 (Good)
8.5 (Good)
8.8 (Good)
data source »
瑞金路
Friday, May 27, 2022, 12:00 PM
PM10 179 (Very bad Hazardous)
particulate matter (PM10) suspended dust
PM2,5 35 (Unhealthy for Sensitive Groups)
particulate matter (PM2.5) dust
O3 0.04 (Good)
ozone (O3)
NO2 0 (Good)
nitrogen dioxide (NO2)
SO2 0 (Good)
sulfur dioxide (SO2)
瑞金路
index
2022-05-27
pm10
56
pm25
56
o3
0.03
no2
0
so2
0
瑞金路
2018-10 2020-05

index
2020-05
2020-04
2020-03
2020-02
2020-01
2019-12
2019-11
2019-10
2019-09
2019-08
2019-07
2019-06
2019-05
2019-04
2019-03
2019-02
2019-01
2018-12
2018-11
2018-10
pm25
35
37
35
35
66
59
41
42
27
22
30
33
36
46
58
64
73
49
59
41
co
1
677
766
729
861
1
935
1
930
801
932
1
887
983
1
1
1
1
1
743
no2
35
47
34
28
40
60
52
47
33
26
29
23
34
38
47
34
52
46
47
42
o3
150
147
110
92
68
66
104
126
161
165
166
191
170
135
107
83
56
49
82
115
pm10
56
67
56
43
77
80
79
76
43
34
44
49
65
71
92
78
106
79
85
75
so2
10
10
8.8
6.5
9
11
10
12
8.7
11
10
11
13
14
15
11
12
11
8.5
8.8
* Pollution data source:
https://openaq.org
(ChinaAQIData)
The data is licensed under CC-By 4.0
PM10 179 (Very bad Hazardous)
PM2,5 35 (Unhealthy for Sensitive Groups)
O3 0 (Good)
NO2 0 (Good)
SO2 0 (Good)
Data on air pollution from recent days in Xiangfang Xincun
| index | 2022-05-27 |
|---|---|
| pm10 | 56 Unhealthy for Sensitive Groups |
| pm25 | 56 Unhealthy |
| o3 | 0 Good |
| no2 | 0 Good |
| so2 | 0 Good |

| index | 2020-05 | 2020-04 | 2020-03 | 2020-02 | 2020-01 | 2019-12 | 2019-11 | 2019-10 | 2019-09 | 2019-08 | 2019-07 | 2019-06 | 2019-05 | 2019-04 | 2019-03 | 2019-02 | 2019-01 | 2018-12 | 2018-11 | 2018-10 |
|---|---|---|---|---|---|---|---|---|---|---|---|---|---|---|---|---|---|---|---|---|
| pm25 | 35 (Unhealthy for Sensitive Groups) | 37 (Unhealthy for Sensitive Groups) | 35 (Moderate) | 35 (Moderate) | 66 (Unhealthy) | 59 (Unhealthy) | 41 (Unhealthy for Sensitive Groups) | 42 (Unhealthy for Sensitive Groups) | 27 (Moderate) | 22 (Moderate) | 30 (Moderate) | 33 (Moderate) | 36 (Unhealthy for Sensitive Groups) | 46 (Unhealthy for Sensitive Groups) | 58 (Unhealthy) | 64 (Unhealthy) | 73 (Unhealthy) | 49 (Unhealthy for Sensitive Groups) | 59 (Unhealthy) | 41 (Unhealthy for Sensitive Groups) |
| co | 1 (Good) | 677 (Good) | 766 (Good) | 729 (Good) | 861 (Good) | 1 (Good) | 935 (Good) | 1 (Good) | 930 (Good) | 801 (Good) | 932 (Good) | 1 (Good) | 887 (Good) | 983 (Good) | 1 (Good) | 1 (Good) | 1 (Good) | 1 (Good) | 1 (Good) | 743 (Good) |
| no2 | 35 (Good) | 47 (Moderate) | 34 (Good) | 28 (Good) | 40 (Moderate) | 60 (Moderate) | 52 (Moderate) | 47 (Moderate) | 33 (Good) | 26 (Good) | 29 (Good) | 23 (Good) | 34 (Good) | 38 (Good) | 47 (Moderate) | 34 (Good) | 52 (Moderate) | 46 (Moderate) | 47 (Moderate) | 42 (Moderate) |
| o3 | 150 (Unhealthy) | 147 (Unhealthy for Sensitive Groups) | 110 (Moderate) | 92 (Moderate) | 68 (Good) | 66 (Good) | 104 (Moderate) | 126 (Unhealthy for Sensitive Groups) | 161 (Unhealthy) | 165 (Unhealthy) | 166 (Unhealthy) | 191 (Very Unhealthy) | 170 (Unhealthy) | 135 (Unhealthy for Sensitive Groups) | 107 (Moderate) | 83 (Moderate) | 56 (Good) | 49 (Good) | 82 (Moderate) | 115 (Moderate) |
| pm10 | 56 (Unhealthy for Sensitive Groups) | 67 (Unhealthy for Sensitive Groups) | 56 (Unhealthy for Sensitive Groups) | 43 (Moderate) | 77 (Unhealthy for Sensitive Groups) | 80 (Unhealthy) | 79 (Unhealthy for Sensitive Groups) | 76 (Unhealthy for Sensitive Groups) | 43 (Moderate) | 34 (Moderate) | 44 (Moderate) | 49 (Moderate) | 65 (Unhealthy for Sensitive Groups) | 71 (Unhealthy for Sensitive Groups) | 92 (Unhealthy) | 78 (Unhealthy for Sensitive Groups) | 106 (Unhealthy) | 79 (Unhealthy for Sensitive Groups) | 85 (Unhealthy) | 75 (Unhealthy for Sensitive Groups) |
| so2 | 10 (Good) | 10 (Good) | 8.8 (Good) | 6.5 (Good) | 9 (Good) | 11 (Good) | 10 (Good) | 12 (Good) | 8.7 (Good) | 11 (Good) | 10 (Good) | 11 (Good) | 13 (Good) | 14 (Good) | 15 (Good) | 11 (Good) | 12 (Good) | 11 (Good) | 8.5 (Good) | 8.8 (Good) |
PM10 179 (Very bad Hazardous)
particulate matter (PM10) suspended dustPM2,5 35 (Unhealthy for Sensitive Groups)
particulate matter (PM2.5) dustO3 0.04 (Good)
ozone (O3)NO2 0 (Good)
nitrogen dioxide (NO2)SO2 0 (Good)
sulfur dioxide (SO2)瑞金路
| index | 2022-05-27 |
|---|---|
| pm10 | 56 |
| pm25 | 56 |
| o3 | 0.03 |
| no2 | 0 |
| so2 | 0 |
瑞金路

| index | 2020-05 | 2020-04 | 2020-03 | 2020-02 | 2020-01 | 2019-12 | 2019-11 | 2019-10 | 2019-09 | 2019-08 | 2019-07 | 2019-06 | 2019-05 | 2019-04 | 2019-03 | 2019-02 | 2019-01 | 2018-12 | 2018-11 | 2018-10 |
|---|---|---|---|---|---|---|---|---|---|---|---|---|---|---|---|---|---|---|---|---|
| pm25 | 35 | 37 | 35 | 35 | 66 | 59 | 41 | 42 | 27 | 22 | 30 | 33 | 36 | 46 | 58 | 64 | 73 | 49 | 59 | 41 |
| co | 1 | 677 | 766 | 729 | 861 | 1 | 935 | 1 | 930 | 801 | 932 | 1 | 887 | 983 | 1 | 1 | 1 | 1 | 1 | 743 |
| no2 | 35 | 47 | 34 | 28 | 40 | 60 | 52 | 47 | 33 | 26 | 29 | 23 | 34 | 38 | 47 | 34 | 52 | 46 | 47 | 42 |
| o3 | 150 | 147 | 110 | 92 | 68 | 66 | 104 | 126 | 161 | 165 | 166 | 191 | 170 | 135 | 107 | 83 | 56 | 49 | 82 | 115 |
| pm10 | 56 | 67 | 56 | 43 | 77 | 80 | 79 | 76 | 43 | 34 | 44 | 49 | 65 | 71 | 92 | 78 | 106 | 79 | 85 | 75 |
| so2 | 10 | 10 | 8.8 | 6.5 | 9 | 11 | 10 | 12 | 8.7 | 11 | 10 | 11 | 13 | 14 | 15 | 11 | 12 | 11 | 8.5 | 8.8 |