Air Pollution in Xinjian: Real-time Air Quality Index and smog alert.
Pollution and air quality forecast for Xinjian. Today is Tuesday, June 2, 2026. The following air pollution values have been recorded for Xinjian:- particulate matter (PM10) suspended dust - 179 (Very bad Hazardous)
- particulate matter (PM2.5) dust - 35 (Unhealthy for Sensitive Groups)
- ozone (O3) - 0 (Good)
- nitrogen dioxide (NO2) - 0 (Good)
- sulfur dioxide (SO2) - 0 (Good)

What is the air quality in Xinjian today? Is the air polluted in Xinjian?. Is there smog?
What is the level of PM10 today in Xinjian? (particulate matter (PM10) suspended dust)
The current level of particulate matter PM10 in Xinjian is:
179 (Very bad Hazardous)
The highest PM10 values usually occur in month: 119 (January 2019).
The lowest value of particulate matter PM10 pollution in Xinjian is usually recorded in: August (31).
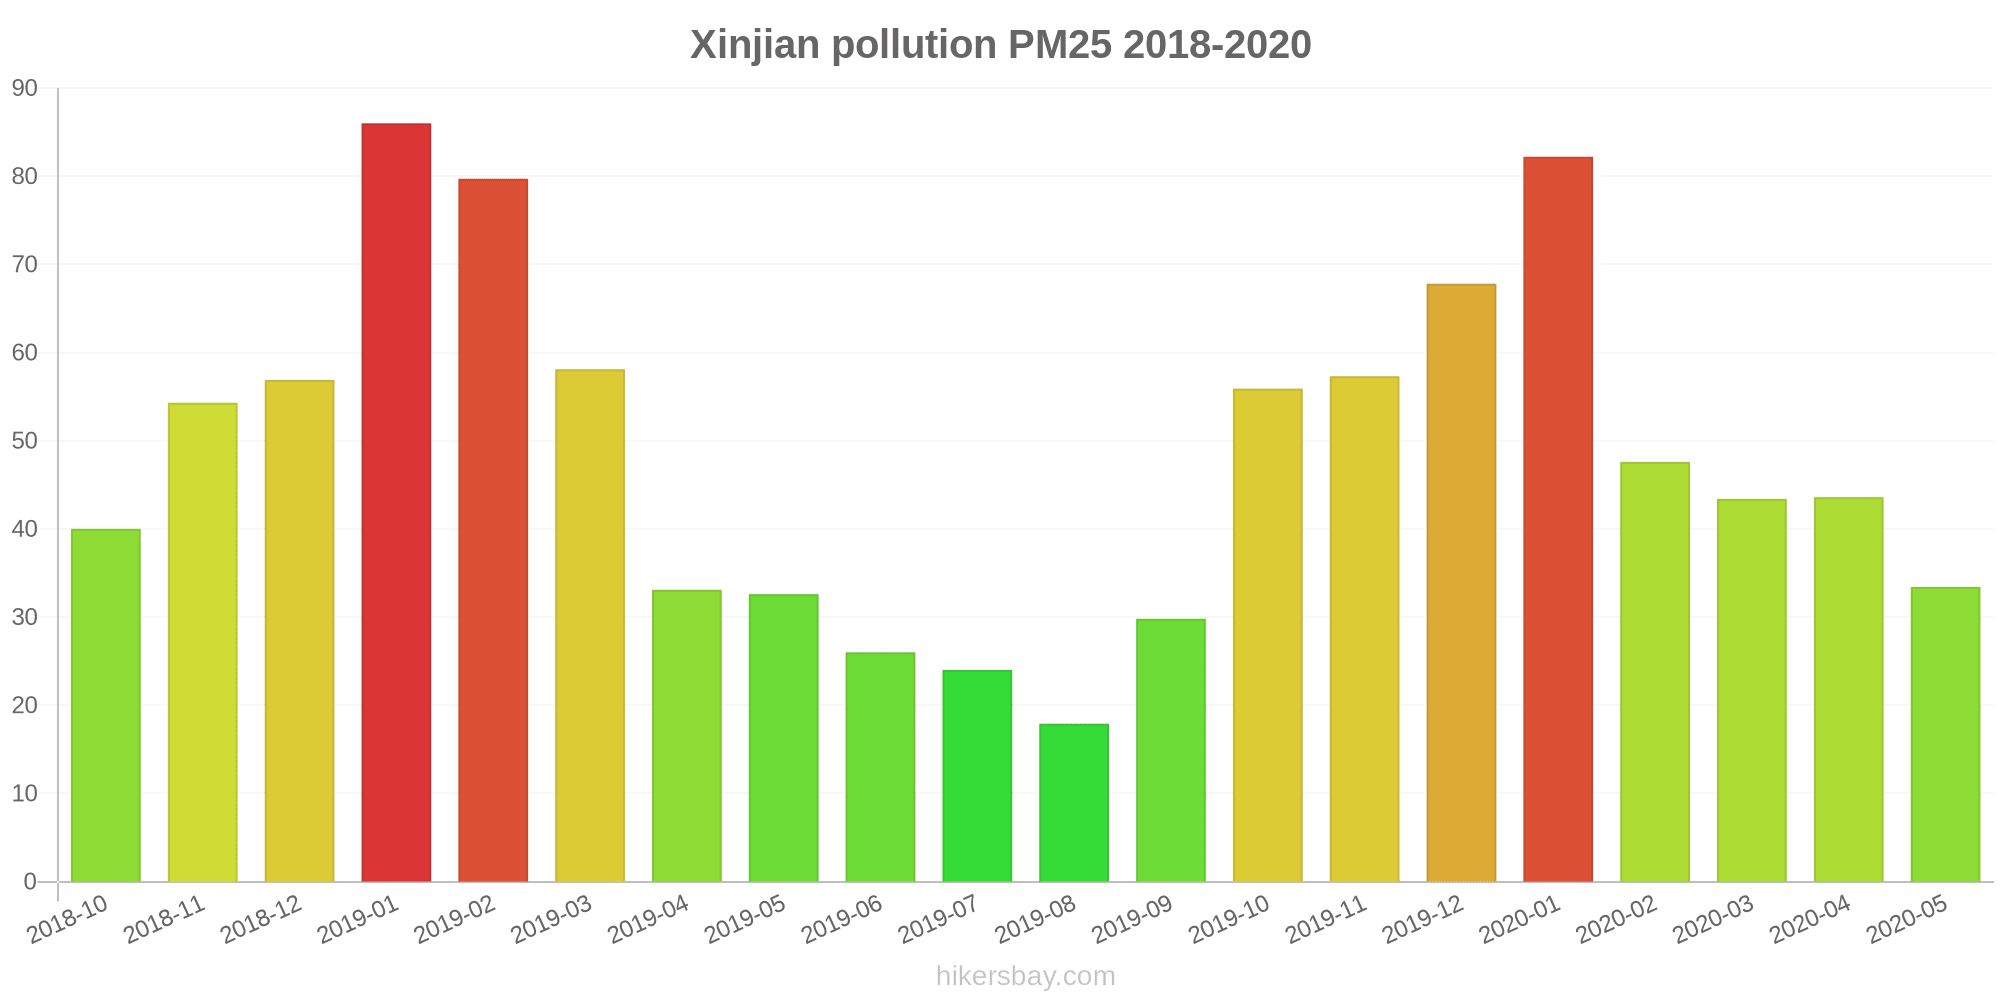
What is the current level of PM2.5 in Xinjian? (particulate matter (PM2.5) dust)
Today's PM2.5 level is:
35 (Unhealthy for Sensitive Groups)
For comparison, the highest level of PM2.5 in Xinjian in the last 7 days was: 56 (Friday, May 27, 2022) and the lowest: 56 (Friday, May 27, 2022).
The highest PM2.5 values were recorded: 86 (January 2019).
The lowest level of particulate matter PM2.5 pollution occurs in month: August (18).
How is the O3 level today in Xinjian? (ozone (O3))
0 (Good)
How high is the level of NO2? (nitrogen dioxide (NO2))
0 (Good)
What is the level of SO2 pollution? (sulfur dioxide (SO2))
0 (Good)
Current data Friday, May 27, 2022, 12:00 PM
PM10 179 (Very bad Hazardous)
PM2,5 35 (Unhealthy for Sensitive Groups)
O3 0 (Good)
NO2 0 (Good)
SO2 0 (Good)
Data on air pollution from recent days in Xinjian
index
2022-05-27
pm10
56
Unhealthy for Sensitive Groups
pm25
56
Unhealthy
o3
0
Good
no2
0
Good
so2
0
Good
data source »
Air pollution in Xinjian from October 2018 to May 2020

index
2020-05
2020-04
2020-03
2020-02
2020-01
2019-12
2019-11
2019-10
2019-09
2019-08
2019-07
2019-06
2019-05
2019-04
2019-03
2019-02
2019-01
2018-12
2018-11
2018-10
pm25
33 (Moderate)
44 (Unhealthy for Sensitive Groups)
43 (Unhealthy for Sensitive Groups)
48 (Unhealthy for Sensitive Groups)
82 (Very Unhealthy)
68 (Unhealthy)
57 (Unhealthy)
56 (Unhealthy)
30 (Moderate)
18 (Moderate)
24 (Moderate)
26 (Moderate)
33 (Moderate)
33 (Moderate)
58 (Unhealthy)
80 (Very Unhealthy)
86 (Very Unhealthy)
57 (Unhealthy)
54 (Unhealthy for Sensitive Groups)
40 (Unhealthy for Sensitive Groups)
co
536 (Good)
667 (Good)
654 (Good)
660 (Good)
864 (Good)
827 (Good)
627 (Good)
779 (Good)
646 (Good)
469 (Good)
573 (Good)
871 (Good)
801 (Good)
721 (Good)
741 (Good)
1 (Good)
991 (Good)
809 (Good)
817 (Good)
631 (Good)
no2
15 (Good)
19 (Good)
18 (Good)
11 (Good)
24 (Good)
38 (Good)
39 (Good)
30 (Good)
22 (Good)
15 (Good)
11 (Good)
18 (Good)
28 (Good)
26 (Good)
32 (Good)
25 (Good)
42 (Moderate)
39 (Good)
35 (Good)
36 (Good)
o3
128 (Unhealthy for Sensitive Groups)
141 (Unhealthy for Sensitive Groups)
108 (Moderate)
92 (Moderate)
74 (Moderate)
66 (Good)
85 (Moderate)
107 (Moderate)
115 (Moderate)
109 (Moderate)
139 (Unhealthy for Sensitive Groups)
172 (Unhealthy)
148 (Unhealthy for Sensitive Groups)
122 (Unhealthy for Sensitive Groups)
112 (Moderate)
85 (Moderate)
61 (Good)
60 (Good)
94 (Moderate)
109 (Moderate)
pm10
47 (Moderate)
66 (Unhealthy for Sensitive Groups)
65 (Unhealthy for Sensitive Groups)
53 (Unhealthy for Sensitive Groups)
85 (Unhealthy)
85 (Unhealthy)
90 (Unhealthy)
89 (Unhealthy)
46 (Moderate)
31 (Moderate)
40 (Moderate)
49 (Moderate)
66 (Unhealthy for Sensitive Groups)
70 (Unhealthy for Sensitive Groups)
92 (Unhealthy)
101 (Unhealthy)
119 (Very Unhealthy)
97 (Unhealthy)
99 (Unhealthy)
80 (Unhealthy for Sensitive Groups)
so2
8.8 (Good)
10 (Good)
8.5 (Good)
5.8 (Good)
7.5 (Good)
7.2 (Good)
6.2 (Good)
8.9 (Good)
10 (Good)
5.5 (Good)
6 (Good)
6.8 (Good)
9.1 (Good)
8.3 (Good)
9.1 (Good)
5 (Good)
8.2 (Good)
7.1 (Good)
5.3 (Good)
6.4 (Good)
data source »
钵池山
Friday, May 27, 2022, 12:00 PM
PM10 179 (Very bad Hazardous)
particulate matter (PM10) suspended dust
PM2,5 35 (Unhealthy for Sensitive Groups)
particulate matter (PM2.5) dust
O3 0.04 (Good)
ozone (O3)
NO2 0 (Good)
nitrogen dioxide (NO2)
SO2 0 (Good)
sulfur dioxide (SO2)
钵池山
index
2022-05-27
pm10
56
pm25
56
o3
0.03
no2
0
so2
0
钵池山
2018-10 2020-05

index
2020-05
2020-04
2020-03
2020-02
2020-01
2019-12
2019-11
2019-10
2019-09
2019-08
2019-07
2019-06
2019-05
2019-04
2019-03
2019-02
2019-01
2018-12
2018-11
2018-10
pm25
33
44
43
48
82
68
57
56
30
18
24
26
33
33
58
80
86
57
54
40
co
536
667
654
660
864
827
627
779
646
469
573
871
801
721
741
1
991
809
817
631
no2
15
19
18
11
24
38
39
30
22
15
11
18
28
26
32
25
42
39
35
36
o3
128
141
108
92
74
66
85
107
115
109
139
172
148
122
112
85
61
60
94
109
pm10
47
66
65
53
85
85
90
89
46
31
40
49
66
70
92
101
119
97
99
80
so2
8.8
10
8.5
5.8
7.5
7.2
6.2
8.9
10
5.5
6
6.8
9.1
8.3
9.1
5
8.2
7.1
5.3
6.4
* Pollution data source:
https://openaq.org
(ChinaAQIData)
The data is licensed under CC-By 4.0
PM10 179 (Very bad Hazardous)
PM2,5 35 (Unhealthy for Sensitive Groups)
O3 0 (Good)
NO2 0 (Good)
SO2 0 (Good)
Data on air pollution from recent days in Xinjian
| index | 2022-05-27 |
|---|---|
| pm10 | 56 Unhealthy for Sensitive Groups |
| pm25 | 56 Unhealthy |
| o3 | 0 Good |
| no2 | 0 Good |
| so2 | 0 Good |
| index | 2020-05 | 2020-04 | 2020-03 | 2020-02 | 2020-01 | 2019-12 | 2019-11 | 2019-10 | 2019-09 | 2019-08 | 2019-07 | 2019-06 | 2019-05 | 2019-04 | 2019-03 | 2019-02 | 2019-01 | 2018-12 | 2018-11 | 2018-10 |
|---|---|---|---|---|---|---|---|---|---|---|---|---|---|---|---|---|---|---|---|---|
| pm25 | 33 (Moderate) | 44 (Unhealthy for Sensitive Groups) | 43 (Unhealthy for Sensitive Groups) | 48 (Unhealthy for Sensitive Groups) | 82 (Very Unhealthy) | 68 (Unhealthy) | 57 (Unhealthy) | 56 (Unhealthy) | 30 (Moderate) | 18 (Moderate) | 24 (Moderate) | 26 (Moderate) | 33 (Moderate) | 33 (Moderate) | 58 (Unhealthy) | 80 (Very Unhealthy) | 86 (Very Unhealthy) | 57 (Unhealthy) | 54 (Unhealthy for Sensitive Groups) | 40 (Unhealthy for Sensitive Groups) |
| co | 536 (Good) | 667 (Good) | 654 (Good) | 660 (Good) | 864 (Good) | 827 (Good) | 627 (Good) | 779 (Good) | 646 (Good) | 469 (Good) | 573 (Good) | 871 (Good) | 801 (Good) | 721 (Good) | 741 (Good) | 1 (Good) | 991 (Good) | 809 (Good) | 817 (Good) | 631 (Good) |
| no2 | 15 (Good) | 19 (Good) | 18 (Good) | 11 (Good) | 24 (Good) | 38 (Good) | 39 (Good) | 30 (Good) | 22 (Good) | 15 (Good) | 11 (Good) | 18 (Good) | 28 (Good) | 26 (Good) | 32 (Good) | 25 (Good) | 42 (Moderate) | 39 (Good) | 35 (Good) | 36 (Good) |
| o3 | 128 (Unhealthy for Sensitive Groups) | 141 (Unhealthy for Sensitive Groups) | 108 (Moderate) | 92 (Moderate) | 74 (Moderate) | 66 (Good) | 85 (Moderate) | 107 (Moderate) | 115 (Moderate) | 109 (Moderate) | 139 (Unhealthy for Sensitive Groups) | 172 (Unhealthy) | 148 (Unhealthy for Sensitive Groups) | 122 (Unhealthy for Sensitive Groups) | 112 (Moderate) | 85 (Moderate) | 61 (Good) | 60 (Good) | 94 (Moderate) | 109 (Moderate) |
| pm10 | 47 (Moderate) | 66 (Unhealthy for Sensitive Groups) | 65 (Unhealthy for Sensitive Groups) | 53 (Unhealthy for Sensitive Groups) | 85 (Unhealthy) | 85 (Unhealthy) | 90 (Unhealthy) | 89 (Unhealthy) | 46 (Moderate) | 31 (Moderate) | 40 (Moderate) | 49 (Moderate) | 66 (Unhealthy for Sensitive Groups) | 70 (Unhealthy for Sensitive Groups) | 92 (Unhealthy) | 101 (Unhealthy) | 119 (Very Unhealthy) | 97 (Unhealthy) | 99 (Unhealthy) | 80 (Unhealthy for Sensitive Groups) |
| so2 | 8.8 (Good) | 10 (Good) | 8.5 (Good) | 5.8 (Good) | 7.5 (Good) | 7.2 (Good) | 6.2 (Good) | 8.9 (Good) | 10 (Good) | 5.5 (Good) | 6 (Good) | 6.8 (Good) | 9.1 (Good) | 8.3 (Good) | 9.1 (Good) | 5 (Good) | 8.2 (Good) | 7.1 (Good) | 5.3 (Good) | 6.4 (Good) |
PM10 179 (Very bad Hazardous)
particulate matter (PM10) suspended dustPM2,5 35 (Unhealthy for Sensitive Groups)
particulate matter (PM2.5) dustO3 0.04 (Good)
ozone (O3)NO2 0 (Good)
nitrogen dioxide (NO2)SO2 0 (Good)
sulfur dioxide (SO2)钵池山
| index | 2022-05-27 |
|---|---|
| pm10 | 56 |
| pm25 | 56 |
| o3 | 0.03 |
| no2 | 0 |
| so2 | 0 |
钵池山

| index | 2020-05 | 2020-04 | 2020-03 | 2020-02 | 2020-01 | 2019-12 | 2019-11 | 2019-10 | 2019-09 | 2019-08 | 2019-07 | 2019-06 | 2019-05 | 2019-04 | 2019-03 | 2019-02 | 2019-01 | 2018-12 | 2018-11 | 2018-10 |
|---|---|---|---|---|---|---|---|---|---|---|---|---|---|---|---|---|---|---|---|---|
| pm25 | 33 | 44 | 43 | 48 | 82 | 68 | 57 | 56 | 30 | 18 | 24 | 26 | 33 | 33 | 58 | 80 | 86 | 57 | 54 | 40 |
| co | 536 | 667 | 654 | 660 | 864 | 827 | 627 | 779 | 646 | 469 | 573 | 871 | 801 | 721 | 741 | 1 | 991 | 809 | 817 | 631 |
| no2 | 15 | 19 | 18 | 11 | 24 | 38 | 39 | 30 | 22 | 15 | 11 | 18 | 28 | 26 | 32 | 25 | 42 | 39 | 35 | 36 |
| o3 | 128 | 141 | 108 | 92 | 74 | 66 | 85 | 107 | 115 | 109 | 139 | 172 | 148 | 122 | 112 | 85 | 61 | 60 | 94 | 109 |
| pm10 | 47 | 66 | 65 | 53 | 85 | 85 | 90 | 89 | 46 | 31 | 40 | 49 | 66 | 70 | 92 | 101 | 119 | 97 | 99 | 80 |
| so2 | 8.8 | 10 | 8.5 | 5.8 | 7.5 | 7.2 | 6.2 | 8.9 | 10 | 5.5 | 6 | 6.8 | 9.1 | 8.3 | 9.1 | 5 | 8.2 | 7.1 | 5.3 | 6.4 |