Air Pollution in Chengnan: Real-time Air Quality Index and smog alert.
Pollution and air quality forecast for Chengnan. Today is Tuesday, June 2, 2026. The following air pollution values have been recorded for Chengnan:- particulate matter (PM10) suspended dust - 179 (Very bad Hazardous)
- particulate matter (PM2.5) dust - 35 (Unhealthy for Sensitive Groups)
- ozone (O3) - 0 (Good)
- nitrogen dioxide (NO2) - 0 (Good)
- sulfur dioxide (SO2) - 0 (Good)

What is the air quality in Chengnan today? Is the air polluted in Chengnan?. Is there smog?
What is the level of PM10 today in Chengnan? (particulate matter (PM10) suspended dust)
The current level of particulate matter PM10 in Chengnan is:
179 (Very bad Hazardous)
The highest PM10 values usually occur in month: 121 (January 2019).
The lowest value of particulate matter PM10 pollution in Chengnan is usually recorded in: August (39).
What is the current level of PM2.5 in Chengnan? (particulate matter (PM2.5) dust)
Today's PM2.5 level is:
35 (Unhealthy for Sensitive Groups)
For comparison, the highest level of PM2.5 in Chengnan in the last 7 days was: 56 (Friday, May 27, 2022) and the lowest: 56 (Friday, May 27, 2022).
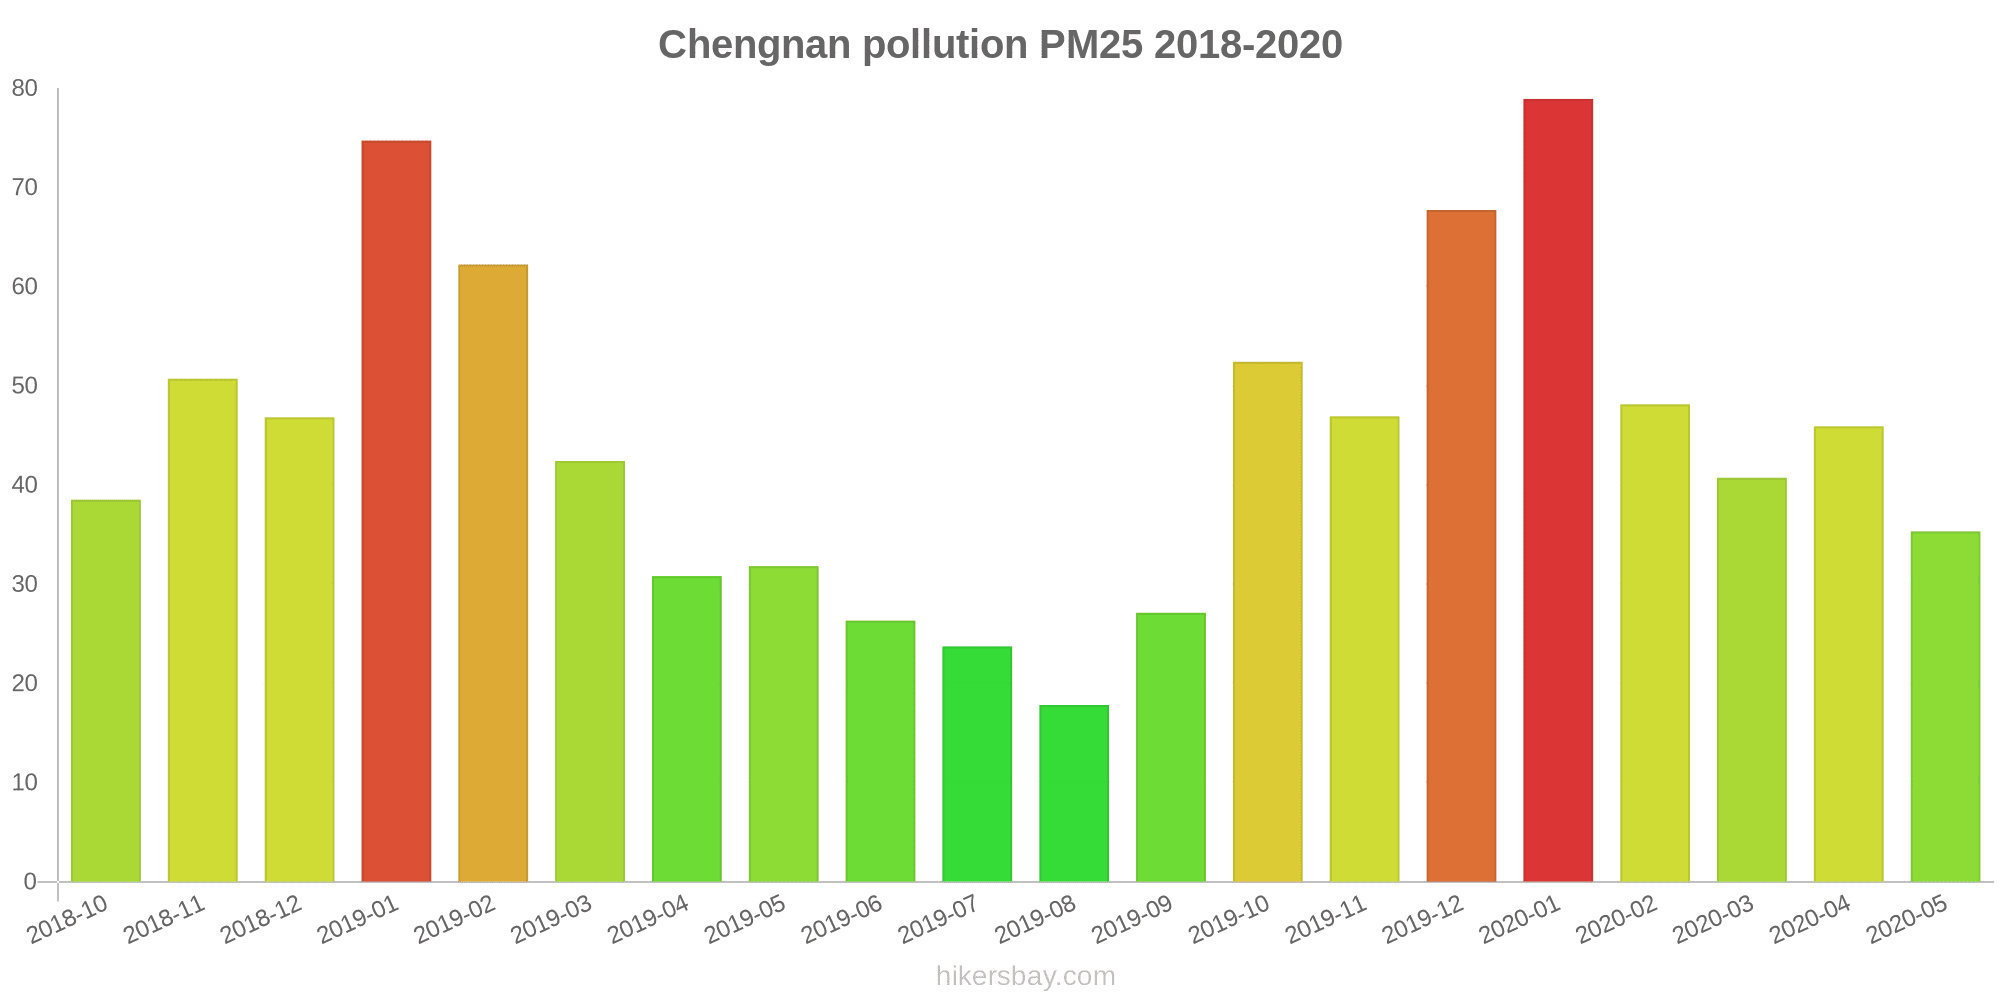
The highest PM2.5 values were recorded: 79 (January 2020).
The lowest level of particulate matter PM2.5 pollution occurs in month: August (18).
How is the O3 level today in Chengnan? (ozone (O3))
0 (Good)
How high is the level of NO2? (nitrogen dioxide (NO2))
0 (Good)
What is the level of SO2 pollution? (sulfur dioxide (SO2))
0 (Good)
Current data Friday, May 27, 2022, 12:00 PM
PM10 179 (Very bad Hazardous)
PM2,5 35 (Unhealthy for Sensitive Groups)
O3 0 (Good)
NO2 0 (Good)
SO2 0 (Good)
Data on air pollution from recent days in Chengnan
index
2022-05-27
pm10
56
Unhealthy for Sensitive Groups
pm25
56
Unhealthy
o3
0
Good
no2
0
Good
so2
0
Good
data source »
Air pollution in Chengnan from October 2018 to May 2020

index
2020-05
2020-04
2020-03
2020-02
2020-01
2019-12
2019-11
2019-10
2019-09
2019-08
2019-07
2019-06
2019-05
2019-04
2019-03
2019-02
2019-01
2018-12
2018-11
2018-10
pm25
35 (Unhealthy for Sensitive Groups)
46 (Unhealthy for Sensitive Groups)
41 (Unhealthy for Sensitive Groups)
48 (Unhealthy for Sensitive Groups)
79 (Very Unhealthy)
68 (Unhealthy)
47 (Unhealthy for Sensitive Groups)
52 (Unhealthy for Sensitive Groups)
27 (Moderate)
18 (Moderate)
24 (Moderate)
26 (Moderate)
32 (Moderate)
31 (Moderate)
42 (Unhealthy for Sensitive Groups)
62 (Unhealthy)
75 (Unhealthy)
47 (Unhealthy for Sensitive Groups)
51 (Unhealthy for Sensitive Groups)
39 (Unhealthy for Sensitive Groups)
co
593 (Good)
540 (Good)
436 (Good)
692 (Good)
880 (Good)
915 (Good)
684 (Good)
679 (Good)
496 (Good)
482 (Good)
478 (Good)
736 (Good)
691 (Good)
657 (Good)
693 (Good)
1 (Good)
965 (Good)
857 (Good)
764 (Good)
465 (Good)
no2
14 (Good)
23 (Good)
21 (Good)
17 (Good)
23 (Good)
40 (Moderate)
36 (Good)
31 (Good)
20 (Good)
17 (Good)
19 (Good)
17 (Good)
26 (Good)
28 (Good)
36 (Good)
27 (Good)
40 (Good)
33 (Good)
31 (Good)
28 (Good)
o3
123 (Unhealthy for Sensitive Groups)
134 (Unhealthy for Sensitive Groups)
105 (Moderate)
82 (Moderate)
75 (Moderate)
68 (Good)
91 (Moderate)
120 (Unhealthy for Sensitive Groups)
131 (Unhealthy for Sensitive Groups)
125 (Unhealthy for Sensitive Groups)
153 (Unhealthy)
175 (Unhealthy)
157 (Unhealthy)
130 (Unhealthy for Sensitive Groups)
115 (Moderate)
82 (Moderate)
66 (Good)
57 (Good)
90 (Moderate)
110 (Moderate)
pm10
54 (Unhealthy for Sensitive Groups)
78 (Unhealthy for Sensitive Groups)
65 (Unhealthy for Sensitive Groups)
56 (Unhealthy for Sensitive Groups)
94 (Unhealthy)
94 (Unhealthy)
98 (Unhealthy)
103 (Unhealthy)
53 (Unhealthy for Sensitive Groups)
39 (Moderate)
53 (Unhealthy for Sensitive Groups)
58 (Unhealthy for Sensitive Groups)
83 (Unhealthy)
72 (Unhealthy for Sensitive Groups)
96 (Unhealthy)
104 (Unhealthy)
121 (Very Unhealthy)
105 (Unhealthy)
102 (Unhealthy)
86 (Unhealthy)
so2
7.8 (Good)
9.9 (Good)
8.3 (Good)
7.4 (Good)
8.3 (Good)
8.5 (Good)
8.7 (Good)
8.4 (Good)
6.5 (Good)
6 (Good)
6.1 (Good)
6.7 (Good)
8.1 (Good)
7.3 (Good)
8.8 (Good)
6.7 (Good)
8.5 (Good)
8.5 (Good)
7.8 (Good)
11 (Good)
data source »
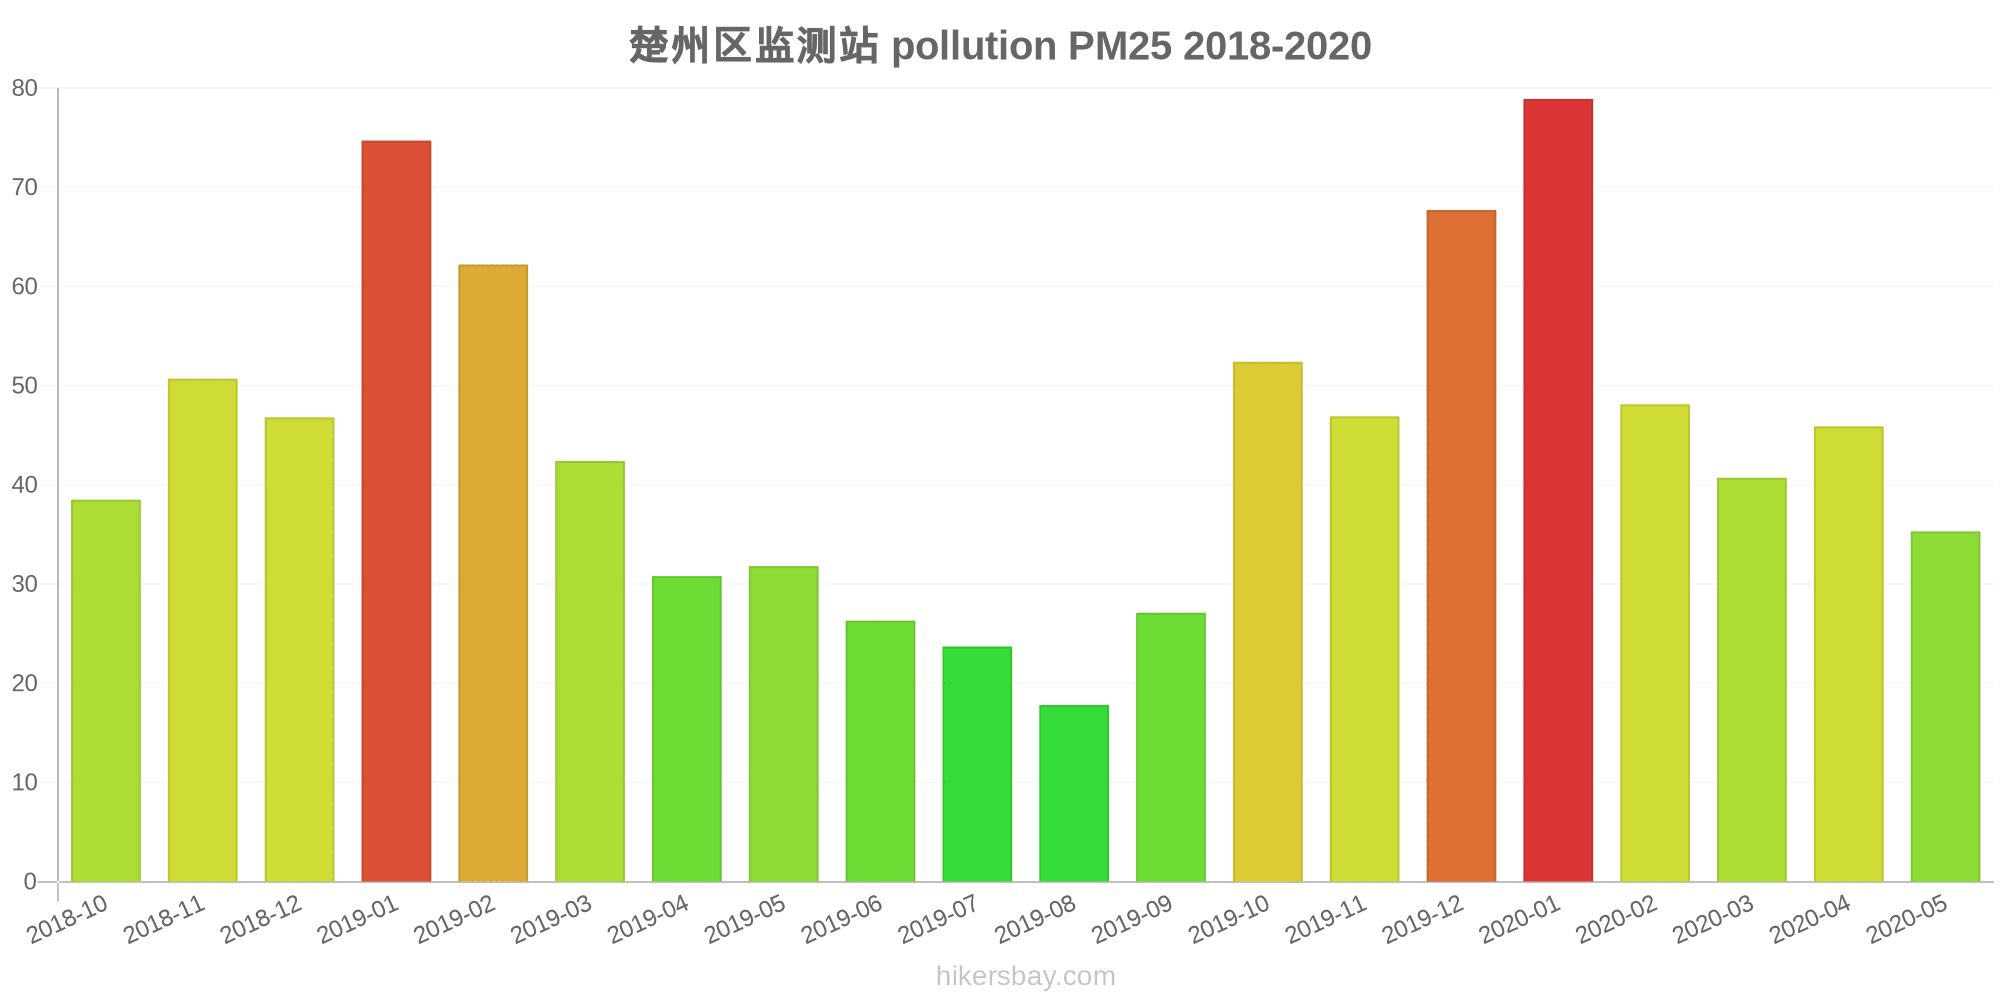
楚州区监测站
Friday, May 27, 2022, 12:00 PM
PM10 179 (Very bad Hazardous)
particulate matter (PM10) suspended dust
PM2,5 35 (Unhealthy for Sensitive Groups)
particulate matter (PM2.5) dust
O3 0.04 (Good)
ozone (O3)
NO2 0 (Good)
nitrogen dioxide (NO2)
SO2 0 (Good)
sulfur dioxide (SO2)
楚州区监测站
index
2022-05-27
pm10
56
pm25
56
o3
0.03
no2
0
so2
0
楚州区监测站
2018-10 2020-05

index
2020-05
2020-04
2020-03
2020-02
2020-01
2019-12
2019-11
2019-10
2019-09
2019-08
2019-07
2019-06
2019-05
2019-04
2019-03
2019-02
2019-01
2018-12
2018-11
2018-10
pm25
35
46
41
48
79
68
47
52
27
18
24
26
32
31
42
62
75
47
51
39
co
593
540
436
692
880
915
684
679
496
482
478
736
691
657
693
1
965
857
764
465
no2
14
23
21
17
23
40
36
31
20
17
19
17
26
28
36
27
40
33
31
28
o3
123
134
105
82
75
68
91
120
131
125
153
175
157
130
115
82
66
57
90
110
pm10
54
78
65
56
94
94
98
103
53
39
53
58
83
72
96
104
121
105
102
86
so2
7.8
9.9
8.3
7.4
8.3
8.5
8.7
8.4
6.5
6
6.1
6.7
8.1
7.3
8.8
6.7
8.5
8.5
7.8
11
* Pollution data source:
https://openaq.org
(ChinaAQIData)
The data is licensed under CC-By 4.0
PM10 179 (Very bad Hazardous)
PM2,5 35 (Unhealthy for Sensitive Groups)
O3 0 (Good)
NO2 0 (Good)
SO2 0 (Good)
Data on air pollution from recent days in Chengnan
| index | 2022-05-27 |
|---|---|
| pm10 | 56 Unhealthy for Sensitive Groups |
| pm25 | 56 Unhealthy |
| o3 | 0 Good |
| no2 | 0 Good |
| so2 | 0 Good |
| index | 2020-05 | 2020-04 | 2020-03 | 2020-02 | 2020-01 | 2019-12 | 2019-11 | 2019-10 | 2019-09 | 2019-08 | 2019-07 | 2019-06 | 2019-05 | 2019-04 | 2019-03 | 2019-02 | 2019-01 | 2018-12 | 2018-11 | 2018-10 |
|---|---|---|---|---|---|---|---|---|---|---|---|---|---|---|---|---|---|---|---|---|
| pm25 | 35 (Unhealthy for Sensitive Groups) | 46 (Unhealthy for Sensitive Groups) | 41 (Unhealthy for Sensitive Groups) | 48 (Unhealthy for Sensitive Groups) | 79 (Very Unhealthy) | 68 (Unhealthy) | 47 (Unhealthy for Sensitive Groups) | 52 (Unhealthy for Sensitive Groups) | 27 (Moderate) | 18 (Moderate) | 24 (Moderate) | 26 (Moderate) | 32 (Moderate) | 31 (Moderate) | 42 (Unhealthy for Sensitive Groups) | 62 (Unhealthy) | 75 (Unhealthy) | 47 (Unhealthy for Sensitive Groups) | 51 (Unhealthy for Sensitive Groups) | 39 (Unhealthy for Sensitive Groups) |
| co | 593 (Good) | 540 (Good) | 436 (Good) | 692 (Good) | 880 (Good) | 915 (Good) | 684 (Good) | 679 (Good) | 496 (Good) | 482 (Good) | 478 (Good) | 736 (Good) | 691 (Good) | 657 (Good) | 693 (Good) | 1 (Good) | 965 (Good) | 857 (Good) | 764 (Good) | 465 (Good) |
| no2 | 14 (Good) | 23 (Good) | 21 (Good) | 17 (Good) | 23 (Good) | 40 (Moderate) | 36 (Good) | 31 (Good) | 20 (Good) | 17 (Good) | 19 (Good) | 17 (Good) | 26 (Good) | 28 (Good) | 36 (Good) | 27 (Good) | 40 (Good) | 33 (Good) | 31 (Good) | 28 (Good) |
| o3 | 123 (Unhealthy for Sensitive Groups) | 134 (Unhealthy for Sensitive Groups) | 105 (Moderate) | 82 (Moderate) | 75 (Moderate) | 68 (Good) | 91 (Moderate) | 120 (Unhealthy for Sensitive Groups) | 131 (Unhealthy for Sensitive Groups) | 125 (Unhealthy for Sensitive Groups) | 153 (Unhealthy) | 175 (Unhealthy) | 157 (Unhealthy) | 130 (Unhealthy for Sensitive Groups) | 115 (Moderate) | 82 (Moderate) | 66 (Good) | 57 (Good) | 90 (Moderate) | 110 (Moderate) |
| pm10 | 54 (Unhealthy for Sensitive Groups) | 78 (Unhealthy for Sensitive Groups) | 65 (Unhealthy for Sensitive Groups) | 56 (Unhealthy for Sensitive Groups) | 94 (Unhealthy) | 94 (Unhealthy) | 98 (Unhealthy) | 103 (Unhealthy) | 53 (Unhealthy for Sensitive Groups) | 39 (Moderate) | 53 (Unhealthy for Sensitive Groups) | 58 (Unhealthy for Sensitive Groups) | 83 (Unhealthy) | 72 (Unhealthy for Sensitive Groups) | 96 (Unhealthy) | 104 (Unhealthy) | 121 (Very Unhealthy) | 105 (Unhealthy) | 102 (Unhealthy) | 86 (Unhealthy) |
| so2 | 7.8 (Good) | 9.9 (Good) | 8.3 (Good) | 7.4 (Good) | 8.3 (Good) | 8.5 (Good) | 8.7 (Good) | 8.4 (Good) | 6.5 (Good) | 6 (Good) | 6.1 (Good) | 6.7 (Good) | 8.1 (Good) | 7.3 (Good) | 8.8 (Good) | 6.7 (Good) | 8.5 (Good) | 8.5 (Good) | 7.8 (Good) | 11 (Good) |
PM10 179 (Very bad Hazardous)
particulate matter (PM10) suspended dustPM2,5 35 (Unhealthy for Sensitive Groups)
particulate matter (PM2.5) dustO3 0.04 (Good)
ozone (O3)NO2 0 (Good)
nitrogen dioxide (NO2)SO2 0 (Good)
sulfur dioxide (SO2)楚州区监测站
| index | 2022-05-27 |
|---|---|
| pm10 | 56 |
| pm25 | 56 |
| o3 | 0.03 |
| no2 | 0 |
| so2 | 0 |
楚州区监测站
| index | 2020-05 | 2020-04 | 2020-03 | 2020-02 | 2020-01 | 2019-12 | 2019-11 | 2019-10 | 2019-09 | 2019-08 | 2019-07 | 2019-06 | 2019-05 | 2019-04 | 2019-03 | 2019-02 | 2019-01 | 2018-12 | 2018-11 | 2018-10 |
|---|---|---|---|---|---|---|---|---|---|---|---|---|---|---|---|---|---|---|---|---|
| pm25 | 35 | 46 | 41 | 48 | 79 | 68 | 47 | 52 | 27 | 18 | 24 | 26 | 32 | 31 | 42 | 62 | 75 | 47 | 51 | 39 |
| co | 593 | 540 | 436 | 692 | 880 | 915 | 684 | 679 | 496 | 482 | 478 | 736 | 691 | 657 | 693 | 1 | 965 | 857 | 764 | 465 |
| no2 | 14 | 23 | 21 | 17 | 23 | 40 | 36 | 31 | 20 | 17 | 19 | 17 | 26 | 28 | 36 | 27 | 40 | 33 | 31 | 28 |
| o3 | 123 | 134 | 105 | 82 | 75 | 68 | 91 | 120 | 131 | 125 | 153 | 175 | 157 | 130 | 115 | 82 | 66 | 57 | 90 | 110 |
| pm10 | 54 | 78 | 65 | 56 | 94 | 94 | 98 | 103 | 53 | 39 | 53 | 58 | 83 | 72 | 96 | 104 | 121 | 105 | 102 | 86 |
| so2 | 7.8 | 9.9 | 8.3 | 7.4 | 8.3 | 8.5 | 8.7 | 8.4 | 6.5 | 6 | 6.1 | 6.7 | 8.1 | 7.3 | 8.8 | 6.7 | 8.5 | 8.5 | 7.8 | 11 |