Air Pollution in Sijiqing: Real-time Air Quality Index and smog alert.
Pollution and air quality forecast for Sijiqing. Today is Tuesday, June 2, 2026. The following air pollution values have been recorded for Sijiqing:- particulate matter (PM10) suspended dust - 179 (Very bad Hazardous)
- particulate matter (PM2.5) dust - 35 (Unhealthy for Sensitive Groups)
- ozone (O3) - 0 (Good)
- nitrogen dioxide (NO2) - 0 (Good)
- sulfur dioxide (SO2) - 0 (Good)

What is the air quality in Sijiqing today? Is the air polluted in Sijiqing?. Is there smog?
What is the level of PM10 today in Sijiqing? (particulate matter (PM10) suspended dust)
The current level of particulate matter PM10 in Sijiqing is:
179 (Very bad Hazardous)
The highest PM10 values usually occur in month: 135 (January 2019).
The lowest value of particulate matter PM10 pollution in Sijiqing is usually recorded in: August (38).
What is the current level of PM2.5 in Sijiqing? (particulate matter (PM2.5) dust)
Today's PM2.5 level is:
35 (Unhealthy for Sensitive Groups)
For comparison, the highest level of PM2.5 in Sijiqing in the last 7 days was: 56 (Friday, May 27, 2022) and the lowest: 56 (Friday, May 27, 2022).
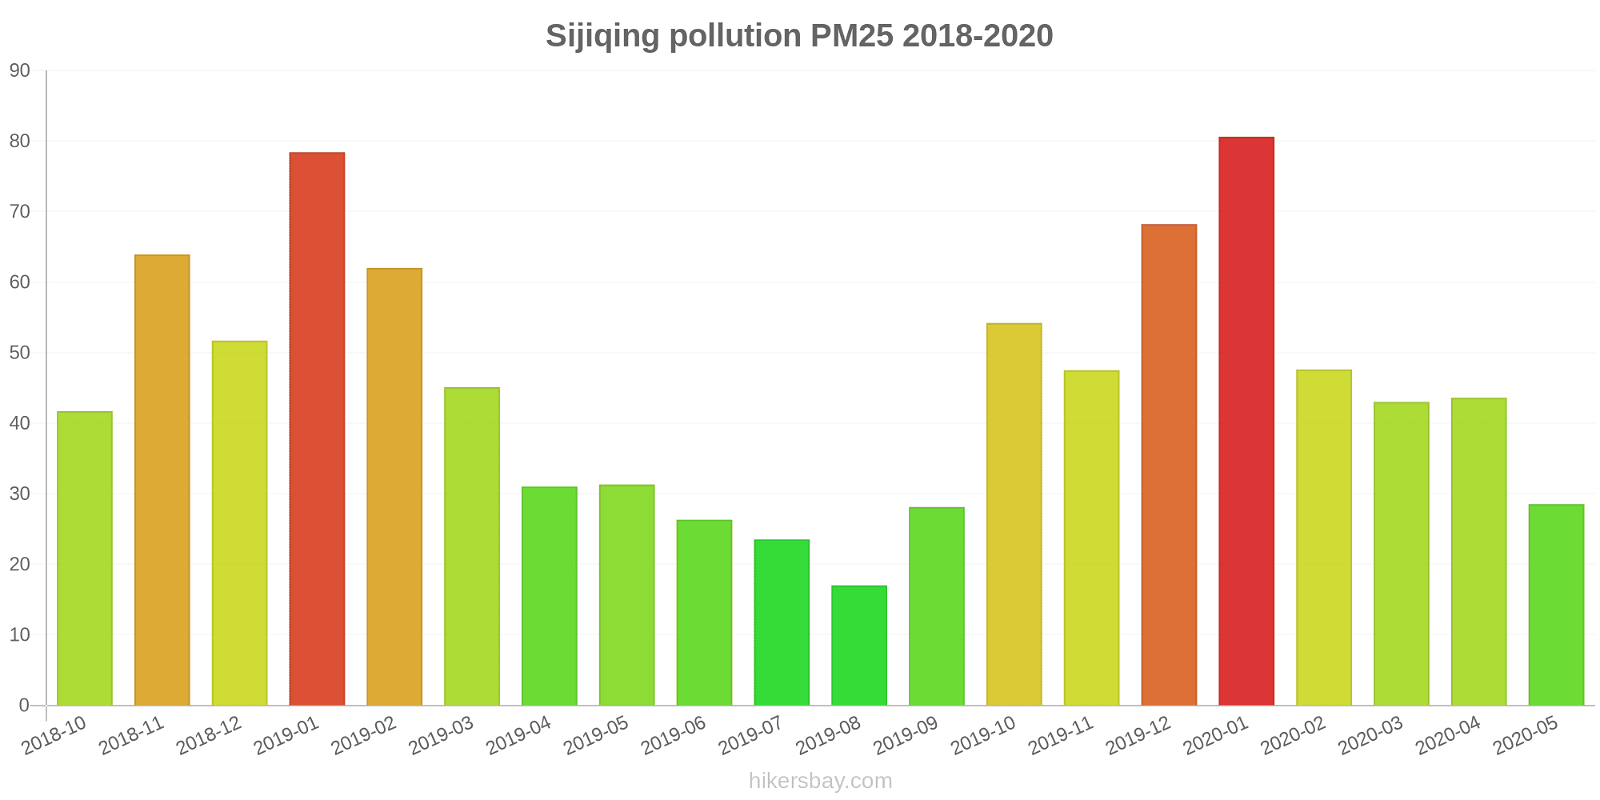
The highest PM2.5 values were recorded: 81 (January 2020).
The lowest level of particulate matter PM2.5 pollution occurs in month: August (17).
How is the O3 level today in Sijiqing? (ozone (O3))
0 (Good)
How high is the level of NO2? (nitrogen dioxide (NO2))
0 (Good)
What is the level of SO2 pollution? (sulfur dioxide (SO2))
0 (Good)
Current data Friday, May 27, 2022, 12:00 PM
PM10 179 (Very bad Hazardous)
PM2,5 35 (Unhealthy for Sensitive Groups)
O3 0 (Good)
NO2 0 (Good)
SO2 0 (Good)
Data on air pollution from recent days in Sijiqing
index
2022-05-27
pm10
56
Unhealthy for Sensitive Groups
pm25
56
Unhealthy
o3
0
Good
no2
0
Good
so2
0
Good
data source »
Air pollution in Sijiqing from October 2018 to May 2020
index
2020-05
2020-04
2020-03
2020-02
2020-01
2019-12
2019-11
2019-10
2019-09
2019-08
2019-07
2019-06
2019-05
2019-04
2019-03
2019-02
2019-01
2018-12
2018-11
2018-10
pm25
29 (Moderate)
44 (Unhealthy for Sensitive Groups)
43 (Unhealthy for Sensitive Groups)
48 (Unhealthy for Sensitive Groups)
81 (Very Unhealthy)
68 (Unhealthy)
48 (Unhealthy for Sensitive Groups)
54 (Unhealthy for Sensitive Groups)
28 (Moderate)
17 (Moderate)
24 (Moderate)
26 (Moderate)
31 (Moderate)
31 (Moderate)
45 (Unhealthy for Sensitive Groups)
62 (Unhealthy)
78 (Very Unhealthy)
52 (Unhealthy for Sensitive Groups)
64 (Unhealthy)
42 (Unhealthy for Sensitive Groups)
co
813 (Good)
532 (Good)
659 (Good)
602 (Good)
977 (Good)
934 (Good)
738 (Good)
768 (Good)
683 (Good)
762 (Good)
645 (Good)
706 (Good)
715 (Good)
605 (Good)
828 (Good)
1 (Good)
1 (Good)
966 (Good)
1 (Good)
639 (Good)
no2
21 (Good)
28 (Good)
26 (Good)
17 (Good)
28 (Good)
47 (Moderate)
43 (Moderate)
37 (Good)
24 (Good)
19 (Good)
21 (Good)
19 (Good)
34 (Good)
31 (Good)
38 (Good)
29 (Good)
46 (Moderate)
40 (Moderate)
39 (Good)
37 (Good)
o3
137 (Unhealthy for Sensitive Groups)
142 (Unhealthy for Sensitive Groups)
106 (Moderate)
90 (Moderate)
64 (Good)
68 (Good)
82 (Moderate)
114 (Moderate)
139 (Unhealthy for Sensitive Groups)
126 (Unhealthy for Sensitive Groups)
161 (Unhealthy)
195 (Very Unhealthy)
155 (Unhealthy)
124 (Unhealthy for Sensitive Groups)
117 (Moderate)
86 (Moderate)
64 (Good)
58 (Good)
89 (Moderate)
115 (Moderate)
pm10
52 (Unhealthy for Sensitive Groups)
74 (Unhealthy for Sensitive Groups)
72 (Unhealthy for Sensitive Groups)
58 (Unhealthy for Sensitive Groups)
90 (Unhealthy)
98 (Unhealthy)
100 (Unhealthy)
96 (Unhealthy)
54 (Unhealthy for Sensitive Groups)
38 (Moderate)
49 (Moderate)
59 (Unhealthy for Sensitive Groups)
85 (Unhealthy)
74 (Unhealthy for Sensitive Groups)
108 (Unhealthy)
117 (Very Unhealthy)
135 (Very Unhealthy)
107 (Unhealthy)
108 (Unhealthy)
92 (Unhealthy)
so2
7.3 (Good)
9.2 (Good)
7 (Good)
4.1 (Good)
3.9 (Good)
4.5 (Good)
5.3 (Good)
5.5 (Good)
4.9 (Good)
5 (Good)
4.8 (Good)
5.6 (Good)
7.6 (Good)
5.2 (Good)
7.6 (Good)
5 (Good)
8 (Good)
6.6 (Good)
5.5 (Good)
6.1 (Good)
data source »
北京南路
Friday, May 27, 2022, 12:00 PM
PM10 179 (Very bad Hazardous)
particulate matter (PM10) suspended dust
PM2,5 35 (Unhealthy for Sensitive Groups)
particulate matter (PM2.5) dust
O3 0.04 (Good)
ozone (O3)
NO2 0 (Good)
nitrogen dioxide (NO2)
SO2 0 (Good)
sulfur dioxide (SO2)
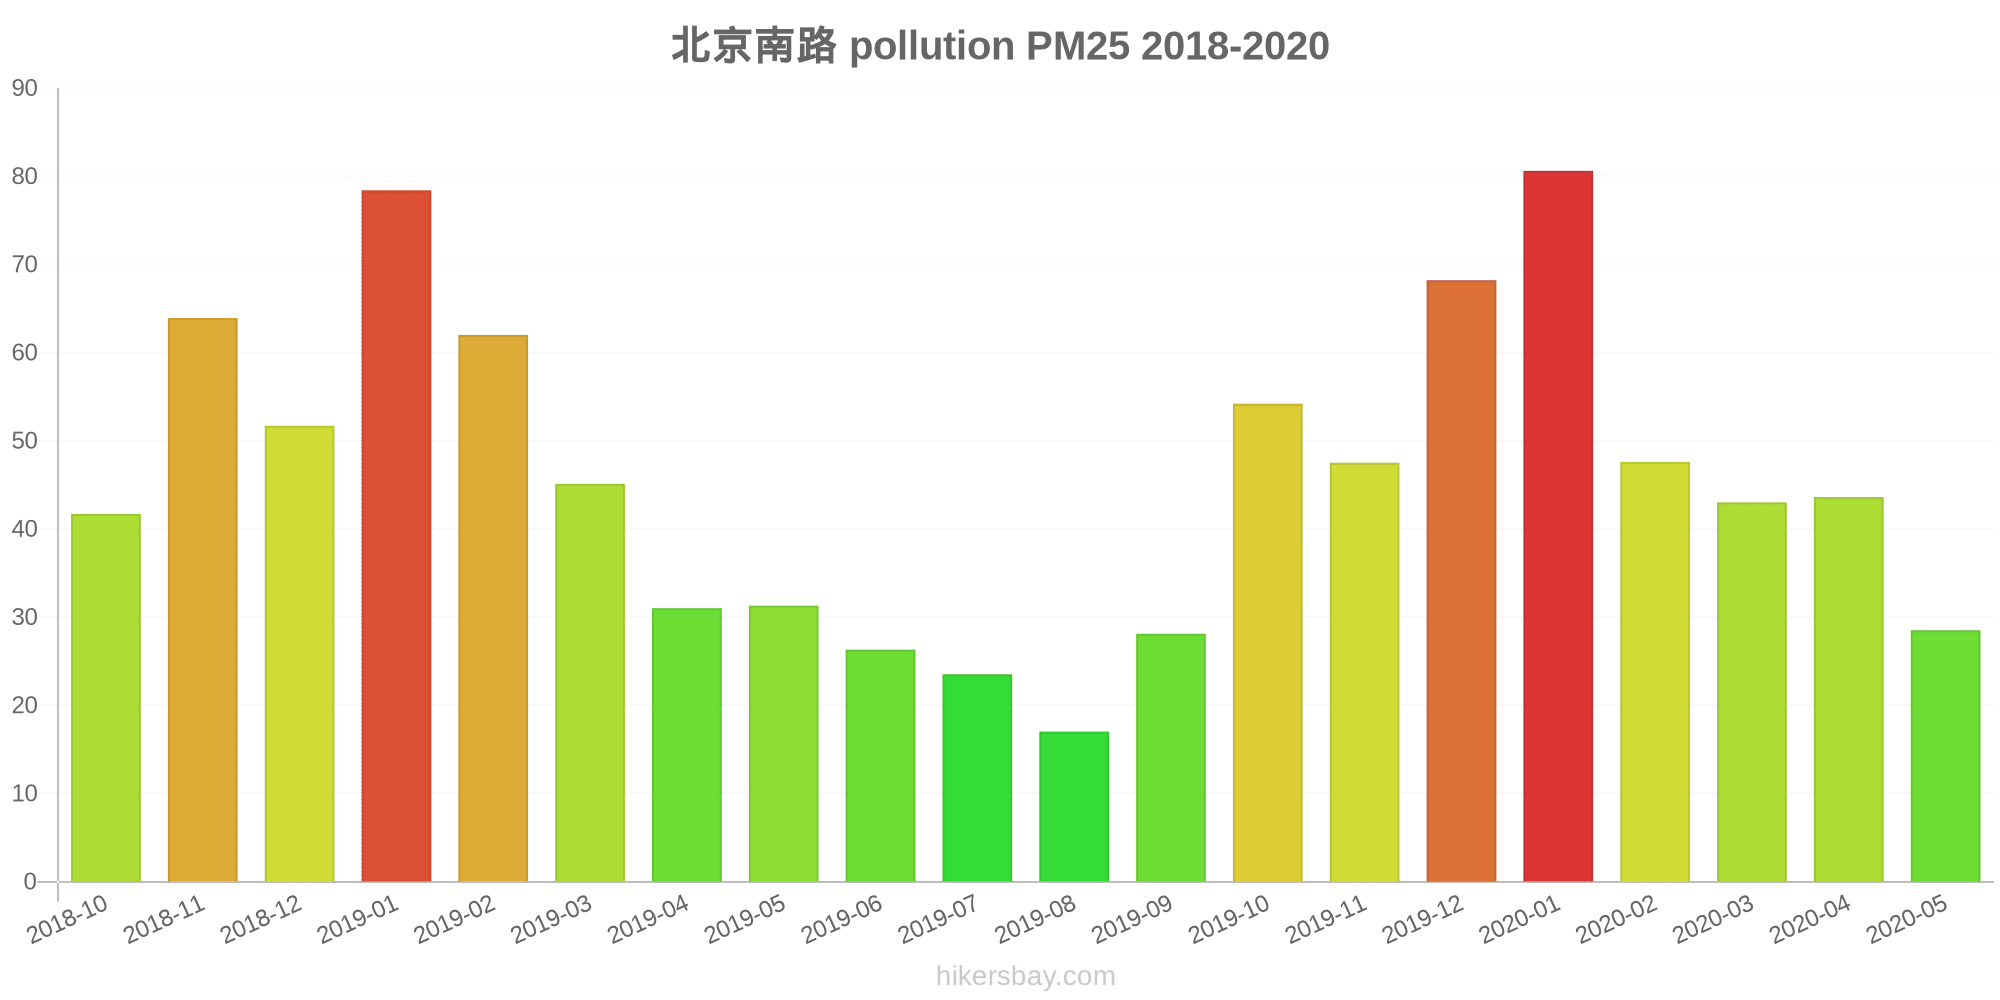
北京南路
index
2022-05-27
pm10
56
pm25
56
o3
0.03
no2
0
so2
0
北京南路
2018-10 2020-05

index
2020-05
2020-04
2020-03
2020-02
2020-01
2019-12
2019-11
2019-10
2019-09
2019-08
2019-07
2019-06
2019-05
2019-04
2019-03
2019-02
2019-01
2018-12
2018-11
2018-10
pm25
29
44
43
48
81
68
48
54
28
17
24
26
31
31
45
62
78
52
64
42
co
813
532
659
602
977
934
738
768
683
762
645
706
715
605
828
1
1
966
1
639
no2
21
28
26
17
28
47
43
37
24
19
21
19
34
31
38
29
46
40
39
37
o3
137
142
106
90
64
68
82
114
139
126
161
195
155
124
117
86
64
58
89
115
pm10
52
74
72
58
90
98
100
96
54
38
49
59
85
74
108
117
135
107
108
92
so2
7.3
9.2
7
4.1
3.9
4.5
5.3
5.5
4.9
5
4.8
5.6
7.6
5.2
7.6
5
8
6.6
5.5
6.1
* Pollution data source:
https://openaq.org
(ChinaAQIData)
The data is licensed under CC-By 4.0
PM10 179 (Very bad Hazardous)
PM2,5 35 (Unhealthy for Sensitive Groups)
O3 0 (Good)
NO2 0 (Good)
SO2 0 (Good)
Data on air pollution from recent days in Sijiqing
| index | 2022-05-27 |
|---|---|
| pm10 | 56 Unhealthy for Sensitive Groups |
| pm25 | 56 Unhealthy |
| o3 | 0 Good |
| no2 | 0 Good |
| so2 | 0 Good |

| index | 2020-05 | 2020-04 | 2020-03 | 2020-02 | 2020-01 | 2019-12 | 2019-11 | 2019-10 | 2019-09 | 2019-08 | 2019-07 | 2019-06 | 2019-05 | 2019-04 | 2019-03 | 2019-02 | 2019-01 | 2018-12 | 2018-11 | 2018-10 |
|---|---|---|---|---|---|---|---|---|---|---|---|---|---|---|---|---|---|---|---|---|
| pm25 | 29 (Moderate) | 44 (Unhealthy for Sensitive Groups) | 43 (Unhealthy for Sensitive Groups) | 48 (Unhealthy for Sensitive Groups) | 81 (Very Unhealthy) | 68 (Unhealthy) | 48 (Unhealthy for Sensitive Groups) | 54 (Unhealthy for Sensitive Groups) | 28 (Moderate) | 17 (Moderate) | 24 (Moderate) | 26 (Moderate) | 31 (Moderate) | 31 (Moderate) | 45 (Unhealthy for Sensitive Groups) | 62 (Unhealthy) | 78 (Very Unhealthy) | 52 (Unhealthy for Sensitive Groups) | 64 (Unhealthy) | 42 (Unhealthy for Sensitive Groups) |
| co | 813 (Good) | 532 (Good) | 659 (Good) | 602 (Good) | 977 (Good) | 934 (Good) | 738 (Good) | 768 (Good) | 683 (Good) | 762 (Good) | 645 (Good) | 706 (Good) | 715 (Good) | 605 (Good) | 828 (Good) | 1 (Good) | 1 (Good) | 966 (Good) | 1 (Good) | 639 (Good) |
| no2 | 21 (Good) | 28 (Good) | 26 (Good) | 17 (Good) | 28 (Good) | 47 (Moderate) | 43 (Moderate) | 37 (Good) | 24 (Good) | 19 (Good) | 21 (Good) | 19 (Good) | 34 (Good) | 31 (Good) | 38 (Good) | 29 (Good) | 46 (Moderate) | 40 (Moderate) | 39 (Good) | 37 (Good) |
| o3 | 137 (Unhealthy for Sensitive Groups) | 142 (Unhealthy for Sensitive Groups) | 106 (Moderate) | 90 (Moderate) | 64 (Good) | 68 (Good) | 82 (Moderate) | 114 (Moderate) | 139 (Unhealthy for Sensitive Groups) | 126 (Unhealthy for Sensitive Groups) | 161 (Unhealthy) | 195 (Very Unhealthy) | 155 (Unhealthy) | 124 (Unhealthy for Sensitive Groups) | 117 (Moderate) | 86 (Moderate) | 64 (Good) | 58 (Good) | 89 (Moderate) | 115 (Moderate) |
| pm10 | 52 (Unhealthy for Sensitive Groups) | 74 (Unhealthy for Sensitive Groups) | 72 (Unhealthy for Sensitive Groups) | 58 (Unhealthy for Sensitive Groups) | 90 (Unhealthy) | 98 (Unhealthy) | 100 (Unhealthy) | 96 (Unhealthy) | 54 (Unhealthy for Sensitive Groups) | 38 (Moderate) | 49 (Moderate) | 59 (Unhealthy for Sensitive Groups) | 85 (Unhealthy) | 74 (Unhealthy for Sensitive Groups) | 108 (Unhealthy) | 117 (Very Unhealthy) | 135 (Very Unhealthy) | 107 (Unhealthy) | 108 (Unhealthy) | 92 (Unhealthy) |
| so2 | 7.3 (Good) | 9.2 (Good) | 7 (Good) | 4.1 (Good) | 3.9 (Good) | 4.5 (Good) | 5.3 (Good) | 5.5 (Good) | 4.9 (Good) | 5 (Good) | 4.8 (Good) | 5.6 (Good) | 7.6 (Good) | 5.2 (Good) | 7.6 (Good) | 5 (Good) | 8 (Good) | 6.6 (Good) | 5.5 (Good) | 6.1 (Good) |
PM10 179 (Very bad Hazardous)
particulate matter (PM10) suspended dustPM2,5 35 (Unhealthy for Sensitive Groups)
particulate matter (PM2.5) dustO3 0.04 (Good)
ozone (O3)NO2 0 (Good)
nitrogen dioxide (NO2)SO2 0 (Good)
sulfur dioxide (SO2)北京南路
| index | 2022-05-27 |
|---|---|
| pm10 | 56 |
| pm25 | 56 |
| o3 | 0.03 |
| no2 | 0 |
| so2 | 0 |
北京南路
| index | 2020-05 | 2020-04 | 2020-03 | 2020-02 | 2020-01 | 2019-12 | 2019-11 | 2019-10 | 2019-09 | 2019-08 | 2019-07 | 2019-06 | 2019-05 | 2019-04 | 2019-03 | 2019-02 | 2019-01 | 2018-12 | 2018-11 | 2018-10 |
|---|---|---|---|---|---|---|---|---|---|---|---|---|---|---|---|---|---|---|---|---|
| pm25 | 29 | 44 | 43 | 48 | 81 | 68 | 48 | 54 | 28 | 17 | 24 | 26 | 31 | 31 | 45 | 62 | 78 | 52 | 64 | 42 |
| co | 813 | 532 | 659 | 602 | 977 | 934 | 738 | 768 | 683 | 762 | 645 | 706 | 715 | 605 | 828 | 1 | 1 | 966 | 1 | 639 |
| no2 | 21 | 28 | 26 | 17 | 28 | 47 | 43 | 37 | 24 | 19 | 21 | 19 | 34 | 31 | 38 | 29 | 46 | 40 | 39 | 37 |
| o3 | 137 | 142 | 106 | 90 | 64 | 68 | 82 | 114 | 139 | 126 | 161 | 195 | 155 | 124 | 117 | 86 | 64 | 58 | 89 | 115 |
| pm10 | 52 | 74 | 72 | 58 | 90 | 98 | 100 | 96 | 54 | 38 | 49 | 59 | 85 | 74 | 108 | 117 | 135 | 107 | 108 | 92 |
| so2 | 7.3 | 9.2 | 7 | 4.1 | 3.9 | 4.5 | 5.3 | 5.5 | 4.9 | 5 | 4.8 | 5.6 | 7.6 | 5.2 | 7.6 | 5 | 8 | 6.6 | 5.5 | 6.1 |