Air Pollution in Shenchang: Real-time Air Quality Index and smog alert.
Pollution and air quality forecast for Shenchang. Today is Tuesday, June 2, 2026. The following air pollution values have been recorded for Shenchang:- particulate matter (PM10) suspended dust - 179 (Very bad Hazardous)
- particulate matter (PM2.5) dust - 35 (Unhealthy for Sensitive Groups)
- ozone (O3) - 0 (Good)
- nitrogen dioxide (NO2) - 0 (Good)
- sulfur dioxide (SO2) - 0 (Good)

What is the air quality in Shenchang today? Is the air polluted in Shenchang?. Is there smog?
What is the level of PM10 today in Shenchang? (particulate matter (PM10) suspended dust)
The current level of particulate matter PM10 in Shenchang is:
179 (Very bad Hazardous)
The highest PM10 values usually occur in month: 162 (January 2019).
The lowest value of particulate matter PM10 pollution in Shenchang is usually recorded in: August (52).
What is the current level of PM2.5 in Shenchang? (particulate matter (PM2.5) dust)
Today's PM2.5 level is:
35 (Unhealthy for Sensitive Groups)
For comparison, the highest level of PM2.5 in Shenchang in the last 7 days was: 56 (Friday, May 27, 2022) and the lowest: 56 (Friday, May 27, 2022).
The highest PM2.5 values were recorded: 121 (January 2020).
The lowest level of particulate matter PM2.5 pollution occurs in month: August (25).
How is the O3 level today in Shenchang? (ozone (O3))
0 (Good)
How high is the level of NO2? (nitrogen dioxide (NO2))
0 (Good)
What is the level of SO2 pollution? (sulfur dioxide (SO2))
0 (Good)
Current data Friday, May 27, 2022, 12:00 PM
PM10 179 (Very bad Hazardous)
PM2,5 35 (Unhealthy for Sensitive Groups)
O3 0 (Good)
NO2 0 (Good)
SO2 0 (Good)
Data on air pollution from recent days in Shenchang
index
2022-05-27
pm10
56
Unhealthy for Sensitive Groups
pm25
56
Unhealthy
o3
0
Good
no2
0
Good
so2
0
Good
data source »
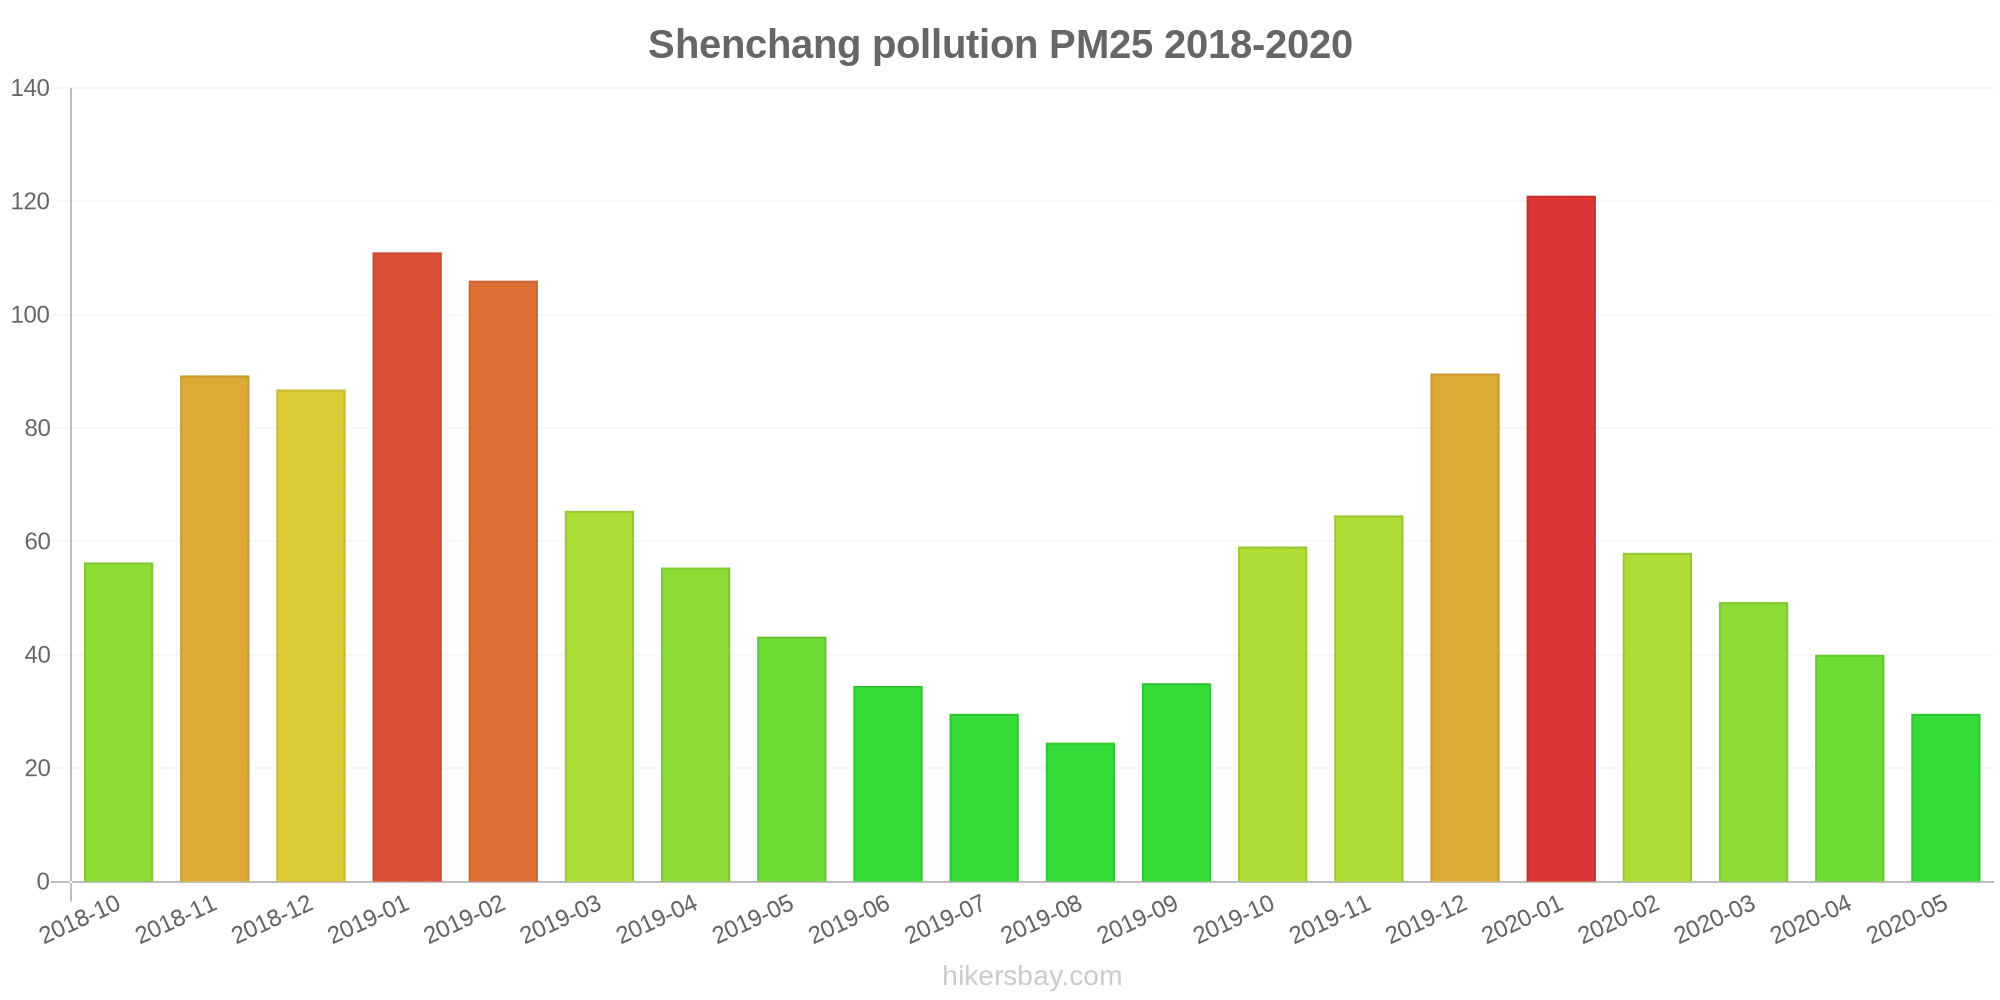
Air pollution in Shenchang from October 2018 to May 2020

index
2020-05
2020-04
2020-03
2020-02
2020-01
2019-12
2019-11
2019-10
2019-09
2019-08
2019-07
2019-06
2019-05
2019-04
2019-03
2019-02
2019-01
2018-12
2018-11
2018-10
pm25
30 (Moderate)
40 (Unhealthy for Sensitive Groups)
49 (Unhealthy for Sensitive Groups)
58 (Unhealthy)
121 (Very bad Hazardous)
90 (Very Unhealthy)
65 (Unhealthy)
59 (Unhealthy)
35 (Unhealthy for Sensitive Groups)
25 (Moderate)
30 (Moderate)
35 (Moderate)
43 (Unhealthy for Sensitive Groups)
55 (Unhealthy)
65 (Unhealthy)
106 (Very Unhealthy)
111 (Very bad Hazardous)
87 (Very Unhealthy)
89 (Very Unhealthy)
56 (Unhealthy)
co
504 (Good)
485 (Good)
804 (Good)
781 (Good)
1 (Good)
1 (Good)
850 (Good)
941 (Good)
795 (Good)
666 (Good)
549 (Good)
534 (Good)
602 (Good)
629 (Good)
575 (Good)
1 (Good)
1 (Good)
1 (Good)
1 (Good)
955 (Good)
no2
23 (Good)
35 (Good)
34 (Good)
21 (Good)
45 (Moderate)
56 (Moderate)
55 (Moderate)
53 (Moderate)
39 (Good)
29 (Good)
18 (Good)
23 (Good)
29 (Good)
35 (Good)
41 (Moderate)
33 (Good)
43 (Moderate)
46 (Moderate)
59 (Moderate)
59 (Moderate)
o3
132 (Unhealthy for Sensitive Groups)
141 (Unhealthy for Sensitive Groups)
104 (Moderate)
88 (Moderate)
65 (Good)
54 (Good)
88 (Moderate)
115 (Moderate)
168 (Unhealthy)
130 (Unhealthy for Sensitive Groups)
169 (Unhealthy)
201 (Very Unhealthy)
167 (Unhealthy)
129 (Unhealthy for Sensitive Groups)
117 (Moderate)
79 (Moderate)
56 (Good)
43 (Good)
76 (Moderate)
98 (Moderate)
pm10
77 (Unhealthy for Sensitive Groups)
87 (Unhealthy)
92 (Unhealthy)
73 (Unhealthy for Sensitive Groups)
142 (Very Unhealthy)
116 (Very Unhealthy)
132 (Very Unhealthy)
125 (Very Unhealthy)
79 (Unhealthy for Sensitive Groups)
52 (Unhealthy for Sensitive Groups)
54 (Unhealthy for Sensitive Groups)
78 (Unhealthy for Sensitive Groups)
97 (Unhealthy)
101 (Unhealthy)
125 (Very Unhealthy)
152 (Very bad Hazardous)
162 (Very bad Hazardous)
141 (Very Unhealthy)
145 (Very Unhealthy)
123 (Very Unhealthy)
so2
9.9 (Good)
12 (Good)
11 (Good)
9.1 (Good)
12 (Good)
13 (Good)
17 (Good)
15 (Good)
11 (Good)
9.9 (Good)
10 (Good)
13 (Good)
12 (Good)
8.7 (Good)
13 (Good)
17 (Good)
23 (Good)
25 (Good)
19 (Good)
21 (Good)
data source »
黄河新村
Friday, May 27, 2022, 12:00 PM
PM10 179 (Very bad Hazardous)
particulate matter (PM10) suspended dust
PM2,5 35 (Unhealthy for Sensitive Groups)
particulate matter (PM2.5) dust
O3 0.04 (Good)
ozone (O3)
NO2 0 (Good)
nitrogen dioxide (NO2)
SO2 0 (Good)
sulfur dioxide (SO2)
黄河新村
index
2022-05-27
pm10
56
pm25
56
o3
0.03
no2
0
so2
0
黄河新村
2018-10 2020-05

index
2020-05
2020-04
2020-03
2020-02
2020-01
2019-12
2019-11
2019-10
2019-09
2019-08
2019-07
2019-06
2019-05
2019-04
2019-03
2019-02
2019-01
2018-12
2018-11
2018-10
pm25
30
40
49
58
121
90
65
59
35
25
30
35
43
55
65
106
111
87
89
56
co
504
485
804
781
1
1
850
941
795
666
549
534
602
629
575
1
1
1
1
955
no2
23
35
34
21
45
56
55
53
39
29
18
23
29
35
41
33
43
46
59
59
o3
132
141
104
88
65
54
88
115
168
130
169
201
167
129
117
79
56
43
76
98
pm10
77
87
92
73
142
116
132
125
79
52
54
78
97
101
125
152
162
141
145
123
so2
9.9
12
11
9.1
12
13
17
15
11
9.9
10
13
12
8.7
13
17
23
25
19
21
* Pollution data source:
https://openaq.org
(ChinaAQIData)
The data is licensed under CC-By 4.0
PM10 179 (Very bad Hazardous)
PM2,5 35 (Unhealthy for Sensitive Groups)
O3 0 (Good)
NO2 0 (Good)
SO2 0 (Good)
Data on air pollution from recent days in Shenchang
| index | 2022-05-27 |
|---|---|
| pm10 | 56 Unhealthy for Sensitive Groups |
| pm25 | 56 Unhealthy |
| o3 | 0 Good |
| no2 | 0 Good |
| so2 | 0 Good |
| index | 2020-05 | 2020-04 | 2020-03 | 2020-02 | 2020-01 | 2019-12 | 2019-11 | 2019-10 | 2019-09 | 2019-08 | 2019-07 | 2019-06 | 2019-05 | 2019-04 | 2019-03 | 2019-02 | 2019-01 | 2018-12 | 2018-11 | 2018-10 |
|---|---|---|---|---|---|---|---|---|---|---|---|---|---|---|---|---|---|---|---|---|
| pm25 | 30 (Moderate) | 40 (Unhealthy for Sensitive Groups) | 49 (Unhealthy for Sensitive Groups) | 58 (Unhealthy) | 121 (Very bad Hazardous) | 90 (Very Unhealthy) | 65 (Unhealthy) | 59 (Unhealthy) | 35 (Unhealthy for Sensitive Groups) | 25 (Moderate) | 30 (Moderate) | 35 (Moderate) | 43 (Unhealthy for Sensitive Groups) | 55 (Unhealthy) | 65 (Unhealthy) | 106 (Very Unhealthy) | 111 (Very bad Hazardous) | 87 (Very Unhealthy) | 89 (Very Unhealthy) | 56 (Unhealthy) |
| co | 504 (Good) | 485 (Good) | 804 (Good) | 781 (Good) | 1 (Good) | 1 (Good) | 850 (Good) | 941 (Good) | 795 (Good) | 666 (Good) | 549 (Good) | 534 (Good) | 602 (Good) | 629 (Good) | 575 (Good) | 1 (Good) | 1 (Good) | 1 (Good) | 1 (Good) | 955 (Good) |
| no2 | 23 (Good) | 35 (Good) | 34 (Good) | 21 (Good) | 45 (Moderate) | 56 (Moderate) | 55 (Moderate) | 53 (Moderate) | 39 (Good) | 29 (Good) | 18 (Good) | 23 (Good) | 29 (Good) | 35 (Good) | 41 (Moderate) | 33 (Good) | 43 (Moderate) | 46 (Moderate) | 59 (Moderate) | 59 (Moderate) |
| o3 | 132 (Unhealthy for Sensitive Groups) | 141 (Unhealthy for Sensitive Groups) | 104 (Moderate) | 88 (Moderate) | 65 (Good) | 54 (Good) | 88 (Moderate) | 115 (Moderate) | 168 (Unhealthy) | 130 (Unhealthy for Sensitive Groups) | 169 (Unhealthy) | 201 (Very Unhealthy) | 167 (Unhealthy) | 129 (Unhealthy for Sensitive Groups) | 117 (Moderate) | 79 (Moderate) | 56 (Good) | 43 (Good) | 76 (Moderate) | 98 (Moderate) |
| pm10 | 77 (Unhealthy for Sensitive Groups) | 87 (Unhealthy) | 92 (Unhealthy) | 73 (Unhealthy for Sensitive Groups) | 142 (Very Unhealthy) | 116 (Very Unhealthy) | 132 (Very Unhealthy) | 125 (Very Unhealthy) | 79 (Unhealthy for Sensitive Groups) | 52 (Unhealthy for Sensitive Groups) | 54 (Unhealthy for Sensitive Groups) | 78 (Unhealthy for Sensitive Groups) | 97 (Unhealthy) | 101 (Unhealthy) | 125 (Very Unhealthy) | 152 (Very bad Hazardous) | 162 (Very bad Hazardous) | 141 (Very Unhealthy) | 145 (Very Unhealthy) | 123 (Very Unhealthy) |
| so2 | 9.9 (Good) | 12 (Good) | 11 (Good) | 9.1 (Good) | 12 (Good) | 13 (Good) | 17 (Good) | 15 (Good) | 11 (Good) | 9.9 (Good) | 10 (Good) | 13 (Good) | 12 (Good) | 8.7 (Good) | 13 (Good) | 17 (Good) | 23 (Good) | 25 (Good) | 19 (Good) | 21 (Good) |
PM10 179 (Very bad Hazardous)
particulate matter (PM10) suspended dustPM2,5 35 (Unhealthy for Sensitive Groups)
particulate matter (PM2.5) dustO3 0.04 (Good)
ozone (O3)NO2 0 (Good)
nitrogen dioxide (NO2)SO2 0 (Good)
sulfur dioxide (SO2)黄河新村
| index | 2022-05-27 |
|---|---|
| pm10 | 56 |
| pm25 | 56 |
| o3 | 0.03 |
| no2 | 0 |
| so2 | 0 |
黄河新村

| index | 2020-05 | 2020-04 | 2020-03 | 2020-02 | 2020-01 | 2019-12 | 2019-11 | 2019-10 | 2019-09 | 2019-08 | 2019-07 | 2019-06 | 2019-05 | 2019-04 | 2019-03 | 2019-02 | 2019-01 | 2018-12 | 2018-11 | 2018-10 |
|---|---|---|---|---|---|---|---|---|---|---|---|---|---|---|---|---|---|---|---|---|
| pm25 | 30 | 40 | 49 | 58 | 121 | 90 | 65 | 59 | 35 | 25 | 30 | 35 | 43 | 55 | 65 | 106 | 111 | 87 | 89 | 56 |
| co | 504 | 485 | 804 | 781 | 1 | 1 | 850 | 941 | 795 | 666 | 549 | 534 | 602 | 629 | 575 | 1 | 1 | 1 | 1 | 955 |
| no2 | 23 | 35 | 34 | 21 | 45 | 56 | 55 | 53 | 39 | 29 | 18 | 23 | 29 | 35 | 41 | 33 | 43 | 46 | 59 | 59 |
| o3 | 132 | 141 | 104 | 88 | 65 | 54 | 88 | 115 | 168 | 130 | 169 | 201 | 167 | 129 | 117 | 79 | 56 | 43 | 76 | 98 |
| pm10 | 77 | 87 | 92 | 73 | 142 | 116 | 132 | 125 | 79 | 52 | 54 | 78 | 97 | 101 | 125 | 152 | 162 | 141 | 145 | 123 |
| so2 | 9.9 | 12 | 11 | 9.1 | 12 | 13 | 17 | 15 | 11 | 9.9 | 10 | 13 | 12 | 8.7 | 13 | 17 | 23 | 25 | 19 | 21 |