Air Pollution in Yangzhuang: Real-time Air Quality Index and smog alert.
Pollution and air quality forecast for Yangzhuang. Today is Tuesday, June 2, 2026. The following air pollution values have been recorded for Yangzhuang:- particulate matter (PM10) suspended dust - 179 (Very bad Hazardous)
- particulate matter (PM2.5) dust - 35 (Unhealthy for Sensitive Groups)
- ozone (O3) - 0 (Good)
- nitrogen dioxide (NO2) - 0 (Good)
- sulfur dioxide (SO2) - 0 (Good)

What is the air quality in Yangzhuang today? Is the air polluted in Yangzhuang?. Is there smog?
What is the level of PM10 today in Yangzhuang? (particulate matter (PM10) suspended dust)
The current level of particulate matter PM10 in Yangzhuang is:
179 (Very bad Hazardous)
The highest PM10 values usually occur in month: 168 (January 2019).
The lowest value of particulate matter PM10 pollution in Yangzhuang is usually recorded in: August (56).
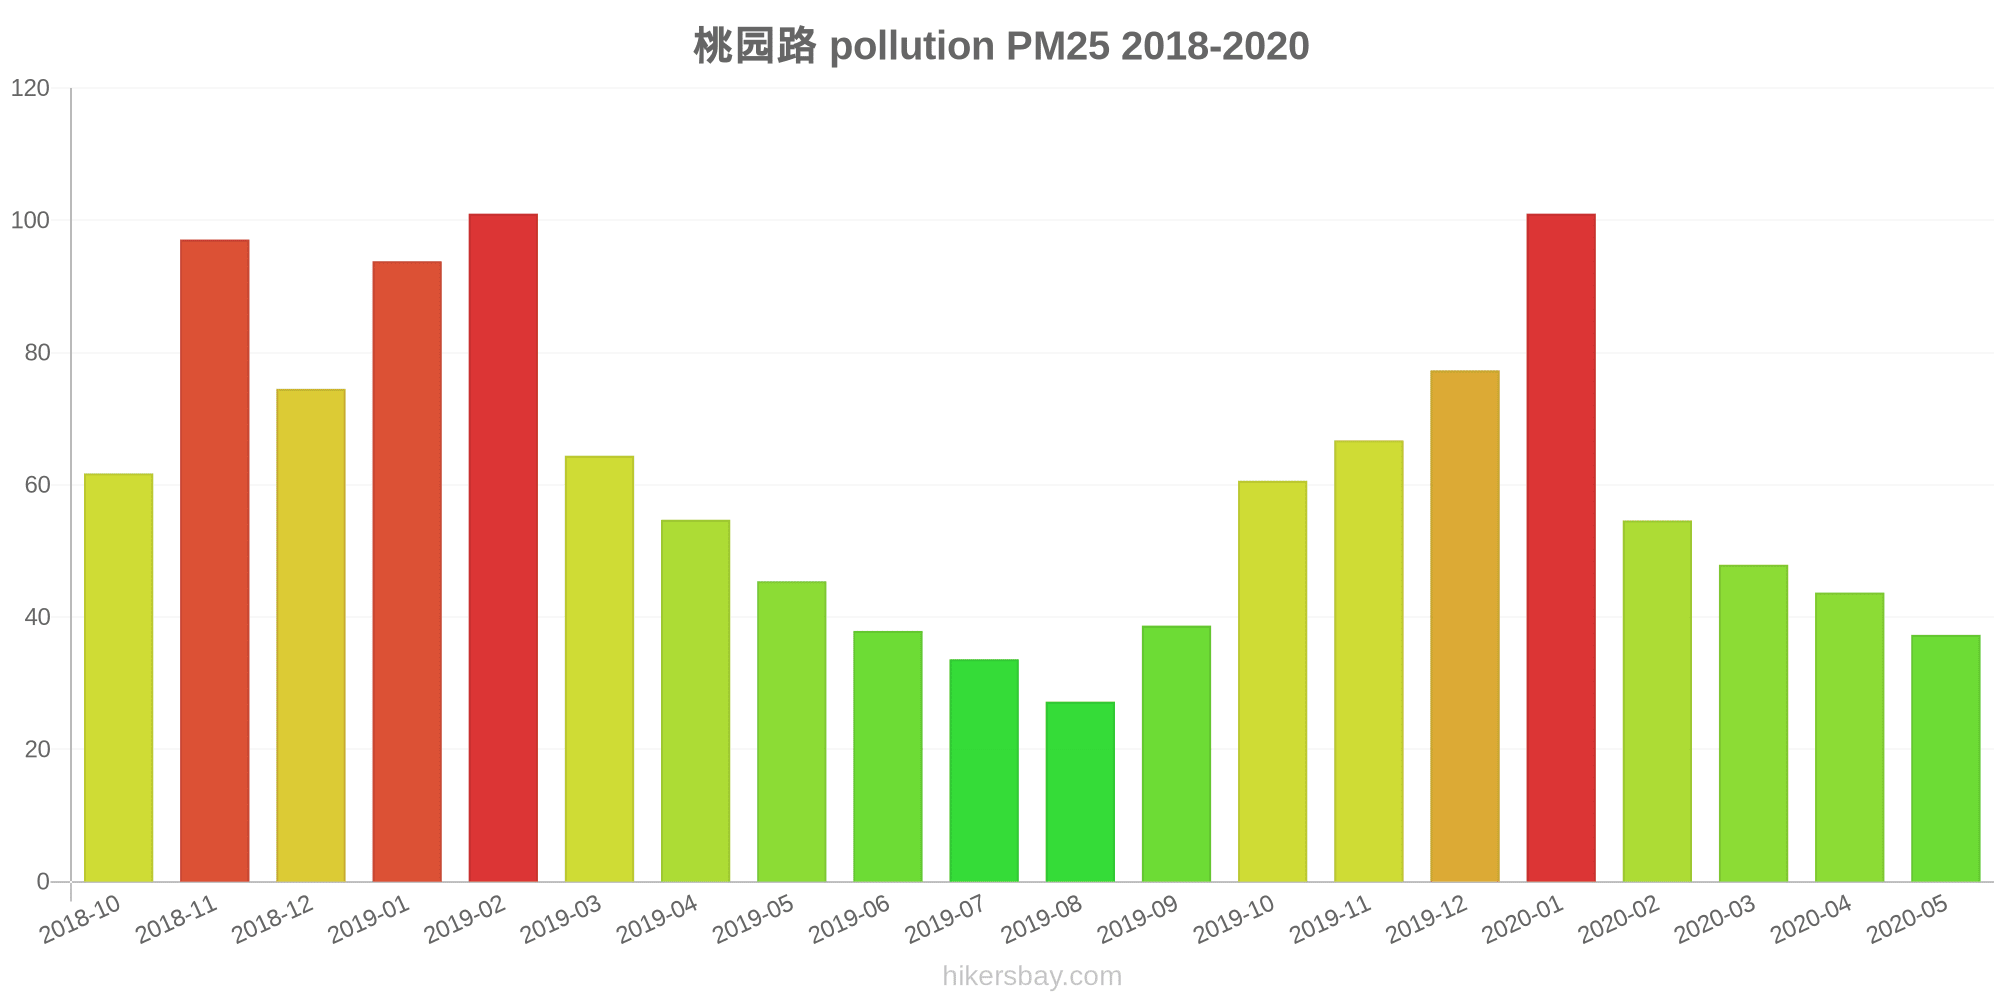
What is the current level of PM2.5 in Yangzhuang? (particulate matter (PM2.5) dust)
Today's PM2.5 level is:
35 (Unhealthy for Sensitive Groups)
For comparison, the highest level of PM2.5 in Yangzhuang in the last 7 days was: 56 (Friday, May 27, 2022) and the lowest: 56 (Friday, May 27, 2022).
The highest PM2.5 values were recorded: 101 (January 2020).
The lowest level of particulate matter PM2.5 pollution occurs in month: August (27).
How is the O3 level today in Yangzhuang? (ozone (O3))
0 (Good)
How high is the level of NO2? (nitrogen dioxide (NO2))
0 (Good)
What is the level of SO2 pollution? (sulfur dioxide (SO2))
0 (Good)
Current data Friday, May 27, 2022, 12:00 PM
PM10 179 (Very bad Hazardous)
PM2,5 35 (Unhealthy for Sensitive Groups)
O3 0 (Good)
NO2 0 (Good)
SO2 0 (Good)
Data on air pollution from recent days in Yangzhuang
index
2022-05-27
pm10
56
Unhealthy for Sensitive Groups
pm25
56
Unhealthy
o3
0
Good
no2
0
Good
so2
0
Good
data source »
Air pollution in Yangzhuang from October 2018 to May 2020

index
2020-05
2020-04
2020-03
2020-02
2020-01
2019-12
2019-11
2019-10
2019-09
2019-08
2019-07
2019-06
2019-05
2019-04
2019-03
2019-02
2019-01
2018-12
2018-11
2018-10
pm25
37 (Unhealthy for Sensitive Groups)
44 (Unhealthy for Sensitive Groups)
48 (Unhealthy for Sensitive Groups)
55 (Unhealthy for Sensitive Groups)
101 (Very Unhealthy)
77 (Very Unhealthy)
67 (Unhealthy)
61 (Unhealthy)
39 (Unhealthy for Sensitive Groups)
27 (Moderate)
34 (Moderate)
38 (Unhealthy for Sensitive Groups)
45 (Unhealthy for Sensitive Groups)
55 (Unhealthy for Sensitive Groups)
64 (Unhealthy)
101 (Very Unhealthy)
94 (Very Unhealthy)
75 (Unhealthy)
97 (Very Unhealthy)
62 (Unhealthy)
co
393 (Good)
621 (Good)
640 (Good)
858 (Good)
1 (Good)
1 (Good)
769 (Good)
759 (Good)
674 (Good)
528 (Good)
401 (Good)
324 (Good)
293 (Good)
459 (Good)
441 (Good)
853 (Good)
1 (Good)
915 (Good)
909 (Good)
632 (Good)
no2
23 (Good)
37 (Good)
34 (Good)
20 (Good)
42 (Moderate)
49 (Moderate)
49 (Moderate)
52 (Moderate)
38 (Good)
24 (Good)
17 (Good)
20 (Good)
29 (Good)
31 (Good)
41 (Moderate)
35 (Good)
55 (Moderate)
53 (Moderate)
53 (Moderate)
65 (Moderate)
o3
143 (Unhealthy for Sensitive Groups)
151 (Unhealthy)
110 (Moderate)
97 (Moderate)
79 (Moderate)
57 (Good)
96 (Moderate)
118 (Moderate)
164 (Unhealthy)
127 (Unhealthy for Sensitive Groups)
162 (Unhealthy)
198 (Very Unhealthy)
165 (Unhealthy)
131 (Unhealthy for Sensitive Groups)
120 (Unhealthy for Sensitive Groups)
91 (Moderate)
63 (Good)
57 (Good)
90 (Moderate)
109 (Moderate)
pm10
77 (Unhealthy for Sensitive Groups)
93 (Unhealthy)
94 (Unhealthy)
75 (Unhealthy for Sensitive Groups)
132 (Very Unhealthy)
114 (Very Unhealthy)
132 (Very Unhealthy)
127 (Very Unhealthy)
84 (Unhealthy)
56 (Unhealthy for Sensitive Groups)
57 (Unhealthy for Sensitive Groups)
80 (Unhealthy for Sensitive Groups)
99 (Unhealthy)
98 (Unhealthy)
125 (Very Unhealthy)
151 (Very bad Hazardous)
168 (Very bad Hazardous)
143 (Very Unhealthy)
149 (Very Unhealthy)
126 (Very Unhealthy)
so2
5.2 (Good)
10 (Good)
11 (Good)
8.9 (Good)
15 (Good)
12 (Good)
12 (Good)
9.5 (Good)
6.9 (Good)
3.2 (Good)
7 (Good)
12 (Good)
13 (Good)
11 (Good)
12 (Good)
12 (Good)
14 (Good)
15 (Good)
16 (Good)
24 (Good)
data source »
桃园路
Friday, May 27, 2022, 12:00 PM
PM10 179 (Very bad Hazardous)
particulate matter (PM10) suspended dust
PM2,5 35 (Unhealthy for Sensitive Groups)
particulate matter (PM2.5) dust
O3 0.04 (Good)
ozone (O3)
NO2 0 (Good)
nitrogen dioxide (NO2)
SO2 0 (Good)
sulfur dioxide (SO2)
桃园路
index
2022-05-27
pm10
56
pm25
56
o3
0.03
no2
0
so2
0
桃园路
2018-10 2020-05

index
2020-05
2020-04
2020-03
2020-02
2020-01
2019-12
2019-11
2019-10
2019-09
2019-08
2019-07
2019-06
2019-05
2019-04
2019-03
2019-02
2019-01
2018-12
2018-11
2018-10
pm25
37
44
48
55
101
77
67
61
39
27
34
38
45
55
64
101
94
75
97
62
co
393
621
640
858
1
1
769
759
674
528
401
324
293
459
441
853
1
915
909
632
no2
23
37
34
20
42
49
49
52
38
24
17
20
29
31
41
35
55
53
53
65
o3
143
151
110
97
79
57
96
118
164
127
162
198
165
131
120
91
63
57
90
109
pm10
77
93
94
75
132
114
132
127
84
56
57
80
99
98
125
151
168
143
149
126
so2
5.2
10
11
8.9
15
12
12
9.5
6.9
3.2
7
12
13
11
12
12
14
15
16
24
* Pollution data source:
https://openaq.org
(ChinaAQIData)
The data is licensed under CC-By 4.0
PM10 179 (Very bad Hazardous)
PM2,5 35 (Unhealthy for Sensitive Groups)
O3 0 (Good)
NO2 0 (Good)
SO2 0 (Good)
Data on air pollution from recent days in Yangzhuang
| index | 2022-05-27 |
|---|---|
| pm10 | 56 Unhealthy for Sensitive Groups |
| pm25 | 56 Unhealthy |
| o3 | 0 Good |
| no2 | 0 Good |
| so2 | 0 Good |

| index | 2020-05 | 2020-04 | 2020-03 | 2020-02 | 2020-01 | 2019-12 | 2019-11 | 2019-10 | 2019-09 | 2019-08 | 2019-07 | 2019-06 | 2019-05 | 2019-04 | 2019-03 | 2019-02 | 2019-01 | 2018-12 | 2018-11 | 2018-10 |
|---|---|---|---|---|---|---|---|---|---|---|---|---|---|---|---|---|---|---|---|---|
| pm25 | 37 (Unhealthy for Sensitive Groups) | 44 (Unhealthy for Sensitive Groups) | 48 (Unhealthy for Sensitive Groups) | 55 (Unhealthy for Sensitive Groups) | 101 (Very Unhealthy) | 77 (Very Unhealthy) | 67 (Unhealthy) | 61 (Unhealthy) | 39 (Unhealthy for Sensitive Groups) | 27 (Moderate) | 34 (Moderate) | 38 (Unhealthy for Sensitive Groups) | 45 (Unhealthy for Sensitive Groups) | 55 (Unhealthy for Sensitive Groups) | 64 (Unhealthy) | 101 (Very Unhealthy) | 94 (Very Unhealthy) | 75 (Unhealthy) | 97 (Very Unhealthy) | 62 (Unhealthy) |
| co | 393 (Good) | 621 (Good) | 640 (Good) | 858 (Good) | 1 (Good) | 1 (Good) | 769 (Good) | 759 (Good) | 674 (Good) | 528 (Good) | 401 (Good) | 324 (Good) | 293 (Good) | 459 (Good) | 441 (Good) | 853 (Good) | 1 (Good) | 915 (Good) | 909 (Good) | 632 (Good) |
| no2 | 23 (Good) | 37 (Good) | 34 (Good) | 20 (Good) | 42 (Moderate) | 49 (Moderate) | 49 (Moderate) | 52 (Moderate) | 38 (Good) | 24 (Good) | 17 (Good) | 20 (Good) | 29 (Good) | 31 (Good) | 41 (Moderate) | 35 (Good) | 55 (Moderate) | 53 (Moderate) | 53 (Moderate) | 65 (Moderate) |
| o3 | 143 (Unhealthy for Sensitive Groups) | 151 (Unhealthy) | 110 (Moderate) | 97 (Moderate) | 79 (Moderate) | 57 (Good) | 96 (Moderate) | 118 (Moderate) | 164 (Unhealthy) | 127 (Unhealthy for Sensitive Groups) | 162 (Unhealthy) | 198 (Very Unhealthy) | 165 (Unhealthy) | 131 (Unhealthy for Sensitive Groups) | 120 (Unhealthy for Sensitive Groups) | 91 (Moderate) | 63 (Good) | 57 (Good) | 90 (Moderate) | 109 (Moderate) |
| pm10 | 77 (Unhealthy for Sensitive Groups) | 93 (Unhealthy) | 94 (Unhealthy) | 75 (Unhealthy for Sensitive Groups) | 132 (Very Unhealthy) | 114 (Very Unhealthy) | 132 (Very Unhealthy) | 127 (Very Unhealthy) | 84 (Unhealthy) | 56 (Unhealthy for Sensitive Groups) | 57 (Unhealthy for Sensitive Groups) | 80 (Unhealthy for Sensitive Groups) | 99 (Unhealthy) | 98 (Unhealthy) | 125 (Very Unhealthy) | 151 (Very bad Hazardous) | 168 (Very bad Hazardous) | 143 (Very Unhealthy) | 149 (Very Unhealthy) | 126 (Very Unhealthy) |
| so2 | 5.2 (Good) | 10 (Good) | 11 (Good) | 8.9 (Good) | 15 (Good) | 12 (Good) | 12 (Good) | 9.5 (Good) | 6.9 (Good) | 3.2 (Good) | 7 (Good) | 12 (Good) | 13 (Good) | 11 (Good) | 12 (Good) | 12 (Good) | 14 (Good) | 15 (Good) | 16 (Good) | 24 (Good) |
PM10 179 (Very bad Hazardous)
particulate matter (PM10) suspended dustPM2,5 35 (Unhealthy for Sensitive Groups)
particulate matter (PM2.5) dustO3 0.04 (Good)
ozone (O3)NO2 0 (Good)
nitrogen dioxide (NO2)SO2 0 (Good)
sulfur dioxide (SO2)桃园路
| index | 2022-05-27 |
|---|---|
| pm10 | 56 |
| pm25 | 56 |
| o3 | 0.03 |
| no2 | 0 |
| so2 | 0 |
桃园路
| index | 2020-05 | 2020-04 | 2020-03 | 2020-02 | 2020-01 | 2019-12 | 2019-11 | 2019-10 | 2019-09 | 2019-08 | 2019-07 | 2019-06 | 2019-05 | 2019-04 | 2019-03 | 2019-02 | 2019-01 | 2018-12 | 2018-11 | 2018-10 |
|---|---|---|---|---|---|---|---|---|---|---|---|---|---|---|---|---|---|---|---|---|
| pm25 | 37 | 44 | 48 | 55 | 101 | 77 | 67 | 61 | 39 | 27 | 34 | 38 | 45 | 55 | 64 | 101 | 94 | 75 | 97 | 62 |
| co | 393 | 621 | 640 | 858 | 1 | 1 | 769 | 759 | 674 | 528 | 401 | 324 | 293 | 459 | 441 | 853 | 1 | 915 | 909 | 632 |
| no2 | 23 | 37 | 34 | 20 | 42 | 49 | 49 | 52 | 38 | 24 | 17 | 20 | 29 | 31 | 41 | 35 | 55 | 53 | 53 | 65 |
| o3 | 143 | 151 | 110 | 97 | 79 | 57 | 96 | 118 | 164 | 127 | 162 | 198 | 165 | 131 | 120 | 91 | 63 | 57 | 90 | 109 |
| pm10 | 77 | 93 | 94 | 75 | 132 | 114 | 132 | 127 | 84 | 56 | 57 | 80 | 99 | 98 | 125 | 151 | 168 | 143 | 149 | 126 |
| so2 | 5.2 | 10 | 11 | 8.9 | 15 | 12 | 12 | 9.5 | 6.9 | 3.2 | 7 | 12 | 13 | 11 | 12 | 12 | 14 | 15 | 16 | 24 |