Air Pollution in Shangshancun: Real-time Air Quality Index and smog alert.
Pollution and air quality forecast for Shangshancun. Today is Tuesday, June 2, 2026. The following air pollution values have been recorded for Shangshancun:- particulate matter (PM10) suspended dust - 179 (Very bad Hazardous)
- particulate matter (PM2.5) dust - 35 (Unhealthy for Sensitive Groups)
- ozone (O3) - 0 (Good)
- nitrogen dioxide (NO2) - 0 (Good)
- sulfur dioxide (SO2) - 0 (Good)

What is the air quality in Shangshancun today? Is the air polluted in Shangshancun?. Is there smog?
What is the level of PM10 today in Shangshancun? (particulate matter (PM10) suspended dust)
The current level of particulate matter PM10 in Shangshancun is:
179 (Very bad Hazardous)
The highest PM10 values usually occur in month: 167 (January 2019).
The lowest value of particulate matter PM10 pollution in Shangshancun is usually recorded in: August (50).
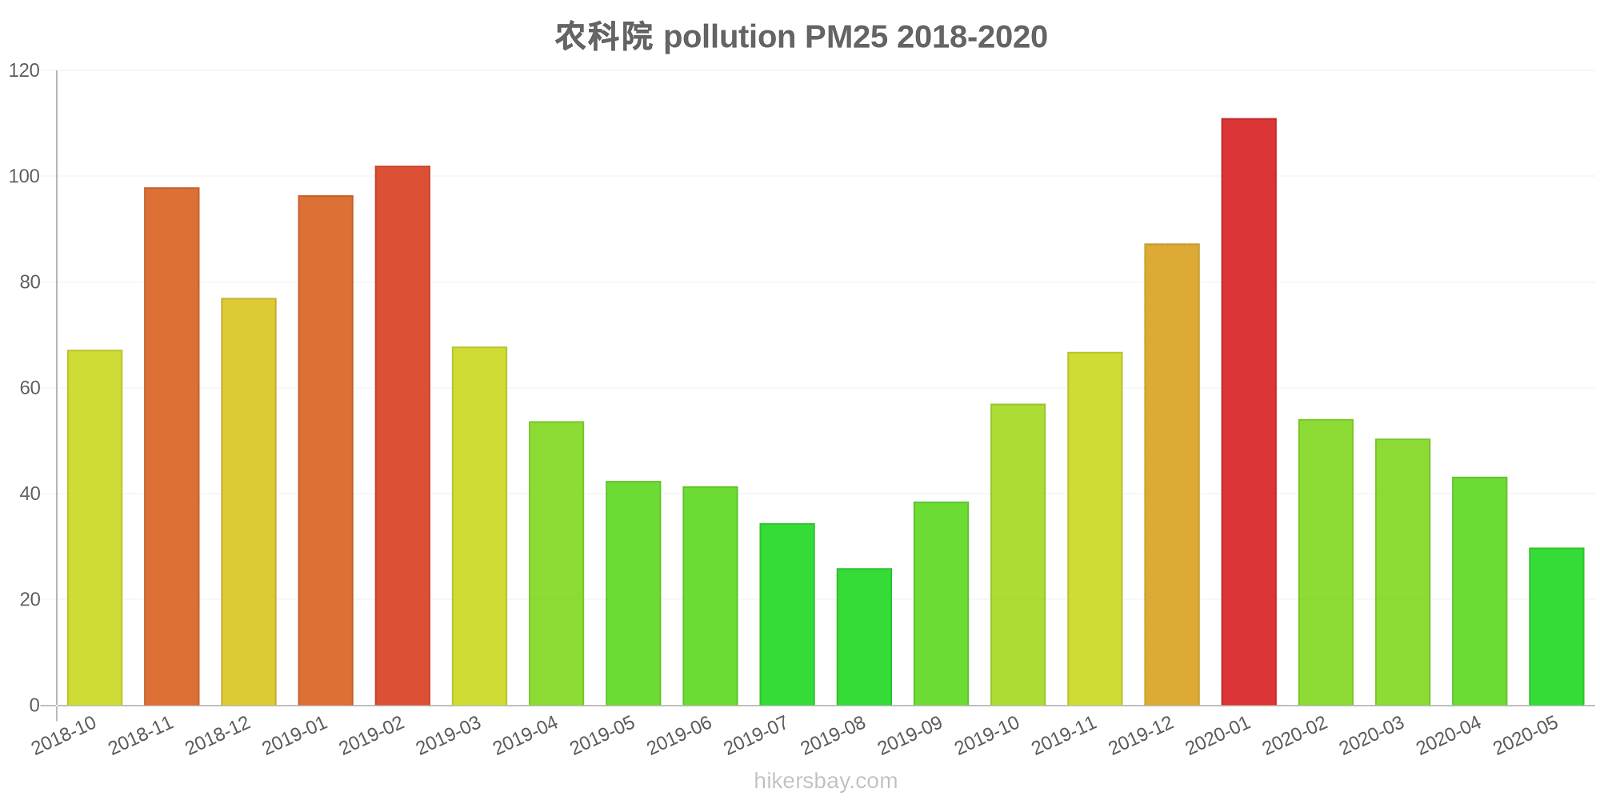
What is the current level of PM2.5 in Shangshancun? (particulate matter (PM2.5) dust)
Today's PM2.5 level is:
35 (Unhealthy for Sensitive Groups)
For comparison, the highest level of PM2.5 in Shangshancun in the last 7 days was: 56 (Friday, May 27, 2022) and the lowest: 56 (Friday, May 27, 2022).
The highest PM2.5 values were recorded: 111 (January 2020).
The lowest level of particulate matter PM2.5 pollution occurs in month: August (26).
How is the O3 level today in Shangshancun? (ozone (O3))
0 (Good)
How high is the level of NO2? (nitrogen dioxide (NO2))
0 (Good)
What is the level of SO2 pollution? (sulfur dioxide (SO2))
0 (Good)
Current data Friday, May 27, 2022, 12:00 PM
PM10 179 (Very bad Hazardous)
PM2,5 35 (Unhealthy for Sensitive Groups)
O3 0 (Good)
NO2 0 (Good)
SO2 0 (Good)
Data on air pollution from recent days in Shangshancun
index
2022-05-27
pm10
56
Unhealthy for Sensitive Groups
pm25
56
Unhealthy
o3
0
Good
no2
0
Good
so2
0
Good
data source »
Air pollution in Shangshancun from October 2018 to May 2020

index
2020-05
2020-04
2020-03
2020-02
2020-01
2019-12
2019-11
2019-10
2019-09
2019-08
2019-07
2019-06
2019-05
2019-04
2019-03
2019-02
2019-01
2018-12
2018-11
2018-10
pm25
30 (Moderate)
43 (Unhealthy for Sensitive Groups)
50 (Unhealthy for Sensitive Groups)
54 (Unhealthy for Sensitive Groups)
111 (Very bad Hazardous)
87 (Very Unhealthy)
67 (Unhealthy)
57 (Unhealthy)
39 (Unhealthy for Sensitive Groups)
26 (Moderate)
34 (Moderate)
41 (Unhealthy for Sensitive Groups)
42 (Unhealthy for Sensitive Groups)
54 (Unhealthy for Sensitive Groups)
68 (Unhealthy)
102 (Very Unhealthy)
96 (Very Unhealthy)
77 (Very Unhealthy)
98 (Very Unhealthy)
67 (Unhealthy)
co
616 (Good)
609 (Good)
875 (Good)
784 (Good)
1 (Good)
946 (Good)
752 (Good)
817 (Good)
650 (Good)
745 (Good)
696 (Good)
673 (Good)
642 (Good)
729 (Good)
796 (Good)
1 (Good)
1 (Good)
927 (Good)
926 (Good)
664 (Good)
no2
30 (Good)
44 (Moderate)
44 (Moderate)
25 (Good)
43 (Moderate)
55 (Moderate)
56 (Moderate)
58 (Moderate)
49 (Moderate)
34 (Good)
27 (Good)
31 (Good)
34 (Good)
34 (Good)
51 (Moderate)
43 (Moderate)
58 (Moderate)
49 (Moderate)
60 (Moderate)
63 (Moderate)
o3
130 (Unhealthy for Sensitive Groups)
140 (Unhealthy for Sensitive Groups)
105 (Moderate)
97 (Moderate)
80 (Moderate)
66 (Good)
89 (Moderate)
117 (Moderate)
164 (Unhealthy)
122 (Unhealthy for Sensitive Groups)
150 (Unhealthy)
186 (Very Unhealthy)
155 (Unhealthy)
125 (Unhealthy for Sensitive Groups)
118 (Moderate)
98 (Moderate)
62 (Good)
44 (Good)
87 (Moderate)
107 (Moderate)
pm10
72 (Unhealthy for Sensitive Groups)
91 (Unhealthy)
94 (Unhealthy)
79 (Unhealthy for Sensitive Groups)
146 (Very Unhealthy)
126 (Very Unhealthy)
139 (Very Unhealthy)
124 (Very Unhealthy)
78 (Unhealthy for Sensitive Groups)
50 (Moderate)
52 (Unhealthy for Sensitive Groups)
80 (Unhealthy for Sensitive Groups)
95 (Unhealthy)
96 (Unhealthy)
126 (Very Unhealthy)
141 (Very Unhealthy)
167 (Very bad Hazardous)
139 (Very Unhealthy)
132 (Very Unhealthy)
124 (Very Unhealthy)
so2
8.9 (Good)
12 (Good)
13 (Good)
8.4 (Good)
13 (Good)
14 (Good)
13 (Good)
12 (Good)
11 (Good)
6.5 (Good)
3.9 (Good)
9.9 (Good)
13 (Good)
11 (Good)
12 (Good)
9.8 (Good)
14 (Good)
16 (Good)
15 (Good)
17 (Good)
data source »
农科院
Friday, May 27, 2022, 12:00 PM
PM10 179 (Very bad Hazardous)
particulate matter (PM10) suspended dust
PM2,5 35 (Unhealthy for Sensitive Groups)
particulate matter (PM2.5) dust
O3 0.04 (Good)
ozone (O3)
NO2 0 (Good)
nitrogen dioxide (NO2)
SO2 0 (Good)
sulfur dioxide (SO2)
农科院
index
2022-05-27
pm10
56
pm25
56
o3
0.03
no2
0
so2
0
农科院
2018-10 2020-05
index
2020-05
2020-04
2020-03
2020-02
2020-01
2019-12
2019-11
2019-10
2019-09
2019-08
2019-07
2019-06
2019-05
2019-04
2019-03
2019-02
2019-01
2018-12
2018-11
2018-10
pm25
30
43
50
54
111
87
67
57
39
26
34
41
42
54
68
102
96
77
98
67
co
616
609
875
784
1
946
752
817
650
745
696
673
642
729
796
1
1
927
926
664
no2
30
44
44
25
43
55
56
58
49
34
27
31
34
34
51
43
58
49
60
63
o3
130
140
105
97
80
66
89
117
164
122
150
186
155
125
118
98
62
44
87
107
pm10
72
91
94
79
146
126
139
124
78
50
52
80
95
96
126
141
167
139
132
124
so2
8.9
12
13
8.4
13
14
13
12
11
6.5
3.9
9.9
13
11
12
9.8
14
16
15
17
* Pollution data source:
https://openaq.org
(ChinaAQIData)
The data is licensed under CC-By 4.0
PM10 179 (Very bad Hazardous)
PM2,5 35 (Unhealthy for Sensitive Groups)
O3 0 (Good)
NO2 0 (Good)
SO2 0 (Good)
Data on air pollution from recent days in Shangshancun
| index | 2022-05-27 |
|---|---|
| pm10 | 56 Unhealthy for Sensitive Groups |
| pm25 | 56 Unhealthy |
| o3 | 0 Good |
| no2 | 0 Good |
| so2 | 0 Good |

| index | 2020-05 | 2020-04 | 2020-03 | 2020-02 | 2020-01 | 2019-12 | 2019-11 | 2019-10 | 2019-09 | 2019-08 | 2019-07 | 2019-06 | 2019-05 | 2019-04 | 2019-03 | 2019-02 | 2019-01 | 2018-12 | 2018-11 | 2018-10 |
|---|---|---|---|---|---|---|---|---|---|---|---|---|---|---|---|---|---|---|---|---|
| pm25 | 30 (Moderate) | 43 (Unhealthy for Sensitive Groups) | 50 (Unhealthy for Sensitive Groups) | 54 (Unhealthy for Sensitive Groups) | 111 (Very bad Hazardous) | 87 (Very Unhealthy) | 67 (Unhealthy) | 57 (Unhealthy) | 39 (Unhealthy for Sensitive Groups) | 26 (Moderate) | 34 (Moderate) | 41 (Unhealthy for Sensitive Groups) | 42 (Unhealthy for Sensitive Groups) | 54 (Unhealthy for Sensitive Groups) | 68 (Unhealthy) | 102 (Very Unhealthy) | 96 (Very Unhealthy) | 77 (Very Unhealthy) | 98 (Very Unhealthy) | 67 (Unhealthy) |
| co | 616 (Good) | 609 (Good) | 875 (Good) | 784 (Good) | 1 (Good) | 946 (Good) | 752 (Good) | 817 (Good) | 650 (Good) | 745 (Good) | 696 (Good) | 673 (Good) | 642 (Good) | 729 (Good) | 796 (Good) | 1 (Good) | 1 (Good) | 927 (Good) | 926 (Good) | 664 (Good) |
| no2 | 30 (Good) | 44 (Moderate) | 44 (Moderate) | 25 (Good) | 43 (Moderate) | 55 (Moderate) | 56 (Moderate) | 58 (Moderate) | 49 (Moderate) | 34 (Good) | 27 (Good) | 31 (Good) | 34 (Good) | 34 (Good) | 51 (Moderate) | 43 (Moderate) | 58 (Moderate) | 49 (Moderate) | 60 (Moderate) | 63 (Moderate) |
| o3 | 130 (Unhealthy for Sensitive Groups) | 140 (Unhealthy for Sensitive Groups) | 105 (Moderate) | 97 (Moderate) | 80 (Moderate) | 66 (Good) | 89 (Moderate) | 117 (Moderate) | 164 (Unhealthy) | 122 (Unhealthy for Sensitive Groups) | 150 (Unhealthy) | 186 (Very Unhealthy) | 155 (Unhealthy) | 125 (Unhealthy for Sensitive Groups) | 118 (Moderate) | 98 (Moderate) | 62 (Good) | 44 (Good) | 87 (Moderate) | 107 (Moderate) |
| pm10 | 72 (Unhealthy for Sensitive Groups) | 91 (Unhealthy) | 94 (Unhealthy) | 79 (Unhealthy for Sensitive Groups) | 146 (Very Unhealthy) | 126 (Very Unhealthy) | 139 (Very Unhealthy) | 124 (Very Unhealthy) | 78 (Unhealthy for Sensitive Groups) | 50 (Moderate) | 52 (Unhealthy for Sensitive Groups) | 80 (Unhealthy for Sensitive Groups) | 95 (Unhealthy) | 96 (Unhealthy) | 126 (Very Unhealthy) | 141 (Very Unhealthy) | 167 (Very bad Hazardous) | 139 (Very Unhealthy) | 132 (Very Unhealthy) | 124 (Very Unhealthy) |
| so2 | 8.9 (Good) | 12 (Good) | 13 (Good) | 8.4 (Good) | 13 (Good) | 14 (Good) | 13 (Good) | 12 (Good) | 11 (Good) | 6.5 (Good) | 3.9 (Good) | 9.9 (Good) | 13 (Good) | 11 (Good) | 12 (Good) | 9.8 (Good) | 14 (Good) | 16 (Good) | 15 (Good) | 17 (Good) |
PM10 179 (Very bad Hazardous)
particulate matter (PM10) suspended dustPM2,5 35 (Unhealthy for Sensitive Groups)
particulate matter (PM2.5) dustO3 0.04 (Good)
ozone (O3)NO2 0 (Good)
nitrogen dioxide (NO2)SO2 0 (Good)
sulfur dioxide (SO2)农科院
| index | 2022-05-27 |
|---|---|
| pm10 | 56 |
| pm25 | 56 |
| o3 | 0.03 |
| no2 | 0 |
| so2 | 0 |
农科院

| index | 2020-05 | 2020-04 | 2020-03 | 2020-02 | 2020-01 | 2019-12 | 2019-11 | 2019-10 | 2019-09 | 2019-08 | 2019-07 | 2019-06 | 2019-05 | 2019-04 | 2019-03 | 2019-02 | 2019-01 | 2018-12 | 2018-11 | 2018-10 |
|---|---|---|---|---|---|---|---|---|---|---|---|---|---|---|---|---|---|---|---|---|
| pm25 | 30 | 43 | 50 | 54 | 111 | 87 | 67 | 57 | 39 | 26 | 34 | 41 | 42 | 54 | 68 | 102 | 96 | 77 | 98 | 67 |
| co | 616 | 609 | 875 | 784 | 1 | 946 | 752 | 817 | 650 | 745 | 696 | 673 | 642 | 729 | 796 | 1 | 1 | 927 | 926 | 664 |
| no2 | 30 | 44 | 44 | 25 | 43 | 55 | 56 | 58 | 49 | 34 | 27 | 31 | 34 | 34 | 51 | 43 | 58 | 49 | 60 | 63 |
| o3 | 130 | 140 | 105 | 97 | 80 | 66 | 89 | 117 | 164 | 122 | 150 | 186 | 155 | 125 | 118 | 98 | 62 | 44 | 87 | 107 |
| pm10 | 72 | 91 | 94 | 79 | 146 | 126 | 139 | 124 | 78 | 50 | 52 | 80 | 95 | 96 | 126 | 141 | 167 | 139 | 132 | 124 |
| so2 | 8.9 | 12 | 13 | 8.4 | 13 | 14 | 13 | 12 | 11 | 6.5 | 3.9 | 9.9 | 13 | 11 | 12 | 9.8 | 14 | 16 | 15 | 17 |