Air Pollution in Zhaomingcun: Real-time Air Quality Index and smog alert.
Pollution and air quality forecast for Zhaomingcun. Today is Tuesday, June 16, 2026. The following air pollution values have been recorded for Zhaomingcun:- particulate matter (PM10) suspended dust - 7 (Good)
- particulate matter (PM2.5) dust - 2 (Good)
- carbon monoxide (CO) - 100 (Good)
- nitrogen dioxide (NO2) - 8 (Good)
- ozone (O3) - 0 (Good)
- sulfur dioxide (SO2) - 9 (Good)

What is the air quality in Zhaomingcun today? Is the air polluted in Zhaomingcun?. Is there smog?
What is the level of PM10 today in Zhaomingcun? (particulate matter (PM10) suspended dust)
The current level of particulate matter PM10 in Zhaomingcun is:
7 (Good)
The highest PM10 values usually occur in month: 106 (January 2019).
The lowest value of particulate matter PM10 pollution in Zhaomingcun is usually recorded in: August (48).
What is the current level of PM2.5 in Zhaomingcun? (particulate matter (PM2.5) dust)
Today's PM2.5 level is:
2 (Good)
For comparison, the highest level of PM2.5 in Zhaomingcun in the last 7 days was: 24 (Friday, May 27, 2022) and the lowest: 24 (Friday, May 27, 2022).
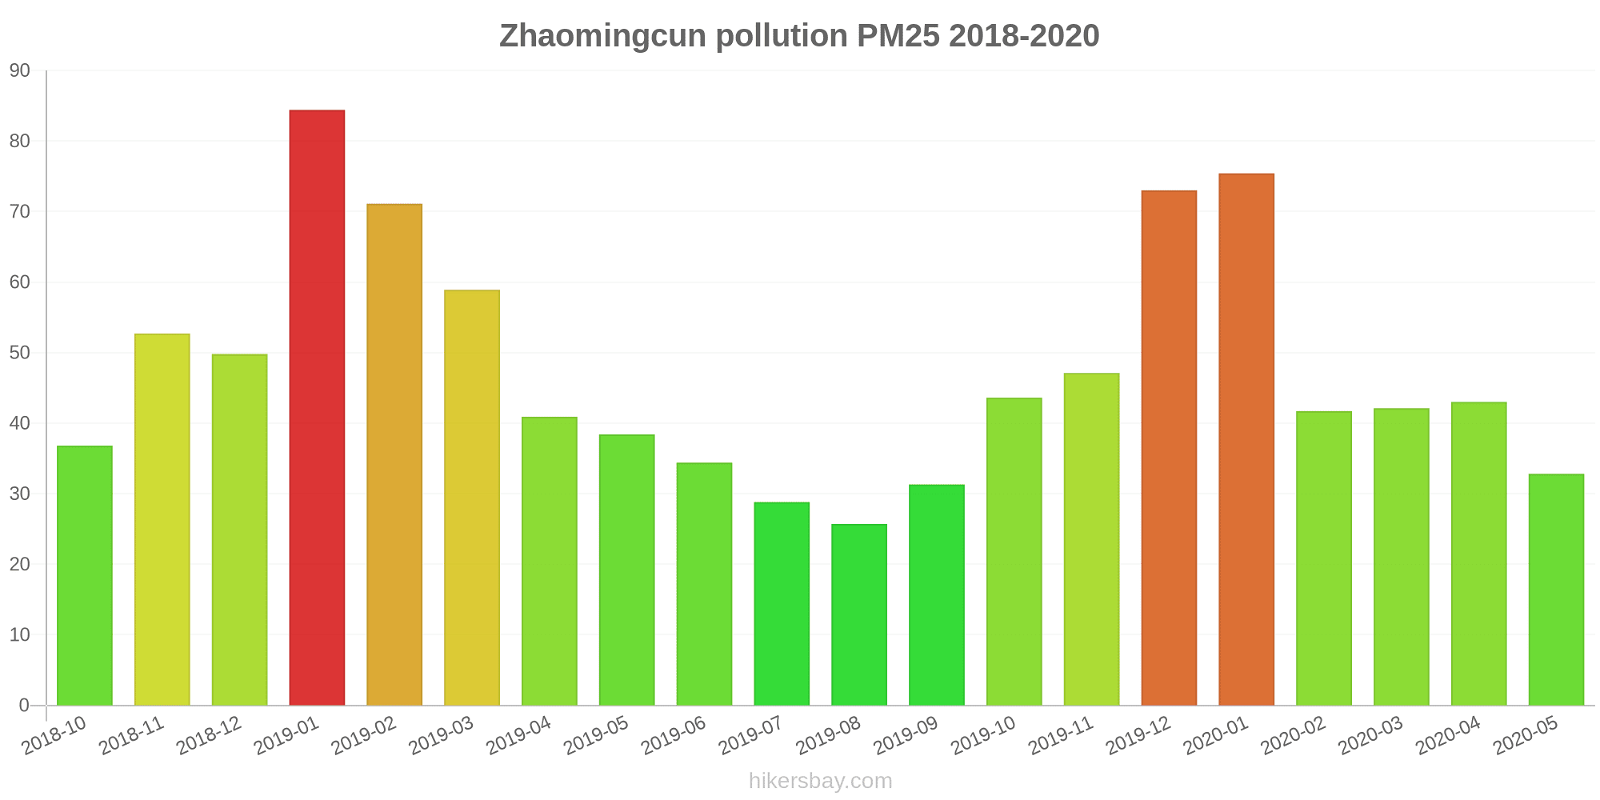
The highest PM2.5 values were recorded: 84 (January 2019).
The lowest level of particulate matter PM2.5 pollution occurs in month: August (26).
How high is the CO level? (carbon monoxide (CO))
100 (Good)
How high is the level of NO2? (nitrogen dioxide (NO2))
8 (Good)
How is the O3 level today in Zhaomingcun? (ozone (O3))
0 (Good)
What is the level of SO2 pollution? (sulfur dioxide (SO2))
9 (Good)
Current data Friday, May 27, 2022, 12:00 PM
PM10 7 (Good)
PM2,5 2 (Good)
CO 100 (Good)
NO2 8 (Good)
O3 0 (Good)
SO2 9 (Good)
Data on air pollution from recent days in Zhaomingcun
index
2022-05-27
pm10
32
Moderate
pm25
24
Moderate
co
468
Good
no2
21
Good
o3
32
Good
so2
5
Good
data source »
Air pollution in Zhaomingcun from October 2018 to May 2020
index
2020-05
2020-04
2020-03
2020-02
2020-01
2019-12
2019-11
2019-10
2019-09
2019-08
2019-07
2019-06
2019-05
2019-04
2019-03
2019-02
2019-01
2018-12
2018-11
2018-10
pm25
33 (Moderate)
43 (Unhealthy for Sensitive Groups)
42 (Unhealthy for Sensitive Groups)
42 (Unhealthy for Sensitive Groups)
75 (Very Unhealthy)
73 (Unhealthy)
47 (Unhealthy for Sensitive Groups)
44 (Unhealthy for Sensitive Groups)
31 (Moderate)
26 (Moderate)
29 (Moderate)
34 (Moderate)
38 (Unhealthy for Sensitive Groups)
41 (Unhealthy for Sensitive Groups)
59 (Unhealthy)
71 (Unhealthy)
84 (Very Unhealthy)
50 (Unhealthy for Sensitive Groups)
53 (Unhealthy for Sensitive Groups)
37 (Unhealthy for Sensitive Groups)
co
749 (Good)
700 (Good)
716 (Good)
689 (Good)
923 (Good)
923 (Good)
840 (Good)
871 (Good)
792 (Good)
709 (Good)
724 (Good)
875 (Good)
769 (Good)
813 (Good)
867 (Good)
988 (Good)
1 (Good)
973 (Good)
1 (Good)
985 (Good)
no2
24 (Good)
40 (Good)
34 (Good)
23 (Good)
39 (Good)
53 (Moderate)
48 (Moderate)
43 (Moderate)
28 (Good)
24 (Good)
27 (Good)
27 (Good)
35 (Good)
36 (Good)
44 (Moderate)
34 (Good)
54 (Moderate)
46 (Moderate)
47 (Moderate)
43 (Moderate)
o3
144 (Unhealthy for Sensitive Groups)
123 (Unhealthy for Sensitive Groups)
100 (Moderate)
86 (Moderate)
62 (Good)
67 (Good)
94 (Moderate)
113 (Moderate)
163 (Unhealthy)
158 (Unhealthy)
150 (Unhealthy)
181 (Very Unhealthy)
157 (Unhealthy)
130 (Unhealthy for Sensitive Groups)
112 (Moderate)
82 (Moderate)
61 (Good)
52 (Good)
92 (Moderate)
113 (Moderate)
pm10
61 (Unhealthy for Sensitive Groups)
78 (Unhealthy for Sensitive Groups)
66 (Unhealthy for Sensitive Groups)
50 (Moderate)
77 (Unhealthy for Sensitive Groups)
83 (Unhealthy)
87 (Unhealthy)
90 (Unhealthy)
57 (Unhealthy for Sensitive Groups)
48 (Moderate)
50 (Unhealthy for Sensitive Groups)
56 (Unhealthy for Sensitive Groups)
75 (Unhealthy for Sensitive Groups)
71 (Unhealthy for Sensitive Groups)
94 (Unhealthy)
83 (Unhealthy)
106 (Unhealthy)
76 (Unhealthy for Sensitive Groups)
81 (Unhealthy)
72 (Unhealthy for Sensitive Groups)
so2
12 (Good)
15 (Good)
12 (Good)
8.4 (Good)
10 (Good)
14 (Good)
15 (Good)
14 (Good)
12 (Good)
12 (Good)
9.6 (Good)
12 (Good)
14 (Good)
13 (Good)
15 (Good)
9 (Good)
13 (Good)
12 (Good)
14 (Good)
16 (Good)
data source »
Ma'anshan Ci Hu Er Xiao
Friday, May 27, 2022, 12:00 PM
PM10 6.7 (Good)
particulate matter (PM10) suspended dust
PM2,5 1.7 (Good)
particulate matter (PM2.5) dust
CO 100 (Good)
carbon monoxide (CO)
NO2 7.6 (Good)
nitrogen dioxide (NO2)
O3 0.02 (Good)
ozone (O3)
SO2 8.6 (Good)
sulfur dioxide (SO2)
Ma'anshan Ci Hu Er Xiao
index
2022-05-27
pm10
32
pm25
24
co
468
no2
21
o3
32
so2
4.6
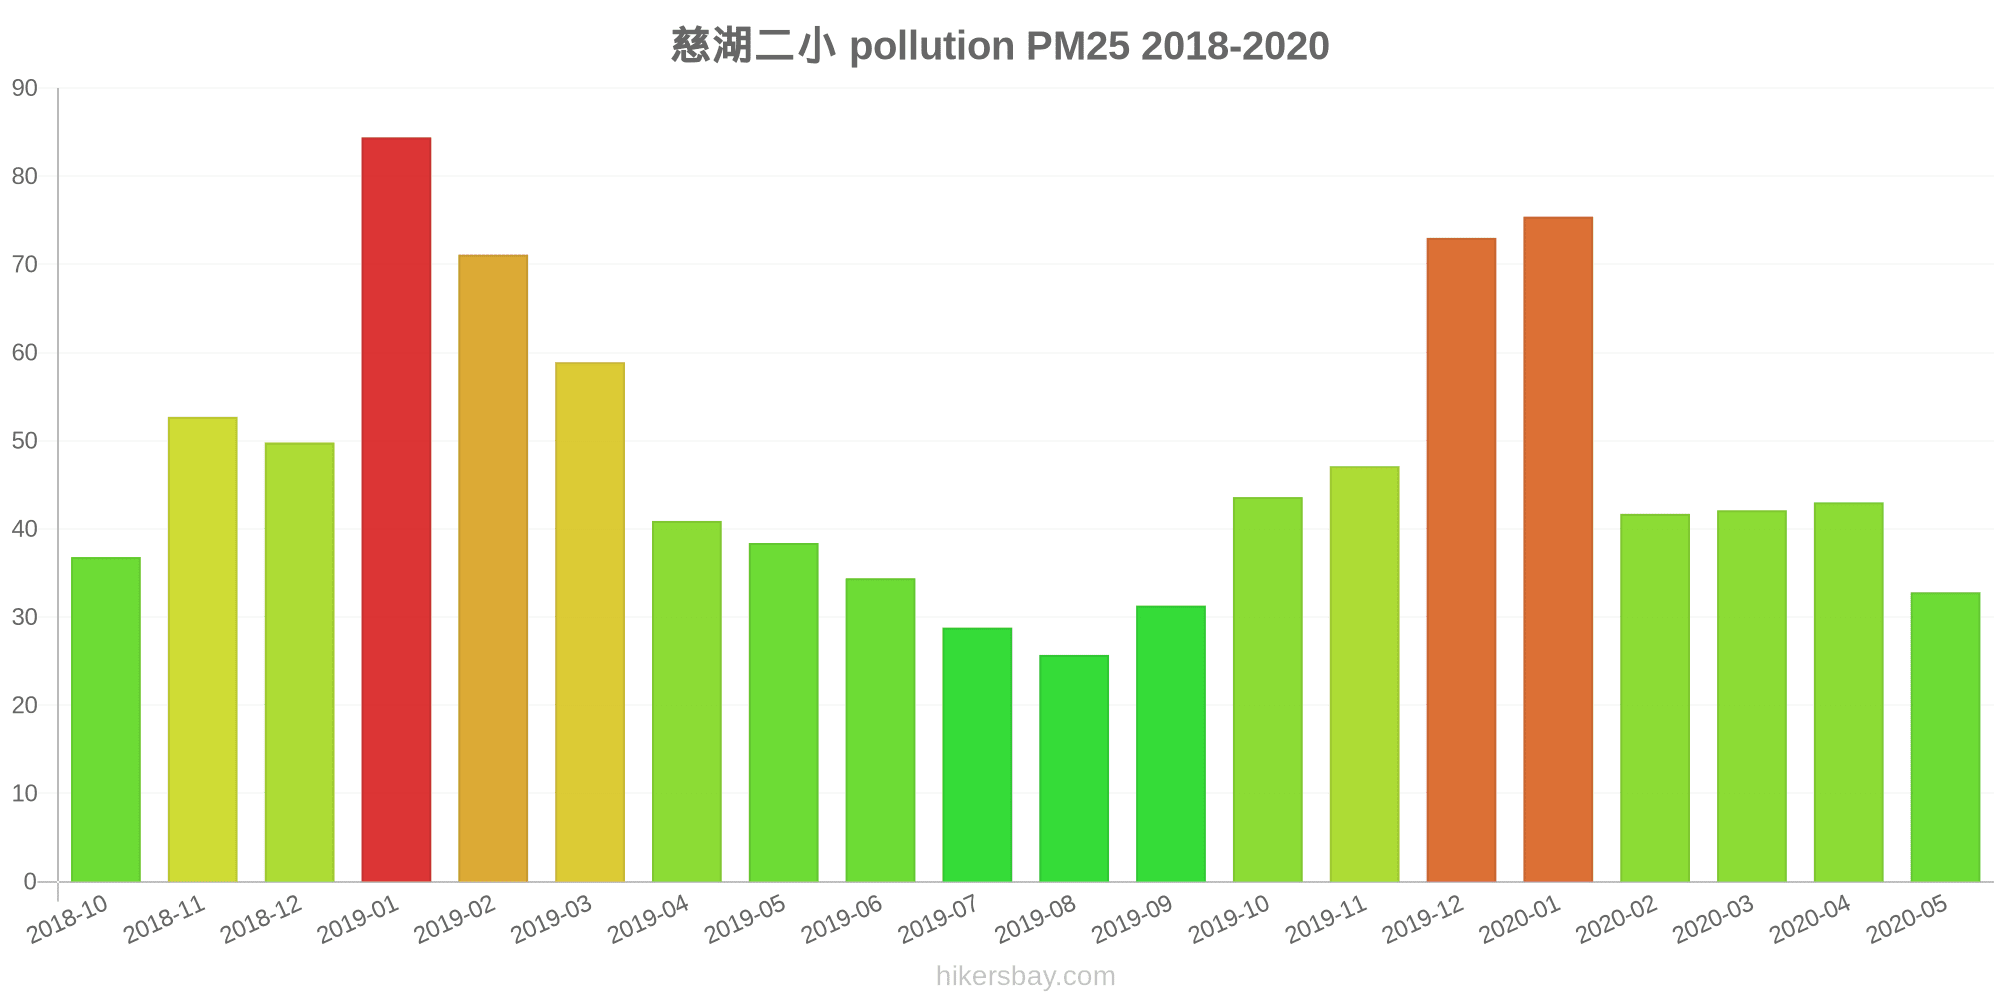
慈湖二小
2018-10 2020-05

index
2020-05
2020-04
2020-03
2020-02
2020-01
2019-12
2019-11
2019-10
2019-09
2019-08
2019-07
2019-06
2019-05
2019-04
2019-03
2019-02
2019-01
2018-12
2018-11
2018-10
pm25
33
43
42
42
75
73
47
44
31
26
29
34
38
41
59
71
84
50
53
37
co
749
700
716
689
923
923
840
871
792
709
724
875
769
813
867
988
1
973
1
985
no2
24
40
34
23
39
53
48
43
28
24
27
27
35
36
44
34
54
46
47
43
o3
144
123
100
86
62
67
94
113
163
158
150
181
157
130
112
82
61
52
92
113
pm10
61
78
66
50
77
83
87
90
57
48
50
56
75
71
94
83
106
76
81
72
so2
12
15
12
8.4
10
14
15
14
12
12
9.6
12
14
13
15
9
13
12
14
16
* Pollution data source:
https://openaq.org
(ChinaAQIData)
The data is licensed under CC-By 4.0
PM10 7 (Good)
PM2,5 2 (Good)
CO 100 (Good)
NO2 8 (Good)
O3 0 (Good)
SO2 9 (Good)
Data on air pollution from recent days in Zhaomingcun
| index | 2022-05-27 |
|---|---|
| pm10 | 32 Moderate |
| pm25 | 24 Moderate |
| co | 468 Good |
| no2 | 21 Good |
| o3 | 32 Good |
| so2 | 5 Good |

| index | 2020-05 | 2020-04 | 2020-03 | 2020-02 | 2020-01 | 2019-12 | 2019-11 | 2019-10 | 2019-09 | 2019-08 | 2019-07 | 2019-06 | 2019-05 | 2019-04 | 2019-03 | 2019-02 | 2019-01 | 2018-12 | 2018-11 | 2018-10 |
|---|---|---|---|---|---|---|---|---|---|---|---|---|---|---|---|---|---|---|---|---|
| pm25 | 33 (Moderate) | 43 (Unhealthy for Sensitive Groups) | 42 (Unhealthy for Sensitive Groups) | 42 (Unhealthy for Sensitive Groups) | 75 (Very Unhealthy) | 73 (Unhealthy) | 47 (Unhealthy for Sensitive Groups) | 44 (Unhealthy for Sensitive Groups) | 31 (Moderate) | 26 (Moderate) | 29 (Moderate) | 34 (Moderate) | 38 (Unhealthy for Sensitive Groups) | 41 (Unhealthy for Sensitive Groups) | 59 (Unhealthy) | 71 (Unhealthy) | 84 (Very Unhealthy) | 50 (Unhealthy for Sensitive Groups) | 53 (Unhealthy for Sensitive Groups) | 37 (Unhealthy for Sensitive Groups) |
| co | 749 (Good) | 700 (Good) | 716 (Good) | 689 (Good) | 923 (Good) | 923 (Good) | 840 (Good) | 871 (Good) | 792 (Good) | 709 (Good) | 724 (Good) | 875 (Good) | 769 (Good) | 813 (Good) | 867 (Good) | 988 (Good) | 1 (Good) | 973 (Good) | 1 (Good) | 985 (Good) |
| no2 | 24 (Good) | 40 (Good) | 34 (Good) | 23 (Good) | 39 (Good) | 53 (Moderate) | 48 (Moderate) | 43 (Moderate) | 28 (Good) | 24 (Good) | 27 (Good) | 27 (Good) | 35 (Good) | 36 (Good) | 44 (Moderate) | 34 (Good) | 54 (Moderate) | 46 (Moderate) | 47 (Moderate) | 43 (Moderate) |
| o3 | 144 (Unhealthy for Sensitive Groups) | 123 (Unhealthy for Sensitive Groups) | 100 (Moderate) | 86 (Moderate) | 62 (Good) | 67 (Good) | 94 (Moderate) | 113 (Moderate) | 163 (Unhealthy) | 158 (Unhealthy) | 150 (Unhealthy) | 181 (Very Unhealthy) | 157 (Unhealthy) | 130 (Unhealthy for Sensitive Groups) | 112 (Moderate) | 82 (Moderate) | 61 (Good) | 52 (Good) | 92 (Moderate) | 113 (Moderate) |
| pm10 | 61 (Unhealthy for Sensitive Groups) | 78 (Unhealthy for Sensitive Groups) | 66 (Unhealthy for Sensitive Groups) | 50 (Moderate) | 77 (Unhealthy for Sensitive Groups) | 83 (Unhealthy) | 87 (Unhealthy) | 90 (Unhealthy) | 57 (Unhealthy for Sensitive Groups) | 48 (Moderate) | 50 (Unhealthy for Sensitive Groups) | 56 (Unhealthy for Sensitive Groups) | 75 (Unhealthy for Sensitive Groups) | 71 (Unhealthy for Sensitive Groups) | 94 (Unhealthy) | 83 (Unhealthy) | 106 (Unhealthy) | 76 (Unhealthy for Sensitive Groups) | 81 (Unhealthy) | 72 (Unhealthy for Sensitive Groups) |
| so2 | 12 (Good) | 15 (Good) | 12 (Good) | 8.4 (Good) | 10 (Good) | 14 (Good) | 15 (Good) | 14 (Good) | 12 (Good) | 12 (Good) | 9.6 (Good) | 12 (Good) | 14 (Good) | 13 (Good) | 15 (Good) | 9 (Good) | 13 (Good) | 12 (Good) | 14 (Good) | 16 (Good) |
PM10 6.7 (Good)
particulate matter (PM10) suspended dustPM2,5 1.7 (Good)
particulate matter (PM2.5) dustCO 100 (Good)
carbon monoxide (CO)NO2 7.6 (Good)
nitrogen dioxide (NO2)O3 0.02 (Good)
ozone (O3)SO2 8.6 (Good)
sulfur dioxide (SO2)Ma'anshan Ci Hu Er Xiao
| index | 2022-05-27 |
|---|---|
| pm10 | 32 |
| pm25 | 24 |
| co | 468 |
| no2 | 21 |
| o3 | 32 |
| so2 | 4.6 |
慈湖二小
| index | 2020-05 | 2020-04 | 2020-03 | 2020-02 | 2020-01 | 2019-12 | 2019-11 | 2019-10 | 2019-09 | 2019-08 | 2019-07 | 2019-06 | 2019-05 | 2019-04 | 2019-03 | 2019-02 | 2019-01 | 2018-12 | 2018-11 | 2018-10 |
|---|---|---|---|---|---|---|---|---|---|---|---|---|---|---|---|---|---|---|---|---|
| pm25 | 33 | 43 | 42 | 42 | 75 | 73 | 47 | 44 | 31 | 26 | 29 | 34 | 38 | 41 | 59 | 71 | 84 | 50 | 53 | 37 |
| co | 749 | 700 | 716 | 689 | 923 | 923 | 840 | 871 | 792 | 709 | 724 | 875 | 769 | 813 | 867 | 988 | 1 | 973 | 1 | 985 |
| no2 | 24 | 40 | 34 | 23 | 39 | 53 | 48 | 43 | 28 | 24 | 27 | 27 | 35 | 36 | 44 | 34 | 54 | 46 | 47 | 43 |
| o3 | 144 | 123 | 100 | 86 | 62 | 67 | 94 | 113 | 163 | 158 | 150 | 181 | 157 | 130 | 112 | 82 | 61 | 52 | 92 | 113 |
| pm10 | 61 | 78 | 66 | 50 | 77 | 83 | 87 | 90 | 57 | 48 | 50 | 56 | 75 | 71 | 94 | 83 | 106 | 76 | 81 | 72 |
| so2 | 12 | 15 | 12 | 8.4 | 10 | 14 | 15 | 14 | 12 | 12 | 9.6 | 12 | 14 | 13 | 15 | 9 | 13 | 12 | 14 | 16 |