Air Pollution in Guanjiatun: Real-time Air Quality Index and smog alert.
Pollution and air quality forecast for Guanjiatun. Today is Tuesday, June 16, 2026. The following air pollution values have been recorded for Guanjiatun:- particulate matter (PM10) suspended dust - 7 (Good)
- particulate matter (PM2.5) dust - 2 (Good)
- carbon monoxide (CO) - 100 (Good)
- nitrogen dioxide (NO2) - 8 (Good)
- ozone (O3) - 0 (Good)
- sulfur dioxide (SO2) - 9 (Good)

What is the air quality in Guanjiatun today? Is the air polluted in Guanjiatun?. Is there smog?
What is the level of PM10 today in Guanjiatun? (particulate matter (PM10) suspended dust)
The current level of particulate matter PM10 in Guanjiatun is:
7 (Good)
The highest PM10 values usually occur in month: 120 (January 2020).
The lowest value of particulate matter PM10 pollution in Guanjiatun is usually recorded in: August (31).
What is the current level of PM2.5 in Guanjiatun? (particulate matter (PM2.5) dust)
Today's PM2.5 level is:
2 (Good)
For comparison, the highest level of PM2.5 in Guanjiatun in the last 7 days was: 24 (Friday, May 27, 2022) and the lowest: 24 (Friday, May 27, 2022).
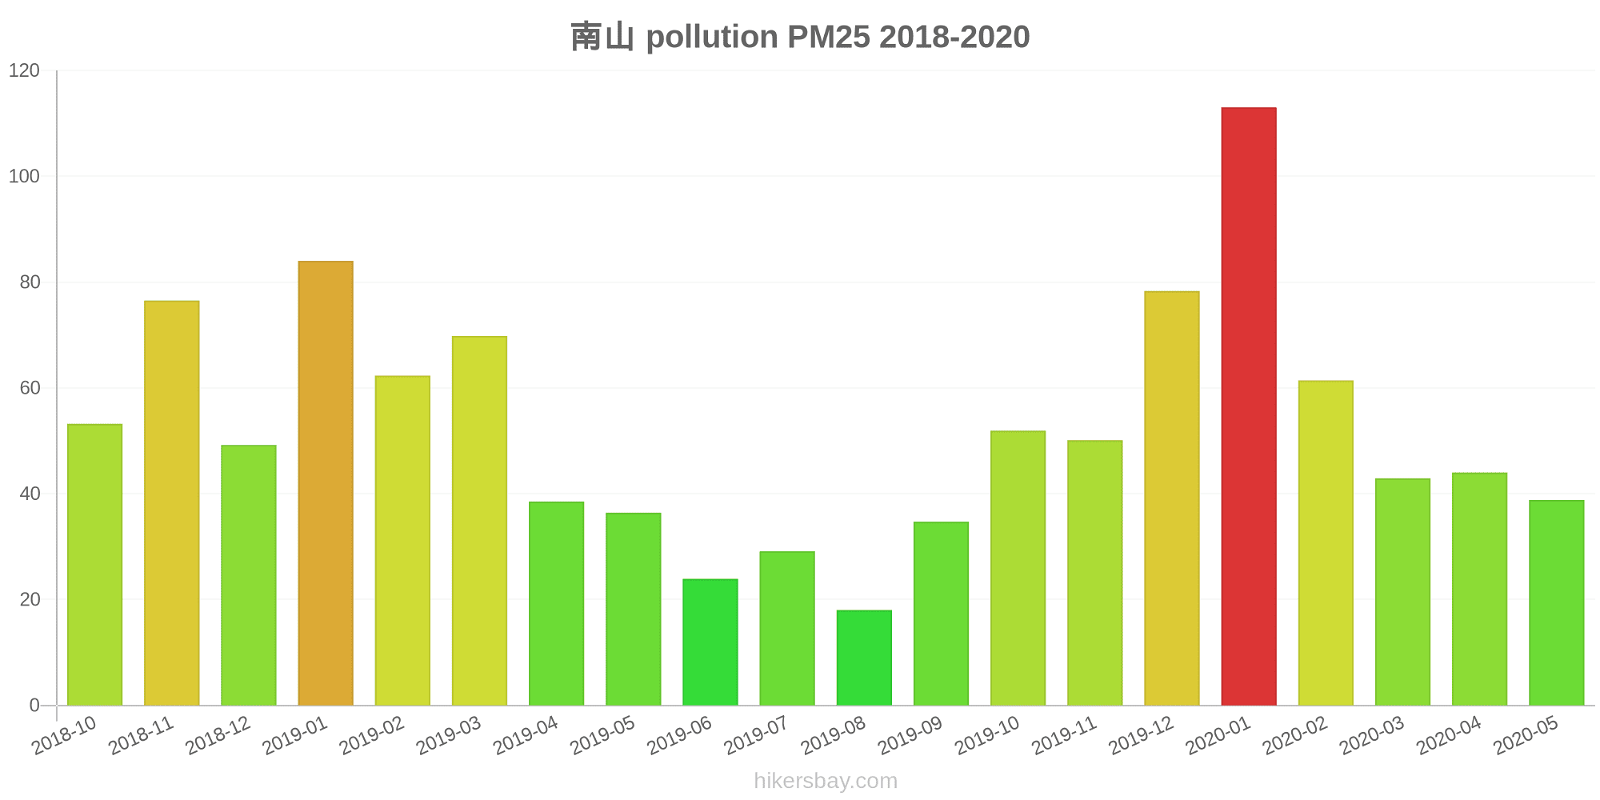
The highest PM2.5 values were recorded: 113 (January 2020).
The lowest level of particulate matter PM2.5 pollution occurs in month: August (18).
How high is the CO level? (carbon monoxide (CO))
100 (Good)
How high is the level of NO2? (nitrogen dioxide (NO2))
8 (Good)
How is the O3 level today in Guanjiatun? (ozone (O3))
0 (Good)
What is the level of SO2 pollution? (sulfur dioxide (SO2))
9 (Good)
Current data Friday, May 27, 2022, 12:00 PM
PM10 7 (Good)
PM2,5 2 (Good)
CO 100 (Good)
NO2 8 (Good)
O3 0 (Good)
SO2 9 (Good)
Data on air pollution from recent days in Guanjiatun
index
2022-05-27
pm10
32
Moderate
pm25
24
Moderate
co
468
Good
no2
21
Good
o3
32
Good
so2
5
Good
data source »
Air pollution in Guanjiatun from October 2018 to May 2020

index
2020-05
2020-04
2020-03
2020-02
2020-01
2019-12
2019-11
2019-10
2019-09
2019-08
2019-07
2019-06
2019-05
2019-04
2019-03
2019-02
2019-01
2018-12
2018-11
2018-10
pm25
39 (Unhealthy for Sensitive Groups)
44 (Unhealthy for Sensitive Groups)
43 (Unhealthy for Sensitive Groups)
61 (Unhealthy)
113 (Very bad Hazardous)
78 (Very Unhealthy)
50 (Unhealthy for Sensitive Groups)
52 (Unhealthy for Sensitive Groups)
35 (Moderate)
18 (Moderate)
29 (Moderate)
24 (Moderate)
36 (Unhealthy for Sensitive Groups)
39 (Unhealthy for Sensitive Groups)
70 (Unhealthy)
62 (Unhealthy)
84 (Very Unhealthy)
49 (Unhealthy for Sensitive Groups)
77 (Very Unhealthy)
53 (Unhealthy for Sensitive Groups)
co
705 (Good)
684 (Good)
616 (Good)
922 (Good)
1 (Good)
1 (Good)
999 (Good)
956 (Good)
866 (Good)
760 (Good)
822 (Good)
669 (Good)
641 (Good)
802 (Good)
991 (Good)
1 (Good)
1 (Good)
1 (Good)
1 (Good)
979 (Good)
no2
22 (Good)
26 (Good)
25 (Good)
22 (Good)
42 (Moderate)
41 (Moderate)
35 (Good)
32 (Good)
29 (Good)
17 (Good)
16 (Good)
19 (Good)
24 (Good)
26 (Good)
40 (Good)
37 (Good)
46 (Moderate)
33 (Good)
41 (Moderate)
27 (Good)
o3
143 (Unhealthy for Sensitive Groups)
132 (Unhealthy for Sensitive Groups)
100 (Moderate)
85 (Moderate)
75 (Moderate)
58 (Good)
56 (Good)
96 (Moderate)
143 (Unhealthy for Sensitive Groups)
118 (Moderate)
163 (Unhealthy)
154 (Unhealthy)
159 (Unhealthy)
121 (Unhealthy for Sensitive Groups)
104 (Moderate)
83 (Moderate)
67 (Good)
66 (Good)
72 (Moderate)
90 (Moderate)
pm10
57 (Unhealthy for Sensitive Groups)
76 (Unhealthy for Sensitive Groups)
61 (Unhealthy for Sensitive Groups)
67 (Unhealthy for Sensitive Groups)
120 (Very Unhealthy)
86 (Unhealthy)
68 (Unhealthy for Sensitive Groups)
67 (Unhealthy for Sensitive Groups)
53 (Unhealthy for Sensitive Groups)
31 (Moderate)
45 (Moderate)
40 (Moderate)
71 (Unhealthy for Sensitive Groups)
87 (Unhealthy)
104 (Unhealthy)
79 (Unhealthy for Sensitive Groups)
119 (Very Unhealthy)
78 (Unhealthy for Sensitive Groups)
113 (Very Unhealthy)
74 (Unhealthy for Sensitive Groups)
so2
22 (Good)
18 (Good)
24 (Good)
25 (Good)
41 (Good)
46 (Good)
30 (Good)
16 (Good)
16 (Good)
13 (Good)
11 (Good)
15 (Good)
22 (Good)
20 (Good)
31 (Good)
39 (Good)
48 (Good)
39 (Good)
35 (Good)
18 (Good)
data source »
南山
Friday, May 27, 2022, 12:00 PM
PM10 6.7 (Good)
particulate matter (PM10) suspended dust
PM2,5 1.7 (Good)
particulate matter (PM2.5) dust
CO 100 (Good)
carbon monoxide (CO)
NO2 7.6 (Good)
nitrogen dioxide (NO2)
O3 0.02 (Good)
ozone (O3)
SO2 8.6 (Good)
sulfur dioxide (SO2)
南山
index
2022-05-27
pm10
32
pm25
24
co
468
no2
21
o3
32
so2
4.6
南山
2018-10 2020-05
index
2020-05
2020-04
2020-03
2020-02
2020-01
2019-12
2019-11
2019-10
2019-09
2019-08
2019-07
2019-06
2019-05
2019-04
2019-03
2019-02
2019-01
2018-12
2018-11
2018-10
pm25
39
44
43
61
113
78
50
52
35
18
29
24
36
39
70
62
84
49
77
53
co
705
684
616
922
1
1
999
956
866
760
822
669
641
802
991
1
1
1
1
979
no2
22
26
25
22
42
41
35
32
29
17
16
19
24
26
40
37
46
33
41
27
o3
143
132
100
85
75
58
56
96
143
118
163
154
159
121
104
83
67
66
72
90
pm10
57
76
61
67
120
86
68
67
53
31
45
40
71
87
104
79
119
78
113
74
so2
22
18
24
25
41
46
30
16
16
13
11
15
22
20
31
39
48
39
35
18
* Pollution data source:
https://openaq.org
(ChinaAQIData)
The data is licensed under CC-By 4.0
PM10 7 (Good)
PM2,5 2 (Good)
CO 100 (Good)
NO2 8 (Good)
O3 0 (Good)
SO2 9 (Good)
Data on air pollution from recent days in Guanjiatun
| index | 2022-05-27 |
|---|---|
| pm10 | 32 Moderate |
| pm25 | 24 Moderate |
| co | 468 Good |
| no2 | 21 Good |
| o3 | 32 Good |
| so2 | 5 Good |

| index | 2020-05 | 2020-04 | 2020-03 | 2020-02 | 2020-01 | 2019-12 | 2019-11 | 2019-10 | 2019-09 | 2019-08 | 2019-07 | 2019-06 | 2019-05 | 2019-04 | 2019-03 | 2019-02 | 2019-01 | 2018-12 | 2018-11 | 2018-10 |
|---|---|---|---|---|---|---|---|---|---|---|---|---|---|---|---|---|---|---|---|---|
| pm25 | 39 (Unhealthy for Sensitive Groups) | 44 (Unhealthy for Sensitive Groups) | 43 (Unhealthy for Sensitive Groups) | 61 (Unhealthy) | 113 (Very bad Hazardous) | 78 (Very Unhealthy) | 50 (Unhealthy for Sensitive Groups) | 52 (Unhealthy for Sensitive Groups) | 35 (Moderate) | 18 (Moderate) | 29 (Moderate) | 24 (Moderate) | 36 (Unhealthy for Sensitive Groups) | 39 (Unhealthy for Sensitive Groups) | 70 (Unhealthy) | 62 (Unhealthy) | 84 (Very Unhealthy) | 49 (Unhealthy for Sensitive Groups) | 77 (Very Unhealthy) | 53 (Unhealthy for Sensitive Groups) |
| co | 705 (Good) | 684 (Good) | 616 (Good) | 922 (Good) | 1 (Good) | 1 (Good) | 999 (Good) | 956 (Good) | 866 (Good) | 760 (Good) | 822 (Good) | 669 (Good) | 641 (Good) | 802 (Good) | 991 (Good) | 1 (Good) | 1 (Good) | 1 (Good) | 1 (Good) | 979 (Good) |
| no2 | 22 (Good) | 26 (Good) | 25 (Good) | 22 (Good) | 42 (Moderate) | 41 (Moderate) | 35 (Good) | 32 (Good) | 29 (Good) | 17 (Good) | 16 (Good) | 19 (Good) | 24 (Good) | 26 (Good) | 40 (Good) | 37 (Good) | 46 (Moderate) | 33 (Good) | 41 (Moderate) | 27 (Good) |
| o3 | 143 (Unhealthy for Sensitive Groups) | 132 (Unhealthy for Sensitive Groups) | 100 (Moderate) | 85 (Moderate) | 75 (Moderate) | 58 (Good) | 56 (Good) | 96 (Moderate) | 143 (Unhealthy for Sensitive Groups) | 118 (Moderate) | 163 (Unhealthy) | 154 (Unhealthy) | 159 (Unhealthy) | 121 (Unhealthy for Sensitive Groups) | 104 (Moderate) | 83 (Moderate) | 67 (Good) | 66 (Good) | 72 (Moderate) | 90 (Moderate) |
| pm10 | 57 (Unhealthy for Sensitive Groups) | 76 (Unhealthy for Sensitive Groups) | 61 (Unhealthy for Sensitive Groups) | 67 (Unhealthy for Sensitive Groups) | 120 (Very Unhealthy) | 86 (Unhealthy) | 68 (Unhealthy for Sensitive Groups) | 67 (Unhealthy for Sensitive Groups) | 53 (Unhealthy for Sensitive Groups) | 31 (Moderate) | 45 (Moderate) | 40 (Moderate) | 71 (Unhealthy for Sensitive Groups) | 87 (Unhealthy) | 104 (Unhealthy) | 79 (Unhealthy for Sensitive Groups) | 119 (Very Unhealthy) | 78 (Unhealthy for Sensitive Groups) | 113 (Very Unhealthy) | 74 (Unhealthy for Sensitive Groups) |
| so2 | 22 (Good) | 18 (Good) | 24 (Good) | 25 (Good) | 41 (Good) | 46 (Good) | 30 (Good) | 16 (Good) | 16 (Good) | 13 (Good) | 11 (Good) | 15 (Good) | 22 (Good) | 20 (Good) | 31 (Good) | 39 (Good) | 48 (Good) | 39 (Good) | 35 (Good) | 18 (Good) |
PM10 6.7 (Good)
particulate matter (PM10) suspended dustPM2,5 1.7 (Good)
particulate matter (PM2.5) dustCO 100 (Good)
carbon monoxide (CO)NO2 7.6 (Good)
nitrogen dioxide (NO2)O3 0.02 (Good)
ozone (O3)SO2 8.6 (Good)
sulfur dioxide (SO2)南山
| index | 2022-05-27 |
|---|---|
| pm10 | 32 |
| pm25 | 24 |
| co | 468 |
| no2 | 21 |
| o3 | 32 |
| so2 | 4.6 |
南山

| index | 2020-05 | 2020-04 | 2020-03 | 2020-02 | 2020-01 | 2019-12 | 2019-11 | 2019-10 | 2019-09 | 2019-08 | 2019-07 | 2019-06 | 2019-05 | 2019-04 | 2019-03 | 2019-02 | 2019-01 | 2018-12 | 2018-11 | 2018-10 |
|---|---|---|---|---|---|---|---|---|---|---|---|---|---|---|---|---|---|---|---|---|
| pm25 | 39 | 44 | 43 | 61 | 113 | 78 | 50 | 52 | 35 | 18 | 29 | 24 | 36 | 39 | 70 | 62 | 84 | 49 | 77 | 53 |
| co | 705 | 684 | 616 | 922 | 1 | 1 | 999 | 956 | 866 | 760 | 822 | 669 | 641 | 802 | 991 | 1 | 1 | 1 | 1 | 979 |
| no2 | 22 | 26 | 25 | 22 | 42 | 41 | 35 | 32 | 29 | 17 | 16 | 19 | 24 | 26 | 40 | 37 | 46 | 33 | 41 | 27 |
| o3 | 143 | 132 | 100 | 85 | 75 | 58 | 56 | 96 | 143 | 118 | 163 | 154 | 159 | 121 | 104 | 83 | 67 | 66 | 72 | 90 |
| pm10 | 57 | 76 | 61 | 67 | 120 | 86 | 68 | 67 | 53 | 31 | 45 | 40 | 71 | 87 | 104 | 79 | 119 | 78 | 113 | 74 |
| so2 | 22 | 18 | 24 | 25 | 41 | 46 | 30 | 16 | 16 | 13 | 11 | 15 | 22 | 20 | 31 | 39 | 48 | 39 | 35 | 18 |