Air Pollution in Yingchengzicun: Real-time Air Quality Index and smog alert.
Pollution and air quality forecast for Yingchengzicun. Today is Tuesday, June 16, 2026. The following air pollution values have been recorded for Yingchengzicun:- particulate matter (PM10) suspended dust - 7 (Good)
- particulate matter (PM2.5) dust - 2 (Good)
- carbon monoxide (CO) - 100 (Good)
- nitrogen dioxide (NO2) - 8 (Good)
- ozone (O3) - 0 (Good)
- sulfur dioxide (SO2) - 9 (Good)

What is the air quality in Yingchengzicun today? Is the air polluted in Yingchengzicun?. Is there smog?
What is the level of PM10 today in Yingchengzicun? (particulate matter (PM10) suspended dust)
The current level of particulate matter PM10 in Yingchengzicun is:
7 (Good)
The highest PM10 values usually occur in month: 134 (January 2020).
The lowest value of particulate matter PM10 pollution in Yingchengzicun is usually recorded in: August (33).
What is the current level of PM2.5 in Yingchengzicun? (particulate matter (PM2.5) dust)
Today's PM2.5 level is:
2 (Good)
For comparison, the highest level of PM2.5 in Yingchengzicun in the last 7 days was: 24 (Friday, May 27, 2022) and the lowest: 24 (Friday, May 27, 2022).
The highest PM2.5 values were recorded: 102 (January 2020).
The lowest level of particulate matter PM2.5 pollution occurs in month: August (19).
How high is the CO level? (carbon monoxide (CO))
100 (Good)
How high is the level of NO2? (nitrogen dioxide (NO2))
8 (Good)
How is the O3 level today in Yingchengzicun? (ozone (O3))
0 (Good)
What is the level of SO2 pollution? (sulfur dioxide (SO2))
9 (Good)
Current data Friday, May 27, 2022, 12:00 PM
PM10 7 (Good)
PM2,5 2 (Good)
CO 100 (Good)
NO2 8 (Good)
O3 0 (Good)
SO2 9 (Good)
Data on air pollution from recent days in Yingchengzicun
index
2022-05-27
pm10
32
Moderate
pm25
24
Moderate
co
468
Good
no2
21
Good
o3
32
Good
so2
5
Good
data source »
Air pollution in Yingchengzicun from October 2018 to May 2020

index
2020-05
2020-04
2020-03
2020-02
2020-01
2019-12
2019-11
2019-10
2019-09
2019-08
2019-07
2019-06
2019-05
2019-04
2019-03
2019-02
2019-01
2018-12
2018-11
2018-10
pm25
29 (Moderate)
44 (Unhealthy for Sensitive Groups)
37 (Unhealthy for Sensitive Groups)
48 (Unhealthy for Sensitive Groups)
102 (Very Unhealthy)
49 (Unhealthy for Sensitive Groups)
31 (Moderate)
41 (Unhealthy for Sensitive Groups)
28 (Moderate)
19 (Moderate)
28 (Moderate)
26 (Moderate)
24 (Moderate)
35 (Moderate)
50 (Unhealthy for Sensitive Groups)
63 (Unhealthy)
57 (Unhealthy)
30 (Moderate)
43 (Unhealthy for Sensitive Groups)
35 (Unhealthy for Sensitive Groups)
co
459 (Good)
469 (Good)
449 (Good)
1 (Good)
1 (Good)
1 (Good)
500 (Good)
489 (Good)
980 (Good)
911 (Good)
936 (Good)
765 (Good)
850 (Good)
929 (Good)
1 (Good)
1 (Good)
1 (Good)
440 (Good)
1 (Good)
491 (Good)
no2
24 (Good)
26 (Good)
26 (Good)
26 (Good)
50 (Moderate)
37 (Good)
38 (Good)
32 (Good)
26 (Good)
20 (Good)
19 (Good)
23 (Good)
22 (Good)
28 (Good)
35 (Good)
39 (Good)
47 (Moderate)
33 (Good)
41 (Moderate)
35 (Good)
o3
130 (Unhealthy for Sensitive Groups)
133 (Unhealthy for Sensitive Groups)
106 (Moderate)
86 (Moderate)
69 (Good)
63 (Good)
63 (Good)
102 (Moderate)
127 (Unhealthy for Sensitive Groups)
112 (Moderate)
174 (Unhealthy)
155 (Unhealthy)
151 (Unhealthy)
122 (Unhealthy for Sensitive Groups)
108 (Moderate)
84 (Moderate)
63 (Good)
52 (Good)
63 (Good)
79 (Moderate)
pm10
59 (Unhealthy for Sensitive Groups)
93 (Unhealthy)
67 (Unhealthy for Sensitive Groups)
75 (Unhealthy for Sensitive Groups)
134 (Very Unhealthy)
75 (Unhealthy for Sensitive Groups)
58 (Unhealthy for Sensitive Groups)
72 (Unhealthy for Sensitive Groups)
52 (Unhealthy for Sensitive Groups)
33 (Moderate)
46 (Moderate)
44 (Moderate)
59 (Unhealthy for Sensitive Groups)
83 (Unhealthy)
89 (Unhealthy)
96 (Unhealthy)
99 (Unhealthy)
55 (Unhealthy for Sensitive Groups)
70 (Unhealthy for Sensitive Groups)
63 (Unhealthy for Sensitive Groups)
so2
11 (Good)
17 (Good)
15 (Good)
14 (Good)
25 (Good)
17 (Good)
20 (Good)
14 (Good)
11 (Good)
6 (Good)
7.3 (Good)
8.7 (Good)
12 (Good)
15 (Good)
21 (Good)
28 (Good)
29 (Good)
23 (Good)
21 (Good)
18 (Good)
data source »
太阳城
Friday, May 27, 2022, 12:00 PM
PM10 6.7 (Good)
particulate matter (PM10) suspended dust
PM2,5 1.7 (Good)
particulate matter (PM2.5) dust
CO 100 (Good)
carbon monoxide (CO)
NO2 7.6 (Good)
nitrogen dioxide (NO2)
O3 0.02 (Good)
ozone (O3)
SO2 8.6 (Good)
sulfur dioxide (SO2)
明达新区
Friday, May 27, 2022, 12:00 PM
PM10 6.7 (Good)
particulate matter (PM10) suspended dust
PM2,5 1.7 (Good)
particulate matter (PM2.5) dust
CO 100 (Good)
carbon monoxide (CO)
NO2 7.6 (Good)
nitrogen dioxide (NO2)
O3 0.02 (Good)
ozone (O3)
SO2 8.6 (Good)
sulfur dioxide (SO2)
太阳城
index
2022-05-27
pm10
32
pm25
24
co
468
no2
21
o3
32
so2
4.6
明达新区
index
2022-05-27
pm10
32
pm25
24
co
468
no2
21
o3
32
so2
4.6
太阳城
2018-10 2020-05
index
2020-05
2020-04
2020-03
2020-02
2020-01
2019-12
2019-11
2019-10
2019-09
2019-08
2019-07
2019-06
2019-05
2019-04
2019-03
2019-02
2019-01
2018-12
2018-11
2018-10
pm25
29
45
39
50
106
50
30
39
29
20
29
27
24
35
50
62
60
30
43
35
co
1
1
1
1
1
1
999
977
962
985
992
822
865
984
1
1
1
879
1
1
no2
25
28
29
29
51
38
39
34
27
21
22
26
25
29
36
40
48
34
42
36
o3
131
132
103
86
70
65
63
102
127
110
176
154
150
123
105
84
55
55
66
82
pm10
58
98
71
79
138
79
58
73
52
33
47
44
59
84
90
97
101
55
67
59
so2
11
18
15
14
26
17
20
14
11
6.3
6.5
7.6
11
12
18
26
28
22
19
15
明达新区
2018-10 2020-05
index
2020-05
2020-04
2020-03
2020-02
2020-01
2019-12
2019-11
2019-10
2019-09
2019-08
2019-07
2019-06
2019-05
2019-04
2019-03
2019-02
2019-01
2018-12
2018-11
2018-10
pm25
29
42
36
46
99
49
32
43
28
19
27
26
23
35
49
63
55
29
43
35
co
916
936
897
1
1
1
1
1
998
836
880
708
835
873
1
1
1
1
1
981
no2
24
25
23
24
50
35
38
31
25
18
16
20
20
26
35
38
46
32
41
34
o3
129
133
108
86
68
62
63
101
127
114
172
155
152
121
110
83
71
49
60
75
pm10
60
87
63
71
129
72
59
72
51
33
45
43
59
81
88
95
98
55
72
67
so2
11
16
14
14
24
17
21
15
9.9
5.8
8
9.9
14
17
23
30
30
24
22
21
* Pollution data source:
https://openaq.org
(ChinaAQIData)
The data is licensed under CC-By 4.0
PM10 7 (Good)
PM2,5 2 (Good)
CO 100 (Good)
NO2 8 (Good)
O3 0 (Good)
SO2 9 (Good)
Data on air pollution from recent days in Yingchengzicun
| index | 2022-05-27 |
|---|---|
| pm10 | 32 Moderate |
| pm25 | 24 Moderate |
| co | 468 Good |
| no2 | 21 Good |
| o3 | 32 Good |
| so2 | 5 Good |
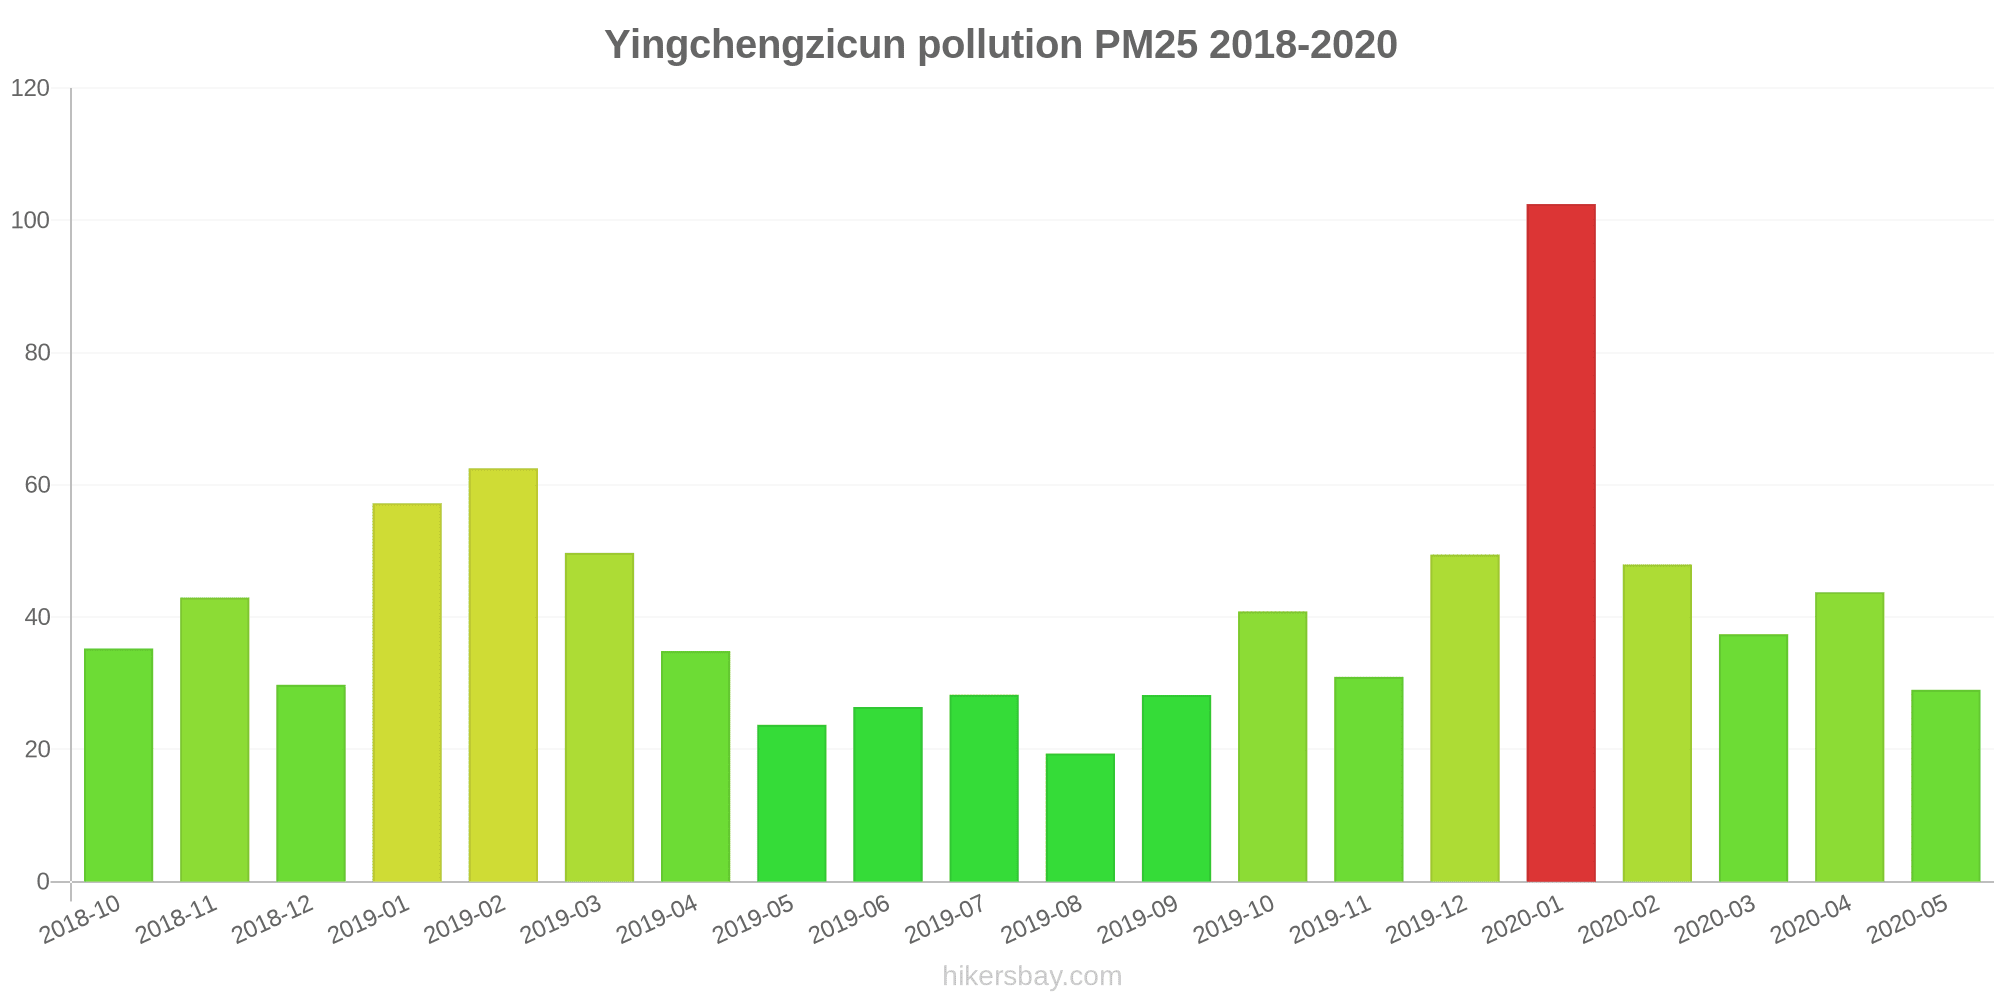
| index | 2020-05 | 2020-04 | 2020-03 | 2020-02 | 2020-01 | 2019-12 | 2019-11 | 2019-10 | 2019-09 | 2019-08 | 2019-07 | 2019-06 | 2019-05 | 2019-04 | 2019-03 | 2019-02 | 2019-01 | 2018-12 | 2018-11 | 2018-10 |
|---|---|---|---|---|---|---|---|---|---|---|---|---|---|---|---|---|---|---|---|---|
| pm25 | 29 (Moderate) | 44 (Unhealthy for Sensitive Groups) | 37 (Unhealthy for Sensitive Groups) | 48 (Unhealthy for Sensitive Groups) | 102 (Very Unhealthy) | 49 (Unhealthy for Sensitive Groups) | 31 (Moderate) | 41 (Unhealthy for Sensitive Groups) | 28 (Moderate) | 19 (Moderate) | 28 (Moderate) | 26 (Moderate) | 24 (Moderate) | 35 (Moderate) | 50 (Unhealthy for Sensitive Groups) | 63 (Unhealthy) | 57 (Unhealthy) | 30 (Moderate) | 43 (Unhealthy for Sensitive Groups) | 35 (Unhealthy for Sensitive Groups) |
| co | 459 (Good) | 469 (Good) | 449 (Good) | 1 (Good) | 1 (Good) | 1 (Good) | 500 (Good) | 489 (Good) | 980 (Good) | 911 (Good) | 936 (Good) | 765 (Good) | 850 (Good) | 929 (Good) | 1 (Good) | 1 (Good) | 1 (Good) | 440 (Good) | 1 (Good) | 491 (Good) |
| no2 | 24 (Good) | 26 (Good) | 26 (Good) | 26 (Good) | 50 (Moderate) | 37 (Good) | 38 (Good) | 32 (Good) | 26 (Good) | 20 (Good) | 19 (Good) | 23 (Good) | 22 (Good) | 28 (Good) | 35 (Good) | 39 (Good) | 47 (Moderate) | 33 (Good) | 41 (Moderate) | 35 (Good) |
| o3 | 130 (Unhealthy for Sensitive Groups) | 133 (Unhealthy for Sensitive Groups) | 106 (Moderate) | 86 (Moderate) | 69 (Good) | 63 (Good) | 63 (Good) | 102 (Moderate) | 127 (Unhealthy for Sensitive Groups) | 112 (Moderate) | 174 (Unhealthy) | 155 (Unhealthy) | 151 (Unhealthy) | 122 (Unhealthy for Sensitive Groups) | 108 (Moderate) | 84 (Moderate) | 63 (Good) | 52 (Good) | 63 (Good) | 79 (Moderate) |
| pm10 | 59 (Unhealthy for Sensitive Groups) | 93 (Unhealthy) | 67 (Unhealthy for Sensitive Groups) | 75 (Unhealthy for Sensitive Groups) | 134 (Very Unhealthy) | 75 (Unhealthy for Sensitive Groups) | 58 (Unhealthy for Sensitive Groups) | 72 (Unhealthy for Sensitive Groups) | 52 (Unhealthy for Sensitive Groups) | 33 (Moderate) | 46 (Moderate) | 44 (Moderate) | 59 (Unhealthy for Sensitive Groups) | 83 (Unhealthy) | 89 (Unhealthy) | 96 (Unhealthy) | 99 (Unhealthy) | 55 (Unhealthy for Sensitive Groups) | 70 (Unhealthy for Sensitive Groups) | 63 (Unhealthy for Sensitive Groups) |
| so2 | 11 (Good) | 17 (Good) | 15 (Good) | 14 (Good) | 25 (Good) | 17 (Good) | 20 (Good) | 14 (Good) | 11 (Good) | 6 (Good) | 7.3 (Good) | 8.7 (Good) | 12 (Good) | 15 (Good) | 21 (Good) | 28 (Good) | 29 (Good) | 23 (Good) | 21 (Good) | 18 (Good) |
PM10 6.7 (Good)
particulate matter (PM10) suspended dustPM2,5 1.7 (Good)
particulate matter (PM2.5) dustCO 100 (Good)
carbon monoxide (CO)NO2 7.6 (Good)
nitrogen dioxide (NO2)O3 0.02 (Good)
ozone (O3)SO2 8.6 (Good)
sulfur dioxide (SO2)PM10 6.7 (Good)
particulate matter (PM10) suspended dustPM2,5 1.7 (Good)
particulate matter (PM2.5) dustCO 100 (Good)
carbon monoxide (CO)NO2 7.6 (Good)
nitrogen dioxide (NO2)O3 0.02 (Good)
ozone (O3)SO2 8.6 (Good)
sulfur dioxide (SO2)太阳城
| index | 2022-05-27 |
|---|---|
| pm10 | 32 |
| pm25 | 24 |
| co | 468 |
| no2 | 21 |
| o3 | 32 |
| so2 | 4.6 |
明达新区
| index | 2022-05-27 |
|---|---|
| pm10 | 32 |
| pm25 | 24 |
| co | 468 |
| no2 | 21 |
| o3 | 32 |
| so2 | 4.6 |
太阳城

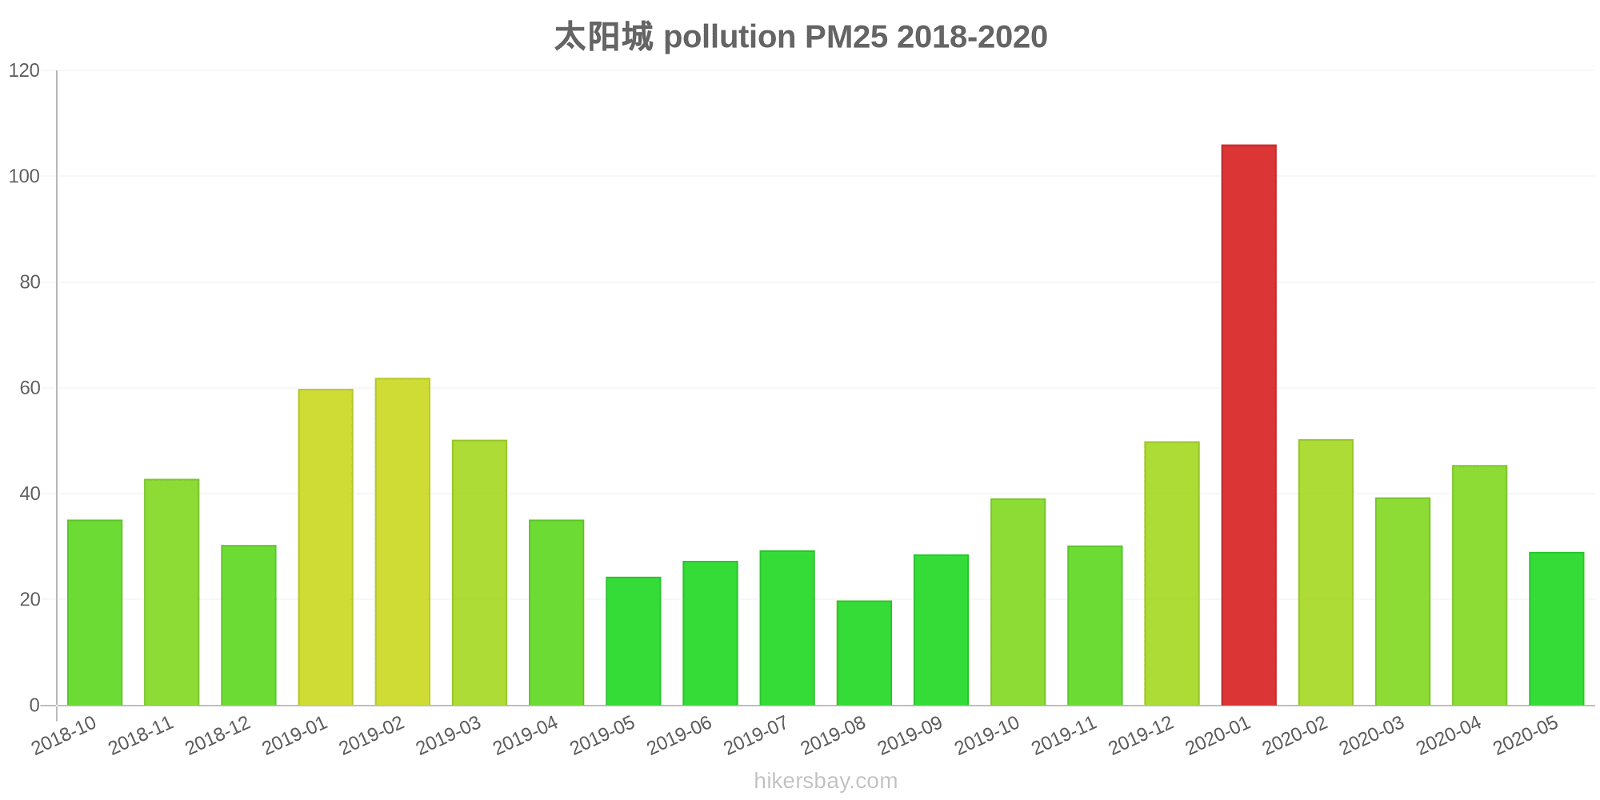
| index | 2020-05 | 2020-04 | 2020-03 | 2020-02 | 2020-01 | 2019-12 | 2019-11 | 2019-10 | 2019-09 | 2019-08 | 2019-07 | 2019-06 | 2019-05 | 2019-04 | 2019-03 | 2019-02 | 2019-01 | 2018-12 | 2018-11 | 2018-10 |
|---|---|---|---|---|---|---|---|---|---|---|---|---|---|---|---|---|---|---|---|---|
| pm25 | 29 | 45 | 39 | 50 | 106 | 50 | 30 | 39 | 29 | 20 | 29 | 27 | 24 | 35 | 50 | 62 | 60 | 30 | 43 | 35 |
| co | 1 | 1 | 1 | 1 | 1 | 1 | 999 | 977 | 962 | 985 | 992 | 822 | 865 | 984 | 1 | 1 | 1 | 879 | 1 | 1 |
| no2 | 25 | 28 | 29 | 29 | 51 | 38 | 39 | 34 | 27 | 21 | 22 | 26 | 25 | 29 | 36 | 40 | 48 | 34 | 42 | 36 |
| o3 | 131 | 132 | 103 | 86 | 70 | 65 | 63 | 102 | 127 | 110 | 176 | 154 | 150 | 123 | 105 | 84 | 55 | 55 | 66 | 82 |
| pm10 | 58 | 98 | 71 | 79 | 138 | 79 | 58 | 73 | 52 | 33 | 47 | 44 | 59 | 84 | 90 | 97 | 101 | 55 | 67 | 59 |
| so2 | 11 | 18 | 15 | 14 | 26 | 17 | 20 | 14 | 11 | 6.3 | 6.5 | 7.6 | 11 | 12 | 18 | 26 | 28 | 22 | 19 | 15 |
明达新区

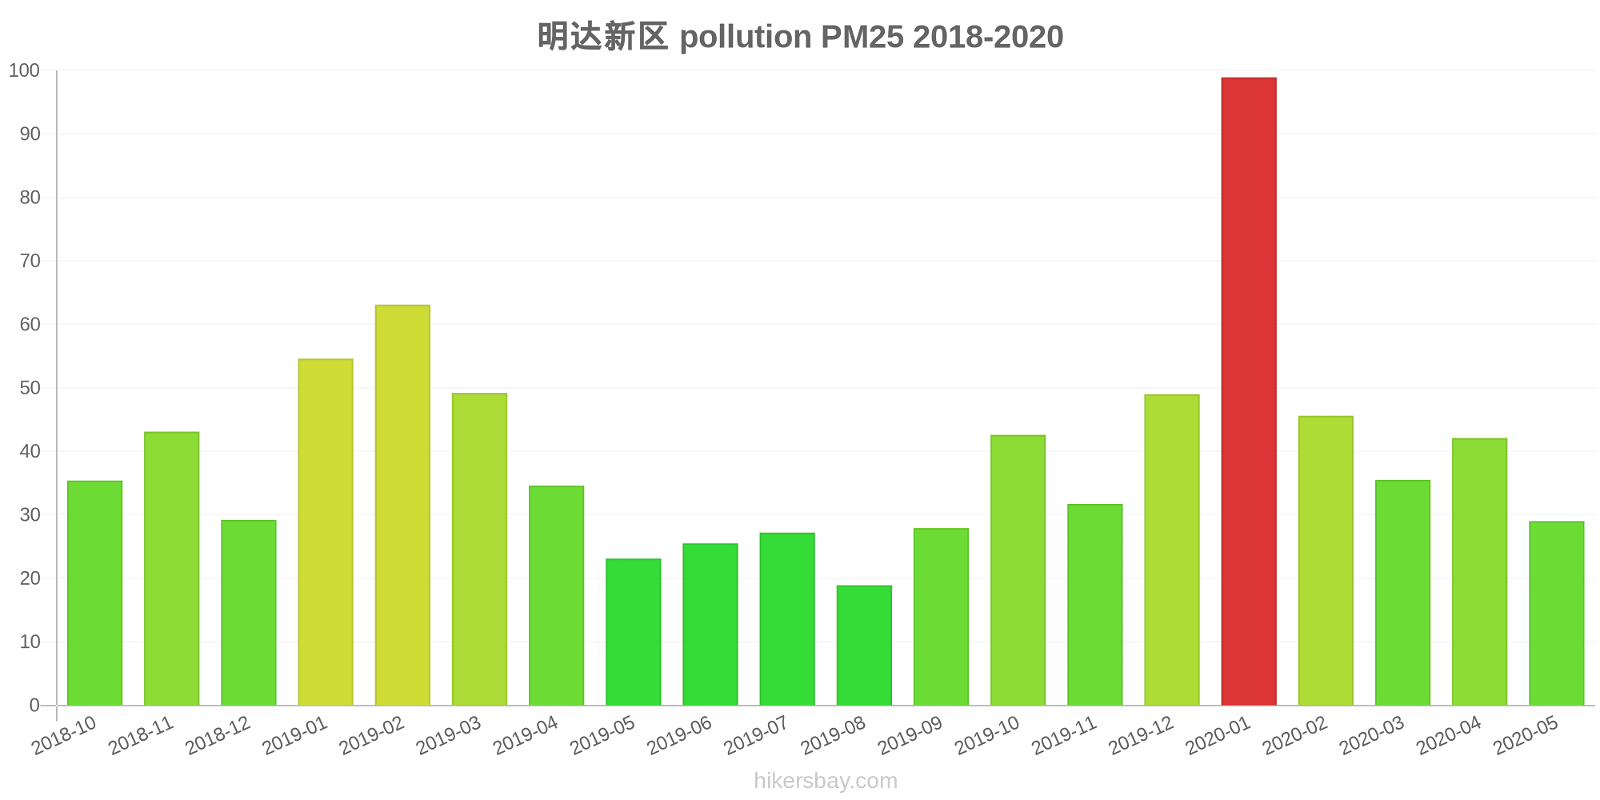
| index | 2020-05 | 2020-04 | 2020-03 | 2020-02 | 2020-01 | 2019-12 | 2019-11 | 2019-10 | 2019-09 | 2019-08 | 2019-07 | 2019-06 | 2019-05 | 2019-04 | 2019-03 | 2019-02 | 2019-01 | 2018-12 | 2018-11 | 2018-10 |
|---|---|---|---|---|---|---|---|---|---|---|---|---|---|---|---|---|---|---|---|---|
| pm25 | 29 | 42 | 36 | 46 | 99 | 49 | 32 | 43 | 28 | 19 | 27 | 26 | 23 | 35 | 49 | 63 | 55 | 29 | 43 | 35 |
| co | 916 | 936 | 897 | 1 | 1 | 1 | 1 | 1 | 998 | 836 | 880 | 708 | 835 | 873 | 1 | 1 | 1 | 1 | 1 | 981 |
| no2 | 24 | 25 | 23 | 24 | 50 | 35 | 38 | 31 | 25 | 18 | 16 | 20 | 20 | 26 | 35 | 38 | 46 | 32 | 41 | 34 |
| o3 | 129 | 133 | 108 | 86 | 68 | 62 | 63 | 101 | 127 | 114 | 172 | 155 | 152 | 121 | 110 | 83 | 71 | 49 | 60 | 75 |
| pm10 | 60 | 87 | 63 | 71 | 129 | 72 | 59 | 72 | 51 | 33 | 45 | 43 | 59 | 81 | 88 | 95 | 98 | 55 | 72 | 67 |
| so2 | 11 | 16 | 14 | 14 | 24 | 17 | 21 | 15 | 9.9 | 5.8 | 8 | 9.9 | 14 | 17 | 23 | 30 | 30 | 24 | 22 | 21 |