Air Pollution in Gaozhantuncun: Real-time Air Quality Index and smog alert.
Pollution and air quality forecast for Gaozhantuncun. Today is Tuesday, June 16, 2026. The following air pollution values have been recorded for Gaozhantuncun:- particulate matter (PM10) suspended dust - 7 (Good)
- particulate matter (PM2.5) dust - 2 (Good)
- carbon monoxide (CO) - 100 (Good)
- nitrogen dioxide (NO2) - 8 (Good)
- ozone (O3) - 0 (Good)
- sulfur dioxide (SO2) - 9 (Good)

What is the air quality in Gaozhantuncun today? Is the air polluted in Gaozhantuncun?. Is there smog?
What is the level of PM10 today in Gaozhantuncun? (particulate matter (PM10) suspended dust)
The current level of particulate matter PM10 in Gaozhantuncun is:
7 (Good)
The highest PM10 values usually occur in month: 182 (January 2019).
The lowest value of particulate matter PM10 pollution in Gaozhantuncun is usually recorded in: August (47).
What is the current level of PM2.5 in Gaozhantuncun? (particulate matter (PM2.5) dust)
Today's PM2.5 level is:
2 (Good)
For comparison, the highest level of PM2.5 in Gaozhantuncun in the last 7 days was: 24 (Friday, May 27, 2022) and the lowest: 24 (Friday, May 27, 2022).
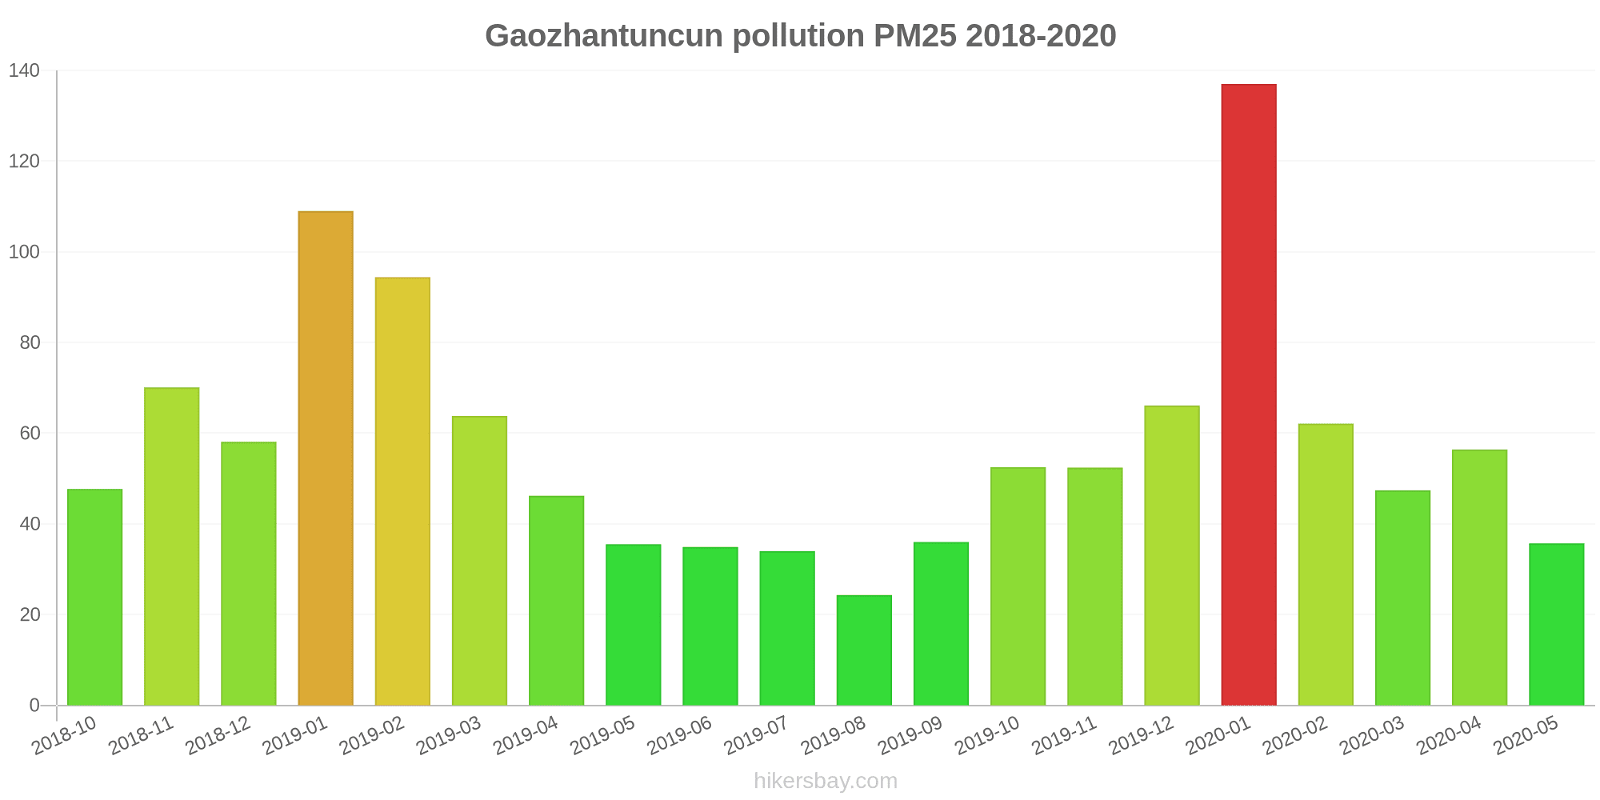
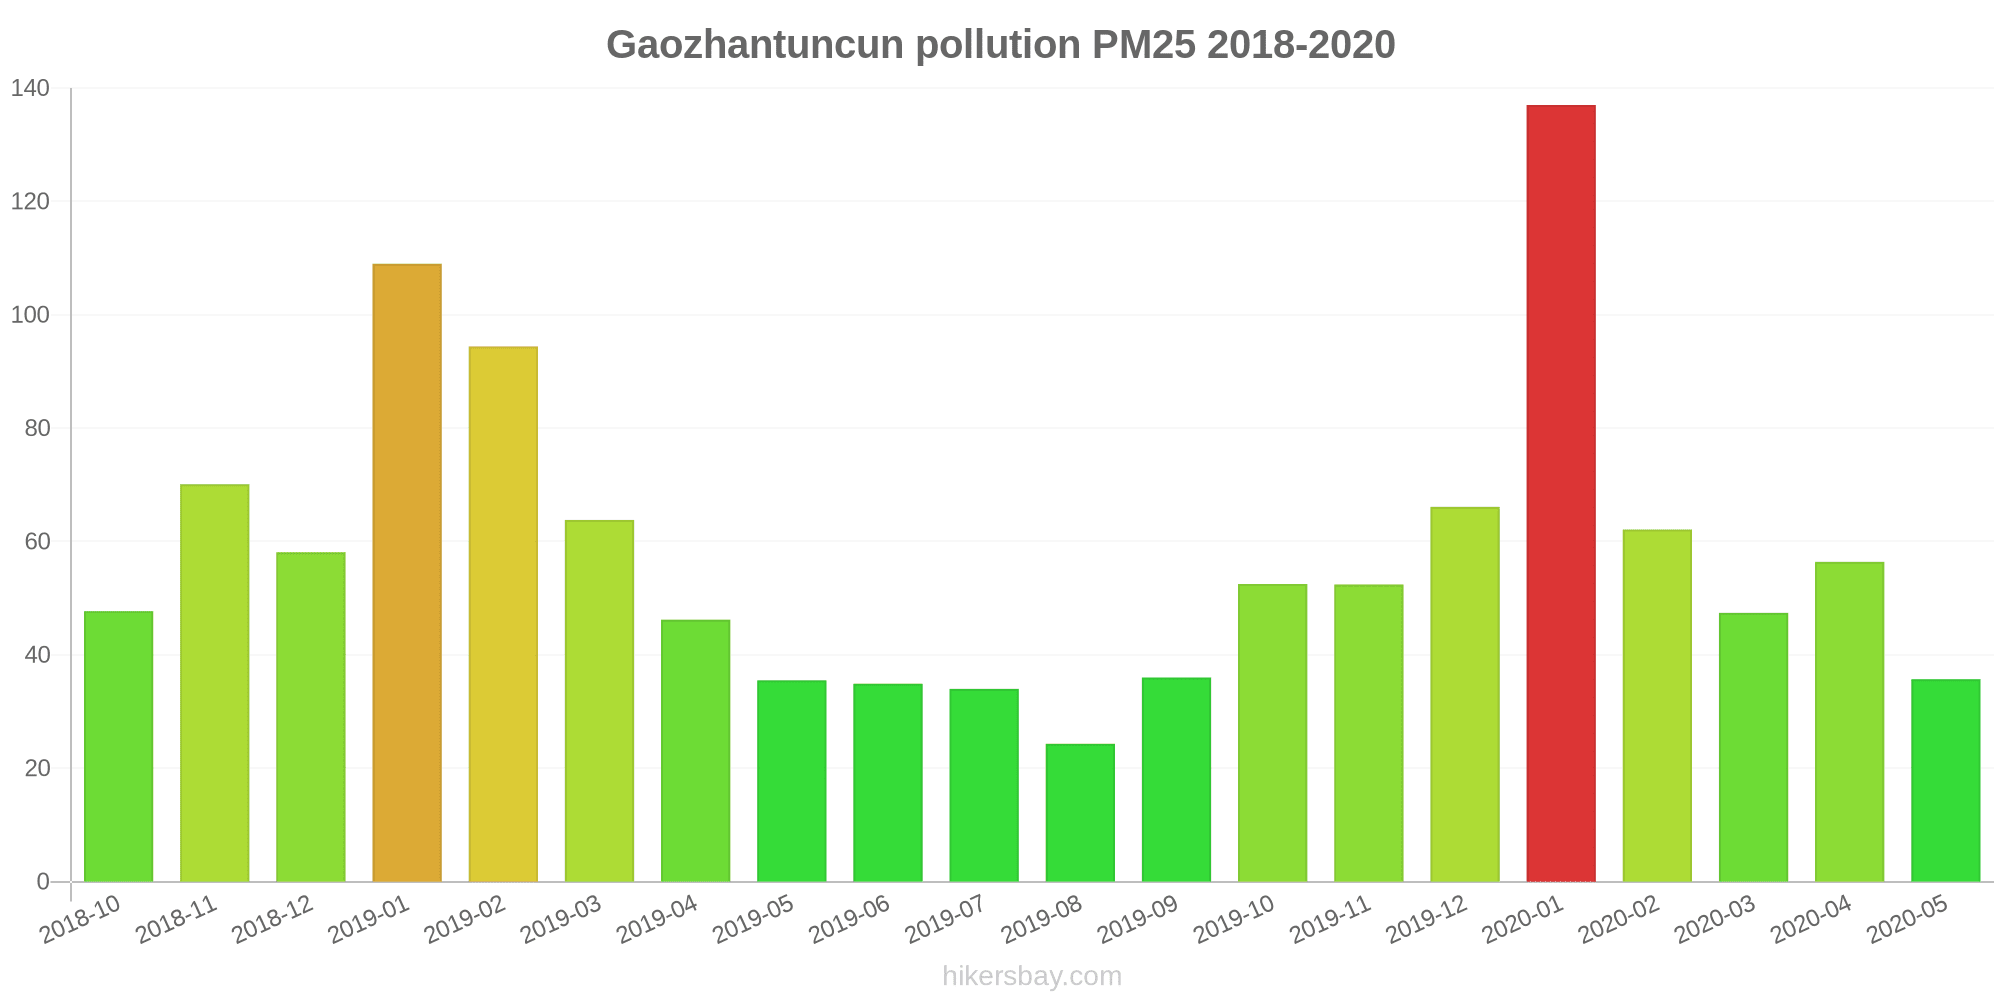
The highest PM2.5 values were recorded: 137 (January 2020).
The lowest level of particulate matter PM2.5 pollution occurs in month: August (24).
How high is the CO level? (carbon monoxide (CO))
100 (Good)
How high is the level of NO2? (nitrogen dioxide (NO2))
8 (Good)
How is the O3 level today in Gaozhantuncun? (ozone (O3))
0 (Good)
What is the level of SO2 pollution? (sulfur dioxide (SO2))
9 (Good)
Current data Friday, May 27, 2022, 12:00 PM
PM10 7 (Good)
PM2,5 2 (Good)
CO 100 (Good)
NO2 8 (Good)
O3 0 (Good)
SO2 9 (Good)
Data on air pollution from recent days in Gaozhantuncun
index
2022-05-27
pm10
32
Moderate
pm25
24
Moderate
co
468
Good
no2
21
Good
o3
32
Good
so2
5
Good
data source »
Air pollution in Gaozhantuncun from October 2018 to May 2020
index
2020-05
2020-04
2020-03
2020-02
2020-01
2019-12
2019-11
2019-10
2019-09
2019-08
2019-07
2019-06
2019-05
2019-04
2019-03
2019-02
2019-01
2018-12
2018-11
2018-10
pm25
36 (Unhealthy for Sensitive Groups)
56 (Unhealthy)
47 (Unhealthy for Sensitive Groups)
62 (Unhealthy)
137 (Very bad Hazardous)
66 (Unhealthy)
52 (Unhealthy for Sensitive Groups)
53 (Unhealthy for Sensitive Groups)
36 (Unhealthy for Sensitive Groups)
24 (Moderate)
34 (Moderate)
35 (Moderate)
36 (Unhealthy for Sensitive Groups)
46 (Unhealthy for Sensitive Groups)
64 (Unhealthy)
94 (Very Unhealthy)
109 (Very Unhealthy)
58 (Unhealthy)
70 (Unhealthy)
48 (Unhealthy for Sensitive Groups)
co
973 (Good)
1 (Good)
1 (Good)
1 (Good)
2 (Good)
1 (Good)
1 (Good)
1 (Good)
1 (Good)
1 (Good)
1 (Good)
1 (Good)
914 (Good)
1 (Good)
1 (Good)
1 (Good)
2 (Good)
1 (Good)
1 (Good)
1 (Good)
no2
27 (Good)
35 (Good)
33 (Good)
40 (Good)
66 (Moderate)
48 (Moderate)
45 (Moderate)
40 (Moderate)
32 (Good)
21 (Good)
18 (Good)
26 (Good)
21 (Good)
30 (Good)
35 (Good)
45 (Moderate)
51 (Moderate)
44 (Moderate)
49 (Moderate)
37 (Good)
o3
132 (Unhealthy for Sensitive Groups)
132 (Unhealthy for Sensitive Groups)
102 (Moderate)
75 (Moderate)
60 (Good)
57 (Good)
57 (Good)
103 (Moderate)
125 (Unhealthy for Sensitive Groups)
111 (Moderate)
169 (Unhealthy)
147 (Unhealthy for Sensitive Groups)
148 (Unhealthy for Sensitive Groups)
115 (Moderate)
109 (Moderate)
87 (Moderate)
62 (Good)
50 (Good)
56 (Good)
78 (Moderate)
pm10
81 (Unhealthy)
115 (Very Unhealthy)
87 (Unhealthy)
96 (Unhealthy)
179 (Very bad Hazardous)
107 (Unhealthy)
108 (Unhealthy)
112 (Very Unhealthy)
80 (Unhealthy for Sensitive Groups)
47 (Moderate)
57 (Unhealthy for Sensitive Groups)
54 (Unhealthy for Sensitive Groups)
67 (Unhealthy for Sensitive Groups)
122 (Very Unhealthy)
121 (Very Unhealthy)
140 (Very Unhealthy)
182 (Very bad Hazardous)
111 (Very Unhealthy)
129 (Very Unhealthy)
106 (Unhealthy)
so2
17 (Good)
22 (Good)
19 (Good)
22 (Good)
32 (Good)
26 (Good)
30 (Good)
19 (Good)
20 (Good)
9.8 (Good)
10 (Good)
15 (Good)
16 (Good)
20 (Good)
23 (Good)
31 (Good)
34 (Good)
32 (Good)
28 (Good)
19 (Good)
data source »
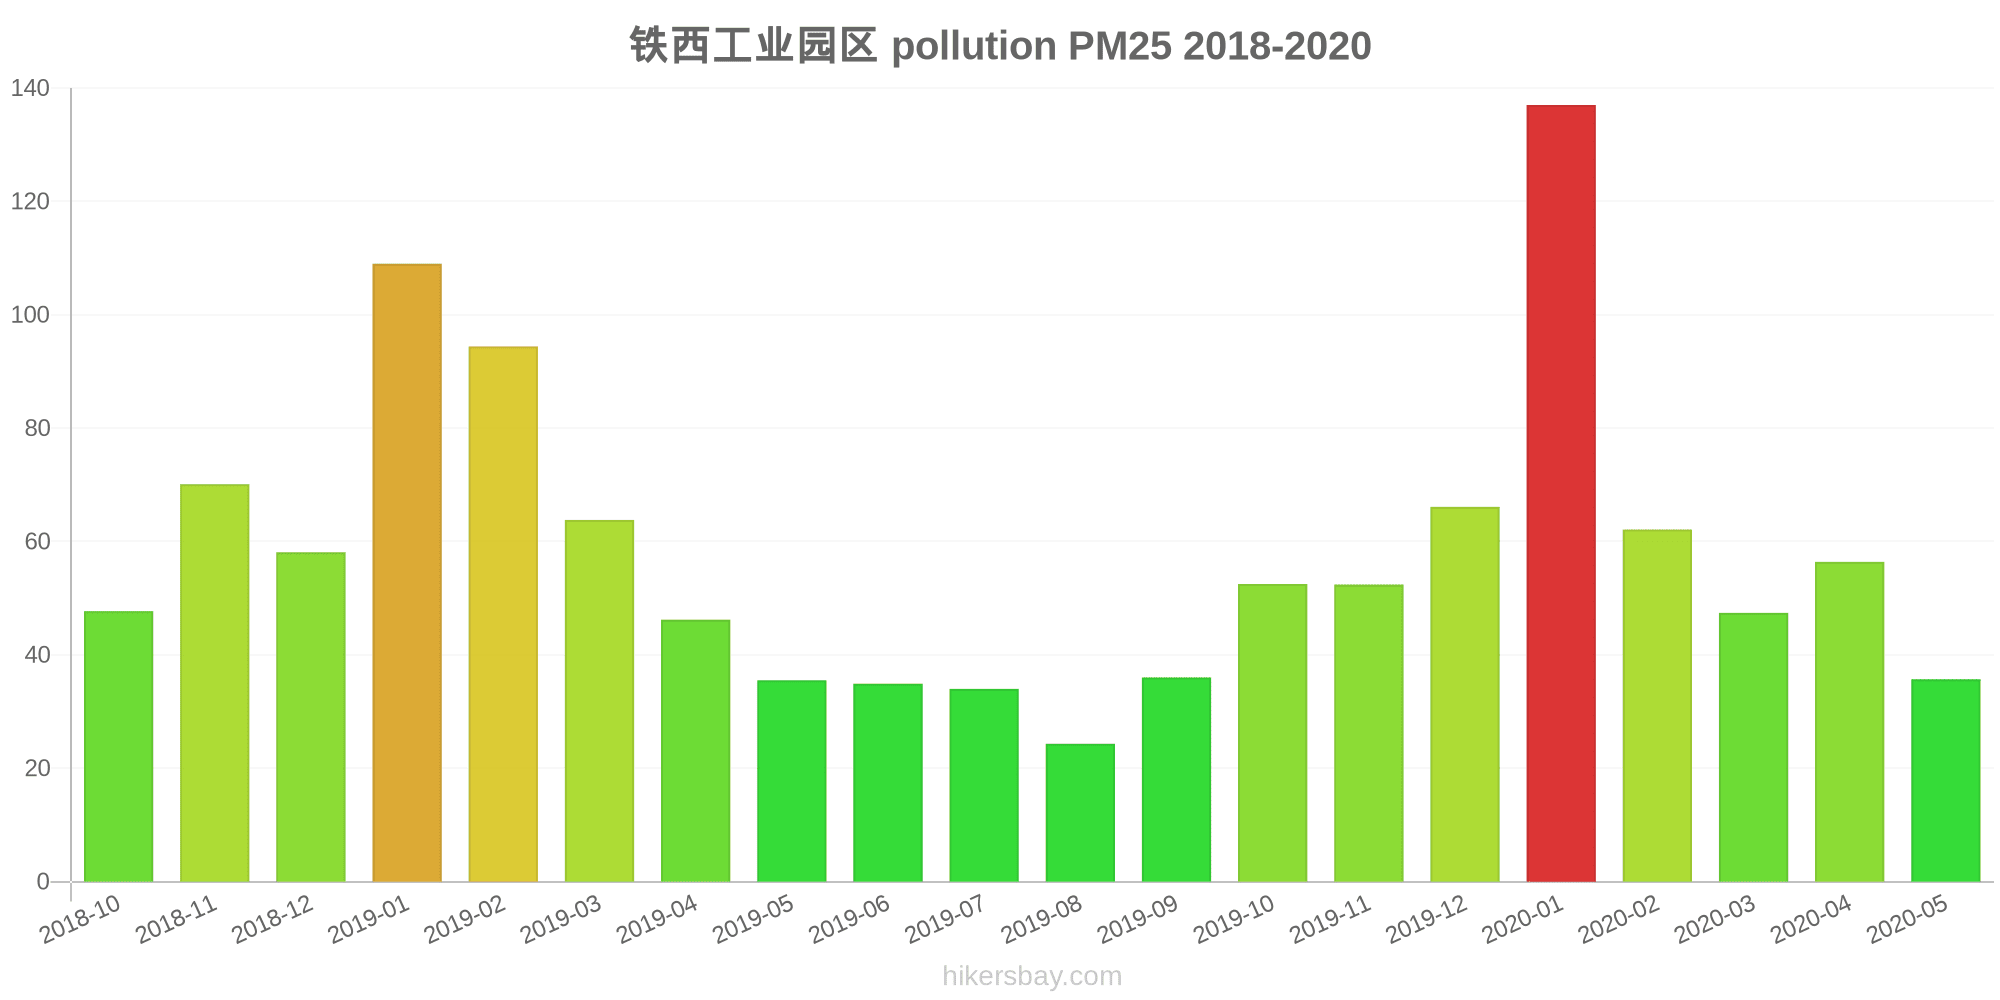
铁西工业园区
Friday, May 27, 2022, 12:00 PM
PM10 6.7 (Good)
particulate matter (PM10) suspended dust
PM2,5 1.7 (Good)
particulate matter (PM2.5) dust
CO 100 (Good)
carbon monoxide (CO)
NO2 7.6 (Good)
nitrogen dioxide (NO2)
O3 0.02 (Good)
ozone (O3)
SO2 8.6 (Good)
sulfur dioxide (SO2)
铁西工业园区
index
2022-05-27
pm10
32
pm25
24
co
468
no2
21
o3
32
so2
4.6
铁西工业园区
2018-10 2020-05

index
2020-05
2020-04
2020-03
2020-02
2020-01
2019-12
2019-11
2019-10
2019-09
2019-08
2019-07
2019-06
2019-05
2019-04
2019-03
2019-02
2019-01
2018-12
2018-11
2018-10
pm25
36
56
47
62
137
66
52
53
36
24
34
35
36
46
64
94
109
58
70
48
co
973
1
1
1
2
1
1
1
1
1
1
1
914
1
1
1
2
1
1
1
no2
27
35
33
40
66
48
45
40
32
21
18
26
21
30
35
45
51
44
49
37
o3
132
132
102
75
60
57
57
103
125
111
169
147
148
115
109
87
62
50
56
78
pm10
81
115
87
96
179
107
108
112
80
47
57
54
67
122
121
140
182
111
129
106
so2
17
22
19
22
32
26
30
19
20
9.8
10
15
16
20
23
31
34
32
28
19
* Pollution data source:
https://openaq.org
(ChinaAQIData)
The data is licensed under CC-By 4.0
PM10 7 (Good)
PM2,5 2 (Good)
CO 100 (Good)
NO2 8 (Good)
O3 0 (Good)
SO2 9 (Good)
Data on air pollution from recent days in Gaozhantuncun
| index | 2022-05-27 |
|---|---|
| pm10 | 32 Moderate |
| pm25 | 24 Moderate |
| co | 468 Good |
| no2 | 21 Good |
| o3 | 32 Good |
| so2 | 5 Good |
| index | 2020-05 | 2020-04 | 2020-03 | 2020-02 | 2020-01 | 2019-12 | 2019-11 | 2019-10 | 2019-09 | 2019-08 | 2019-07 | 2019-06 | 2019-05 | 2019-04 | 2019-03 | 2019-02 | 2019-01 | 2018-12 | 2018-11 | 2018-10 |
|---|---|---|---|---|---|---|---|---|---|---|---|---|---|---|---|---|---|---|---|---|
| pm25 | 36 (Unhealthy for Sensitive Groups) | 56 (Unhealthy) | 47 (Unhealthy for Sensitive Groups) | 62 (Unhealthy) | 137 (Very bad Hazardous) | 66 (Unhealthy) | 52 (Unhealthy for Sensitive Groups) | 53 (Unhealthy for Sensitive Groups) | 36 (Unhealthy for Sensitive Groups) | 24 (Moderate) | 34 (Moderate) | 35 (Moderate) | 36 (Unhealthy for Sensitive Groups) | 46 (Unhealthy for Sensitive Groups) | 64 (Unhealthy) | 94 (Very Unhealthy) | 109 (Very Unhealthy) | 58 (Unhealthy) | 70 (Unhealthy) | 48 (Unhealthy for Sensitive Groups) |
| co | 973 (Good) | 1 (Good) | 1 (Good) | 1 (Good) | 2 (Good) | 1 (Good) | 1 (Good) | 1 (Good) | 1 (Good) | 1 (Good) | 1 (Good) | 1 (Good) | 914 (Good) | 1 (Good) | 1 (Good) | 1 (Good) | 2 (Good) | 1 (Good) | 1 (Good) | 1 (Good) |
| no2 | 27 (Good) | 35 (Good) | 33 (Good) | 40 (Good) | 66 (Moderate) | 48 (Moderate) | 45 (Moderate) | 40 (Moderate) | 32 (Good) | 21 (Good) | 18 (Good) | 26 (Good) | 21 (Good) | 30 (Good) | 35 (Good) | 45 (Moderate) | 51 (Moderate) | 44 (Moderate) | 49 (Moderate) | 37 (Good) |
| o3 | 132 (Unhealthy for Sensitive Groups) | 132 (Unhealthy for Sensitive Groups) | 102 (Moderate) | 75 (Moderate) | 60 (Good) | 57 (Good) | 57 (Good) | 103 (Moderate) | 125 (Unhealthy for Sensitive Groups) | 111 (Moderate) | 169 (Unhealthy) | 147 (Unhealthy for Sensitive Groups) | 148 (Unhealthy for Sensitive Groups) | 115 (Moderate) | 109 (Moderate) | 87 (Moderate) | 62 (Good) | 50 (Good) | 56 (Good) | 78 (Moderate) |
| pm10 | 81 (Unhealthy) | 115 (Very Unhealthy) | 87 (Unhealthy) | 96 (Unhealthy) | 179 (Very bad Hazardous) | 107 (Unhealthy) | 108 (Unhealthy) | 112 (Very Unhealthy) | 80 (Unhealthy for Sensitive Groups) | 47 (Moderate) | 57 (Unhealthy for Sensitive Groups) | 54 (Unhealthy for Sensitive Groups) | 67 (Unhealthy for Sensitive Groups) | 122 (Very Unhealthy) | 121 (Very Unhealthy) | 140 (Very Unhealthy) | 182 (Very bad Hazardous) | 111 (Very Unhealthy) | 129 (Very Unhealthy) | 106 (Unhealthy) |
| so2 | 17 (Good) | 22 (Good) | 19 (Good) | 22 (Good) | 32 (Good) | 26 (Good) | 30 (Good) | 19 (Good) | 20 (Good) | 9.8 (Good) | 10 (Good) | 15 (Good) | 16 (Good) | 20 (Good) | 23 (Good) | 31 (Good) | 34 (Good) | 32 (Good) | 28 (Good) | 19 (Good) |
PM10 6.7 (Good)
particulate matter (PM10) suspended dustPM2,5 1.7 (Good)
particulate matter (PM2.5) dustCO 100 (Good)
carbon monoxide (CO)NO2 7.6 (Good)
nitrogen dioxide (NO2)O3 0.02 (Good)
ozone (O3)SO2 8.6 (Good)
sulfur dioxide (SO2)铁西工业园区
| index | 2022-05-27 |
|---|---|
| pm10 | 32 |
| pm25 | 24 |
| co | 468 |
| no2 | 21 |
| o3 | 32 |
| so2 | 4.6 |
铁西工业园区
| index | 2020-05 | 2020-04 | 2020-03 | 2020-02 | 2020-01 | 2019-12 | 2019-11 | 2019-10 | 2019-09 | 2019-08 | 2019-07 | 2019-06 | 2019-05 | 2019-04 | 2019-03 | 2019-02 | 2019-01 | 2018-12 | 2018-11 | 2018-10 |
|---|---|---|---|---|---|---|---|---|---|---|---|---|---|---|---|---|---|---|---|---|
| pm25 | 36 | 56 | 47 | 62 | 137 | 66 | 52 | 53 | 36 | 24 | 34 | 35 | 36 | 46 | 64 | 94 | 109 | 58 | 70 | 48 |
| co | 973 | 1 | 1 | 1 | 2 | 1 | 1 | 1 | 1 | 1 | 1 | 1 | 914 | 1 | 1 | 1 | 2 | 1 | 1 | 1 |
| no2 | 27 | 35 | 33 | 40 | 66 | 48 | 45 | 40 | 32 | 21 | 18 | 26 | 21 | 30 | 35 | 45 | 51 | 44 | 49 | 37 |
| o3 | 132 | 132 | 102 | 75 | 60 | 57 | 57 | 103 | 125 | 111 | 169 | 147 | 148 | 115 | 109 | 87 | 62 | 50 | 56 | 78 |
| pm10 | 81 | 115 | 87 | 96 | 179 | 107 | 108 | 112 | 80 | 47 | 57 | 54 | 67 | 122 | 121 | 140 | 182 | 111 | 129 | 106 |
| so2 | 17 | 22 | 19 | 22 | 32 | 26 | 30 | 19 | 20 | 9.8 | 10 | 15 | 16 | 20 | 23 | 31 | 34 | 32 | 28 | 19 |