Air Pollution in Hougao Guantai: Real-time Air Quality Index and smog alert.
Pollution and air quality forecast for Hougao Guantai. Today is Tuesday, June 16, 2026. The following air pollution values have been recorded for Hougao Guantai:- particulate matter (PM10) suspended dust - 7 (Good)
- particulate matter (PM2.5) dust - 2 (Good)
- carbon monoxide (CO) - 100 (Good)
- nitrogen dioxide (NO2) - 8 (Good)
- ozone (O3) - 0 (Good)
- sulfur dioxide (SO2) - 9 (Good)

What is the air quality in Hougao Guantai today? Is the air polluted in Hougao Guantai?. Is there smog?
What is the level of PM10 today in Hougao Guantai? (particulate matter (PM10) suspended dust)
The current level of particulate matter PM10 in Hougao Guantai is:
7 (Good)
The highest PM10 values usually occur in month: 113 (January 2020).
The lowest value of particulate matter PM10 pollution in Hougao Guantai is usually recorded in: August (34).
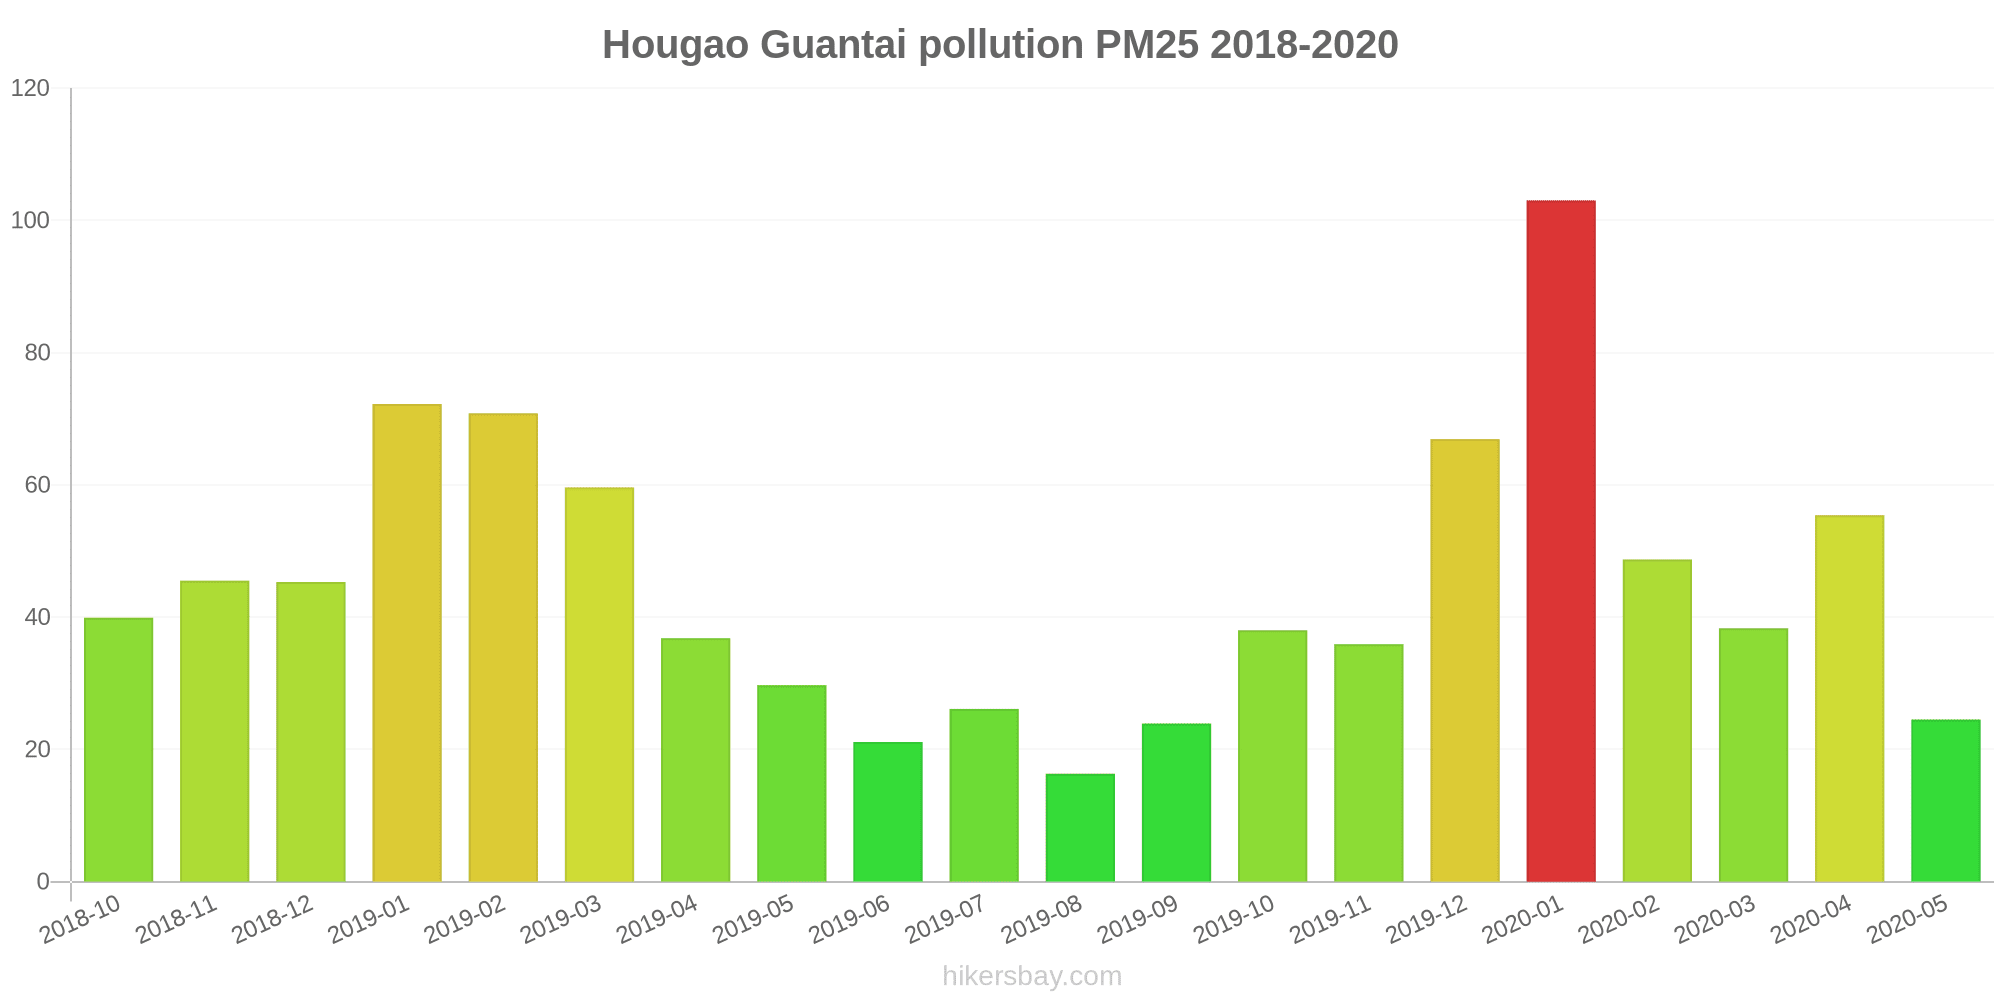
What is the current level of PM2.5 in Hougao Guantai? (particulate matter (PM2.5) dust)
Today's PM2.5 level is:
2 (Good)
For comparison, the highest level of PM2.5 in Hougao Guantai in the last 7 days was: 24 (Friday, May 27, 2022) and the lowest: 24 (Friday, May 27, 2022).
The highest PM2.5 values were recorded: 103 (January 2020).
The lowest level of particulate matter PM2.5 pollution occurs in month: August (16).
How high is the CO level? (carbon monoxide (CO))
100 (Good)
How high is the level of NO2? (nitrogen dioxide (NO2))
8 (Good)
How is the O3 level today in Hougao Guantai? (ozone (O3))
0 (Good)
What is the level of SO2 pollution? (sulfur dioxide (SO2))
9 (Good)
Current data Friday, May 27, 2022, 12:00 PM
PM10 7 (Good)
PM2,5 2 (Good)
CO 100 (Good)
NO2 8 (Good)
O3 0 (Good)
SO2 9 (Good)
Data on air pollution from recent days in Hougao Guantai
index
2022-05-27
pm10
32
Moderate
pm25
24
Moderate
co
468
Good
no2
21
Good
o3
32
Good
so2
5
Good
data source »
Air pollution in Hougao Guantai from October 2018 to May 2020

index
2020-05
2020-04
2020-03
2020-02
2020-01
2019-12
2019-11
2019-10
2019-09
2019-08
2019-07
2019-06
2019-05
2019-04
2019-03
2019-02
2019-01
2018-12
2018-11
2018-10
pm25
25 (Moderate)
55 (Unhealthy)
38 (Unhealthy for Sensitive Groups)
49 (Unhealthy for Sensitive Groups)
103 (Very Unhealthy)
67 (Unhealthy)
36 (Unhealthy for Sensitive Groups)
38 (Unhealthy for Sensitive Groups)
24 (Moderate)
16 (Moderate)
26 (Moderate)
21 (Moderate)
30 (Moderate)
37 (Unhealthy for Sensitive Groups)
60 (Unhealthy)
71 (Unhealthy)
72 (Unhealthy)
45 (Unhealthy for Sensitive Groups)
46 (Unhealthy for Sensitive Groups)
40 (Unhealthy for Sensitive Groups)
co
642 (Good)
851 (Good)
780 (Good)
1 (Good)
1 (Good)
1 (Good)
829 (Good)
1 (Good)
862 (Good)
732 (Good)
867 (Good)
811 (Good)
697 (Good)
669 (Good)
966 (Good)
1 (Good)
1 (Good)
1 (Good)
1 (Good)
1 (Good)
no2
21 (Good)
33 (Good)
29 (Good)
24 (Good)
43 (Moderate)
42 (Moderate)
34 (Good)
32 (Good)
28 (Good)
17 (Good)
22 (Good)
27 (Good)
23 (Good)
26 (Good)
32 (Good)
36 (Good)
41 (Moderate)
33 (Good)
37 (Good)
35 (Good)
o3
127 (Unhealthy for Sensitive Groups)
124 (Unhealthy for Sensitive Groups)
96 (Moderate)
82 (Moderate)
72 (Moderate)
53 (Good)
54 (Good)
102 (Moderate)
133 (Unhealthy for Sensitive Groups)
119 (Moderate)
186 (Very Unhealthy)
157 (Unhealthy)
151 (Unhealthy)
112 (Moderate)
99 (Moderate)
73 (Moderate)
57 (Good)
57 (Good)
55 (Good)
79 (Moderate)
pm10
70 (Unhealthy for Sensitive Groups)
107 (Unhealthy)
69 (Unhealthy for Sensitive Groups)
64 (Unhealthy for Sensitive Groups)
113 (Very Unhealthy)
85 (Unhealthy)
66 (Unhealthy for Sensitive Groups)
81 (Unhealthy)
56 (Unhealthy for Sensitive Groups)
34 (Moderate)
51 (Unhealthy for Sensitive Groups)
44 (Moderate)
82 (Unhealthy)
103 (Unhealthy)
101 (Unhealthy)
98 (Unhealthy)
113 (Very Unhealthy)
74 (Unhealthy for Sensitive Groups)
75 (Unhealthy for Sensitive Groups)
74 (Unhealthy for Sensitive Groups)
so2
12 (Good)
18 (Good)
13 (Good)
14 (Good)
24 (Good)
23 (Good)
20 (Good)
17 (Good)
17 (Good)
8.8 (Good)
11 (Good)
13 (Good)
23 (Good)
25 (Good)
27 (Good)
31 (Good)
30 (Good)
25 (Good)
24 (Good)
22 (Good)
data source »
东陵路
Friday, May 27, 2022, 12:00 PM
PM10 6.7 (Good)
particulate matter (PM10) suspended dust
PM2,5 1.7 (Good)
particulate matter (PM2.5) dust
CO 100 (Good)
carbon monoxide (CO)
NO2 7.6 (Good)
nitrogen dioxide (NO2)
O3 0.02 (Good)
ozone (O3)
SO2 8.6 (Good)
sulfur dioxide (SO2)
东陵路
index
2022-05-27
pm10
32
pm25
24
co
468
no2
21
o3
32
so2
4.6
东陵路
2018-10 2020-05

index
2020-05
2020-04
2020-03
2020-02
2020-01
2019-12
2019-11
2019-10
2019-09
2019-08
2019-07
2019-06
2019-05
2019-04
2019-03
2019-02
2019-01
2018-12
2018-11
2018-10
pm25
25
55
38
49
103
67
36
38
24
16
26
21
30
37
60
71
72
45
46
40
co
642
851
780
1
1
1
829
1
862
732
867
811
697
669
966
1
1
1
1
1
no2
21
33
29
24
43
42
34
32
28
17
22
27
23
26
32
36
41
33
37
35
o3
127
124
96
82
72
53
54
102
133
119
186
157
151
112
99
73
57
57
55
79
pm10
70
107
69
64
113
85
66
81
56
34
51
44
82
103
101
98
113
74
75
74
so2
12
18
13
14
24
23
20
17
17
8.8
11
13
23
25
27
31
30
25
24
22
* Pollution data source:
https://openaq.org
(ChinaAQIData)
The data is licensed under CC-By 4.0
PM10 7 (Good)
PM2,5 2 (Good)
CO 100 (Good)
NO2 8 (Good)
O3 0 (Good)
SO2 9 (Good)
Data on air pollution from recent days in Hougao Guantai
| index | 2022-05-27 |
|---|---|
| pm10 | 32 Moderate |
| pm25 | 24 Moderate |
| co | 468 Good |
| no2 | 21 Good |
| o3 | 32 Good |
| so2 | 5 Good |
| index | 2020-05 | 2020-04 | 2020-03 | 2020-02 | 2020-01 | 2019-12 | 2019-11 | 2019-10 | 2019-09 | 2019-08 | 2019-07 | 2019-06 | 2019-05 | 2019-04 | 2019-03 | 2019-02 | 2019-01 | 2018-12 | 2018-11 | 2018-10 |
|---|---|---|---|---|---|---|---|---|---|---|---|---|---|---|---|---|---|---|---|---|
| pm25 | 25 (Moderate) | 55 (Unhealthy) | 38 (Unhealthy for Sensitive Groups) | 49 (Unhealthy for Sensitive Groups) | 103 (Very Unhealthy) | 67 (Unhealthy) | 36 (Unhealthy for Sensitive Groups) | 38 (Unhealthy for Sensitive Groups) | 24 (Moderate) | 16 (Moderate) | 26 (Moderate) | 21 (Moderate) | 30 (Moderate) | 37 (Unhealthy for Sensitive Groups) | 60 (Unhealthy) | 71 (Unhealthy) | 72 (Unhealthy) | 45 (Unhealthy for Sensitive Groups) | 46 (Unhealthy for Sensitive Groups) | 40 (Unhealthy for Sensitive Groups) |
| co | 642 (Good) | 851 (Good) | 780 (Good) | 1 (Good) | 1 (Good) | 1 (Good) | 829 (Good) | 1 (Good) | 862 (Good) | 732 (Good) | 867 (Good) | 811 (Good) | 697 (Good) | 669 (Good) | 966 (Good) | 1 (Good) | 1 (Good) | 1 (Good) | 1 (Good) | 1 (Good) |
| no2 | 21 (Good) | 33 (Good) | 29 (Good) | 24 (Good) | 43 (Moderate) | 42 (Moderate) | 34 (Good) | 32 (Good) | 28 (Good) | 17 (Good) | 22 (Good) | 27 (Good) | 23 (Good) | 26 (Good) | 32 (Good) | 36 (Good) | 41 (Moderate) | 33 (Good) | 37 (Good) | 35 (Good) |
| o3 | 127 (Unhealthy for Sensitive Groups) | 124 (Unhealthy for Sensitive Groups) | 96 (Moderate) | 82 (Moderate) | 72 (Moderate) | 53 (Good) | 54 (Good) | 102 (Moderate) | 133 (Unhealthy for Sensitive Groups) | 119 (Moderate) | 186 (Very Unhealthy) | 157 (Unhealthy) | 151 (Unhealthy) | 112 (Moderate) | 99 (Moderate) | 73 (Moderate) | 57 (Good) | 57 (Good) | 55 (Good) | 79 (Moderate) |
| pm10 | 70 (Unhealthy for Sensitive Groups) | 107 (Unhealthy) | 69 (Unhealthy for Sensitive Groups) | 64 (Unhealthy for Sensitive Groups) | 113 (Very Unhealthy) | 85 (Unhealthy) | 66 (Unhealthy for Sensitive Groups) | 81 (Unhealthy) | 56 (Unhealthy for Sensitive Groups) | 34 (Moderate) | 51 (Unhealthy for Sensitive Groups) | 44 (Moderate) | 82 (Unhealthy) | 103 (Unhealthy) | 101 (Unhealthy) | 98 (Unhealthy) | 113 (Very Unhealthy) | 74 (Unhealthy for Sensitive Groups) | 75 (Unhealthy for Sensitive Groups) | 74 (Unhealthy for Sensitive Groups) |
| so2 | 12 (Good) | 18 (Good) | 13 (Good) | 14 (Good) | 24 (Good) | 23 (Good) | 20 (Good) | 17 (Good) | 17 (Good) | 8.8 (Good) | 11 (Good) | 13 (Good) | 23 (Good) | 25 (Good) | 27 (Good) | 31 (Good) | 30 (Good) | 25 (Good) | 24 (Good) | 22 (Good) |
PM10 6.7 (Good)
particulate matter (PM10) suspended dustPM2,5 1.7 (Good)
particulate matter (PM2.5) dustCO 100 (Good)
carbon monoxide (CO)NO2 7.6 (Good)
nitrogen dioxide (NO2)O3 0.02 (Good)
ozone (O3)SO2 8.6 (Good)
sulfur dioxide (SO2)东陵路
| index | 2022-05-27 |
|---|---|
| pm10 | 32 |
| pm25 | 24 |
| co | 468 |
| no2 | 21 |
| o3 | 32 |
| so2 | 4.6 |
东陵路

| index | 2020-05 | 2020-04 | 2020-03 | 2020-02 | 2020-01 | 2019-12 | 2019-11 | 2019-10 | 2019-09 | 2019-08 | 2019-07 | 2019-06 | 2019-05 | 2019-04 | 2019-03 | 2019-02 | 2019-01 | 2018-12 | 2018-11 | 2018-10 |
|---|---|---|---|---|---|---|---|---|---|---|---|---|---|---|---|---|---|---|---|---|
| pm25 | 25 | 55 | 38 | 49 | 103 | 67 | 36 | 38 | 24 | 16 | 26 | 21 | 30 | 37 | 60 | 71 | 72 | 45 | 46 | 40 |
| co | 642 | 851 | 780 | 1 | 1 | 1 | 829 | 1 | 862 | 732 | 867 | 811 | 697 | 669 | 966 | 1 | 1 | 1 | 1 | 1 |
| no2 | 21 | 33 | 29 | 24 | 43 | 42 | 34 | 32 | 28 | 17 | 22 | 27 | 23 | 26 | 32 | 36 | 41 | 33 | 37 | 35 |
| o3 | 127 | 124 | 96 | 82 | 72 | 53 | 54 | 102 | 133 | 119 | 186 | 157 | 151 | 112 | 99 | 73 | 57 | 57 | 55 | 79 |
| pm10 | 70 | 107 | 69 | 64 | 113 | 85 | 66 | 81 | 56 | 34 | 51 | 44 | 82 | 103 | 101 | 98 | 113 | 74 | 75 | 74 |
| so2 | 12 | 18 | 13 | 14 | 24 | 23 | 20 | 17 | 17 | 8.8 | 11 | 13 | 23 | 25 | 27 | 31 | 30 | 25 | 24 | 22 |