Air Pollution in Balibucun: Real-time Air Quality Index and smog alert.
Pollution and air quality forecast for Balibucun. Today is Tuesday, June 16, 2026. The following air pollution values have been recorded for Balibucun:- particulate matter (PM10) suspended dust - 7 (Good)
- particulate matter (PM2.5) dust - 2 (Good)
- carbon monoxide (CO) - 100 (Good)
- nitrogen dioxide (NO2) - 8 (Good)
- ozone (O3) - 0 (Good)
- sulfur dioxide (SO2) - 9 (Good)

What is the air quality in Balibucun today? Is the air polluted in Balibucun?. Is there smog?
What is the level of PM10 today in Balibucun? (particulate matter (PM10) suspended dust)
The current level of particulate matter PM10 in Balibucun is:
7 (Good)
The highest PM10 values usually occur in month: 122 (January 2020).
The lowest value of particulate matter PM10 pollution in Balibucun is usually recorded in: August (39).
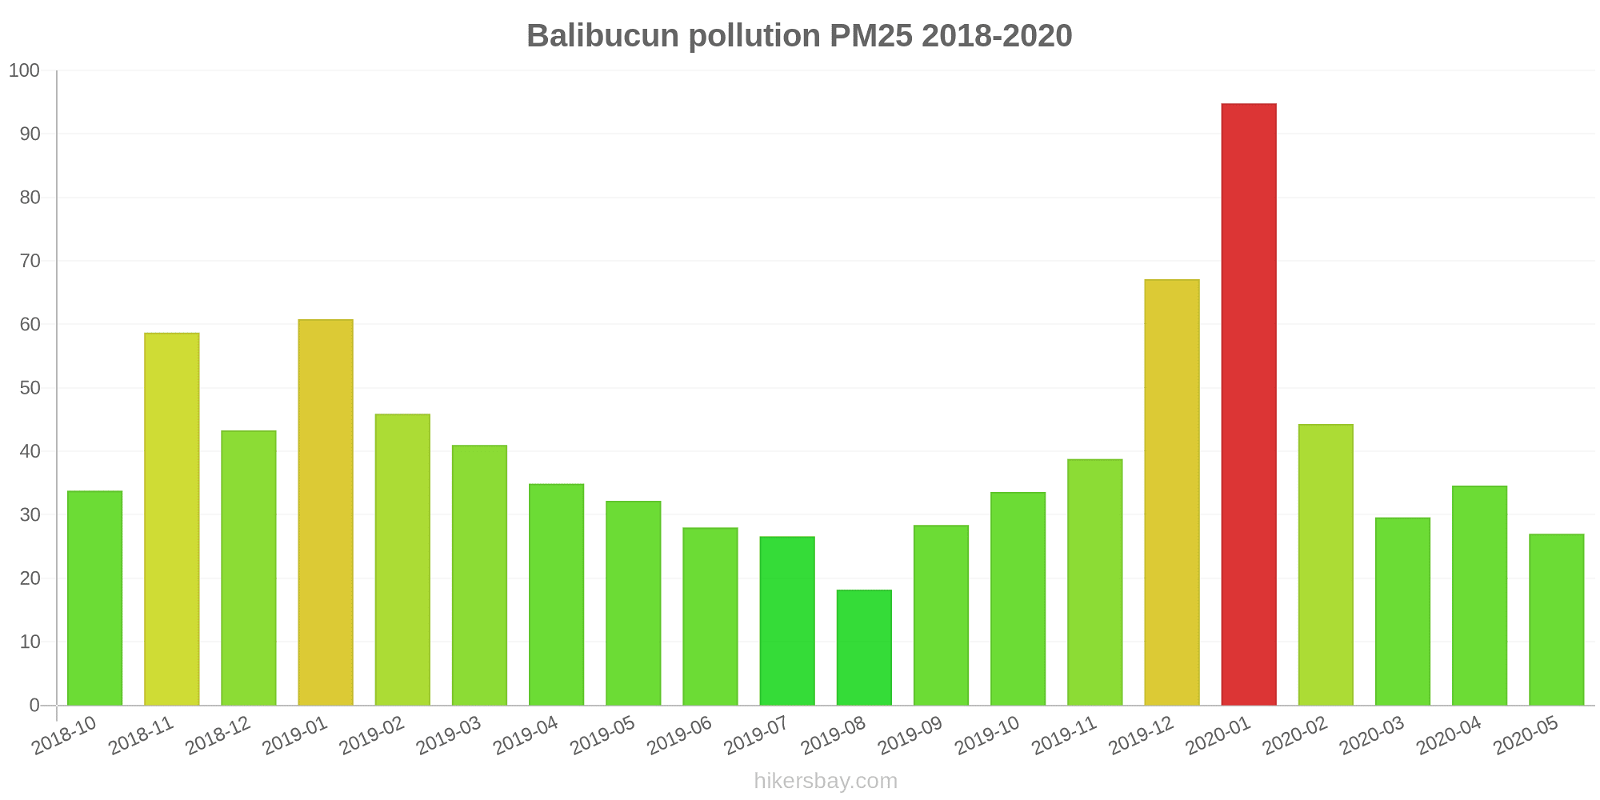
What is the current level of PM2.5 in Balibucun? (particulate matter (PM2.5) dust)
Today's PM2.5 level is:
2 (Good)
For comparison, the highest level of PM2.5 in Balibucun in the last 7 days was: 24 (Friday, May 27, 2022) and the lowest: 24 (Friday, May 27, 2022).
The highest PM2.5 values were recorded: 95 (January 2020).
The lowest level of particulate matter PM2.5 pollution occurs in month: August (18).
How high is the CO level? (carbon monoxide (CO))
100 (Good)
How high is the level of NO2? (nitrogen dioxide (NO2))
8 (Good)
How is the O3 level today in Balibucun? (ozone (O3))
0 (Good)
What is the level of SO2 pollution? (sulfur dioxide (SO2))
9 (Good)
Current data Friday, May 27, 2022, 12:00 PM
PM10 7 (Good)
PM2,5 2 (Good)
CO 100 (Good)
NO2 8 (Good)
O3 0 (Good)
SO2 9 (Good)
Data on air pollution from recent days in Balibucun
index
2022-05-27
pm10
32
Moderate
pm25
24
Moderate
co
468
Good
no2
21
Good
o3
32
Good
so2
5
Good
data source »
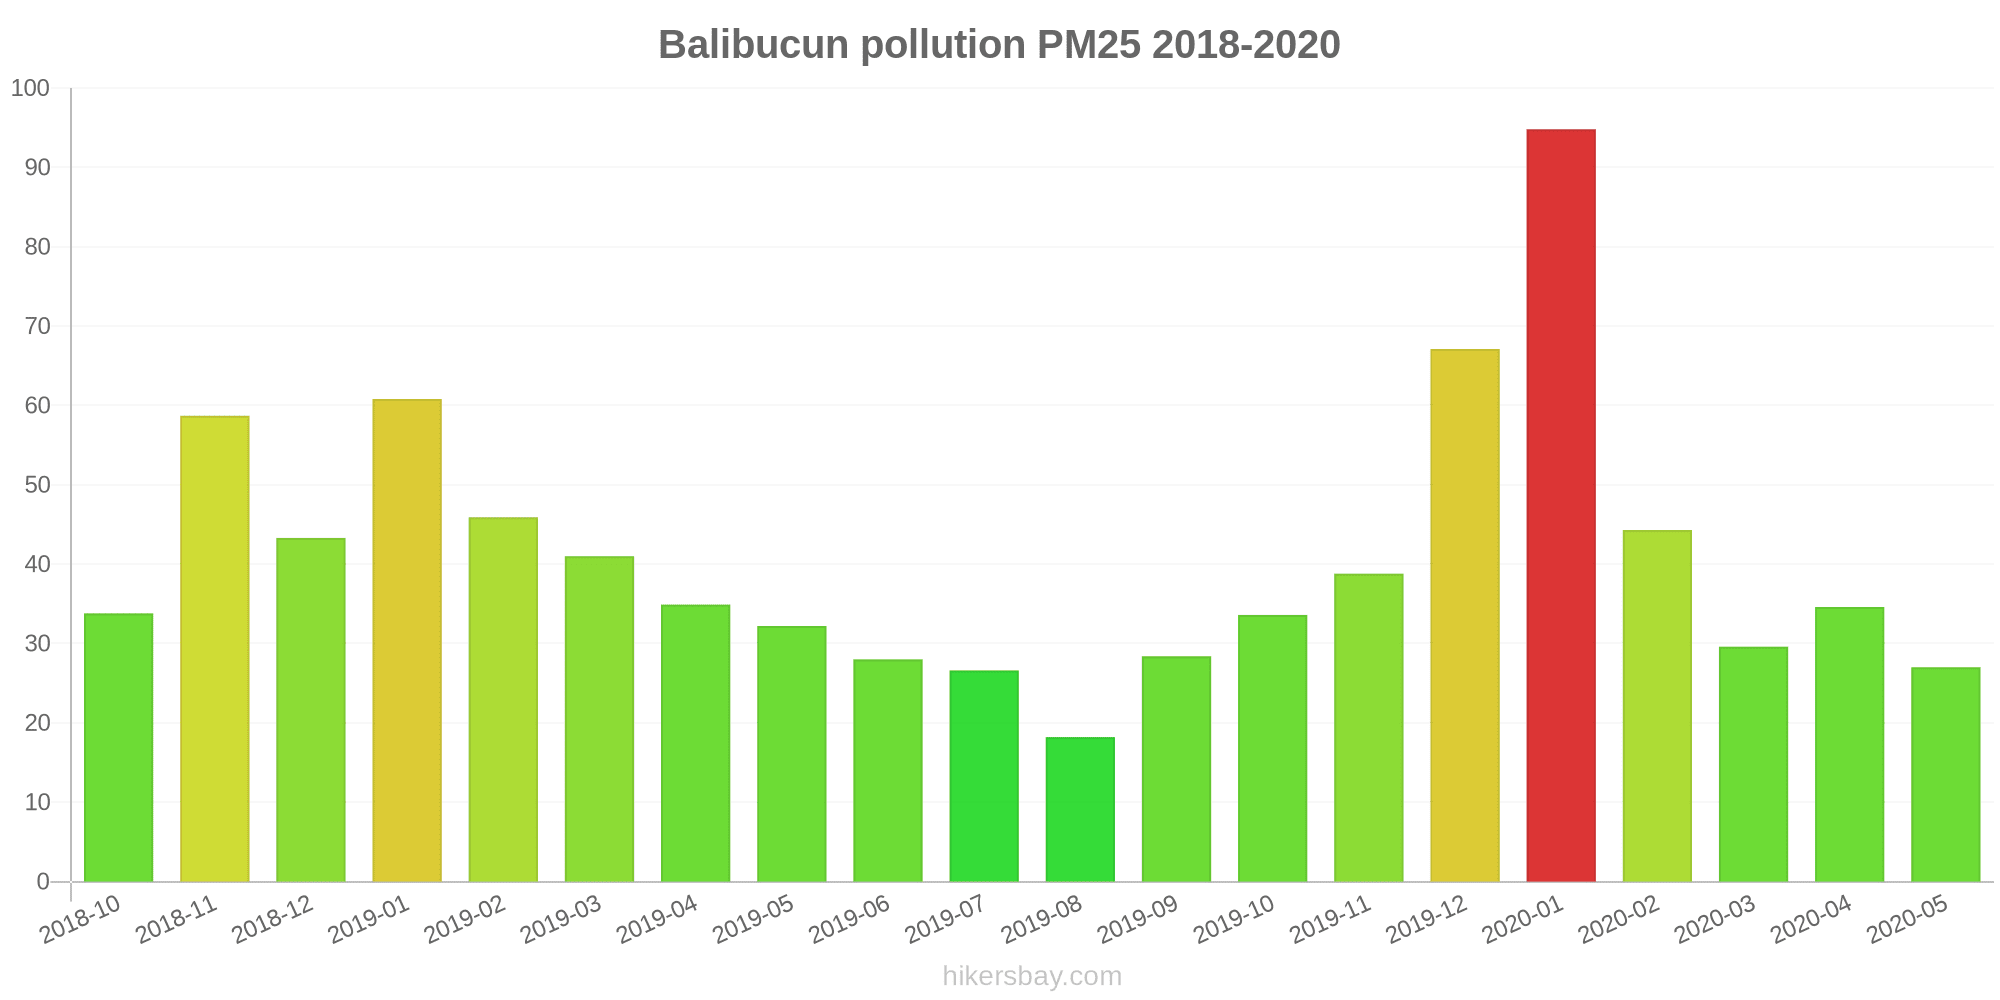
Air pollution in Balibucun from October 2018 to May 2020
index
2020-05
2020-04
2020-03
2020-02
2020-01
2019-12
2019-11
2019-10
2019-09
2019-08
2019-07
2019-06
2019-05
2019-04
2019-03
2019-02
2019-01
2018-12
2018-11
2018-10
pm25
27 (Moderate)
35 (Moderate)
30 (Moderate)
44 (Unhealthy for Sensitive Groups)
95 (Very Unhealthy)
67 (Unhealthy)
39 (Unhealthy for Sensitive Groups)
34 (Moderate)
28 (Moderate)
18 (Moderate)
27 (Moderate)
28 (Moderate)
32 (Moderate)
35 (Moderate)
41 (Unhealthy for Sensitive Groups)
46 (Unhealthy for Sensitive Groups)
61 (Unhealthy)
43 (Unhealthy for Sensitive Groups)
59 (Unhealthy)
34 (Moderate)
co
845 (Good)
807 (Good)
835 (Good)
1 (Good)
1 (Good)
1 (Good)
1 (Good)
943 (Good)
958 (Good)
746 (Good)
919 (Good)
840 (Good)
806 (Good)
903 (Good)
996 (Good)
1 (Good)
1 (Good)
1 (Good)
1 (Good)
1 (Good)
no2
16 (Good)
23 (Good)
19 (Good)
20 (Good)
37 (Good)
39 (Good)
33 (Good)
31 (Good)
25 (Good)
16 (Good)
17 (Good)
17 (Good)
18 (Good)
22 (Good)
26 (Good)
27 (Good)
35 (Good)
31 (Good)
40 (Good)
33 (Good)
o3
136 (Unhealthy for Sensitive Groups)
120 (Unhealthy for Sensitive Groups)
96 (Moderate)
89 (Moderate)
75 (Moderate)
57 (Good)
63 (Good)
92 (Moderate)
129 (Unhealthy for Sensitive Groups)
97 (Moderate)
164 (Unhealthy)
173 (Unhealthy)
160 (Unhealthy)
117 (Moderate)
102 (Moderate)
79 (Moderate)
66 (Good)
60 (Good)
70 (Moderate)
86 (Moderate)
pm10
84 (Unhealthy)
86 (Unhealthy)
65 (Unhealthy for Sensitive Groups)
65 (Unhealthy for Sensitive Groups)
122 (Very Unhealthy)
93 (Unhealthy)
78 (Unhealthy for Sensitive Groups)
79 (Unhealthy for Sensitive Groups)
68 (Unhealthy for Sensitive Groups)
39 (Moderate)
53 (Unhealthy for Sensitive Groups)
50 (Unhealthy for Sensitive Groups)
70 (Unhealthy for Sensitive Groups)
91 (Unhealthy)
84 (Unhealthy)
89 (Unhealthy)
108 (Unhealthy)
86 (Unhealthy)
110 (Very Unhealthy)
72 (Unhealthy for Sensitive Groups)
so2
14 (Good)
16 (Good)
14 (Good)
20 (Good)
35 (Good)
32 (Good)
22 (Good)
17 (Good)
14 (Good)
7.5 (Good)
6.3 (Good)
12 (Good)
13 (Good)
18 (Good)
21 (Good)
28 (Good)
38 (Good)
31 (Good)
32 (Good)
17 (Good)
data source »
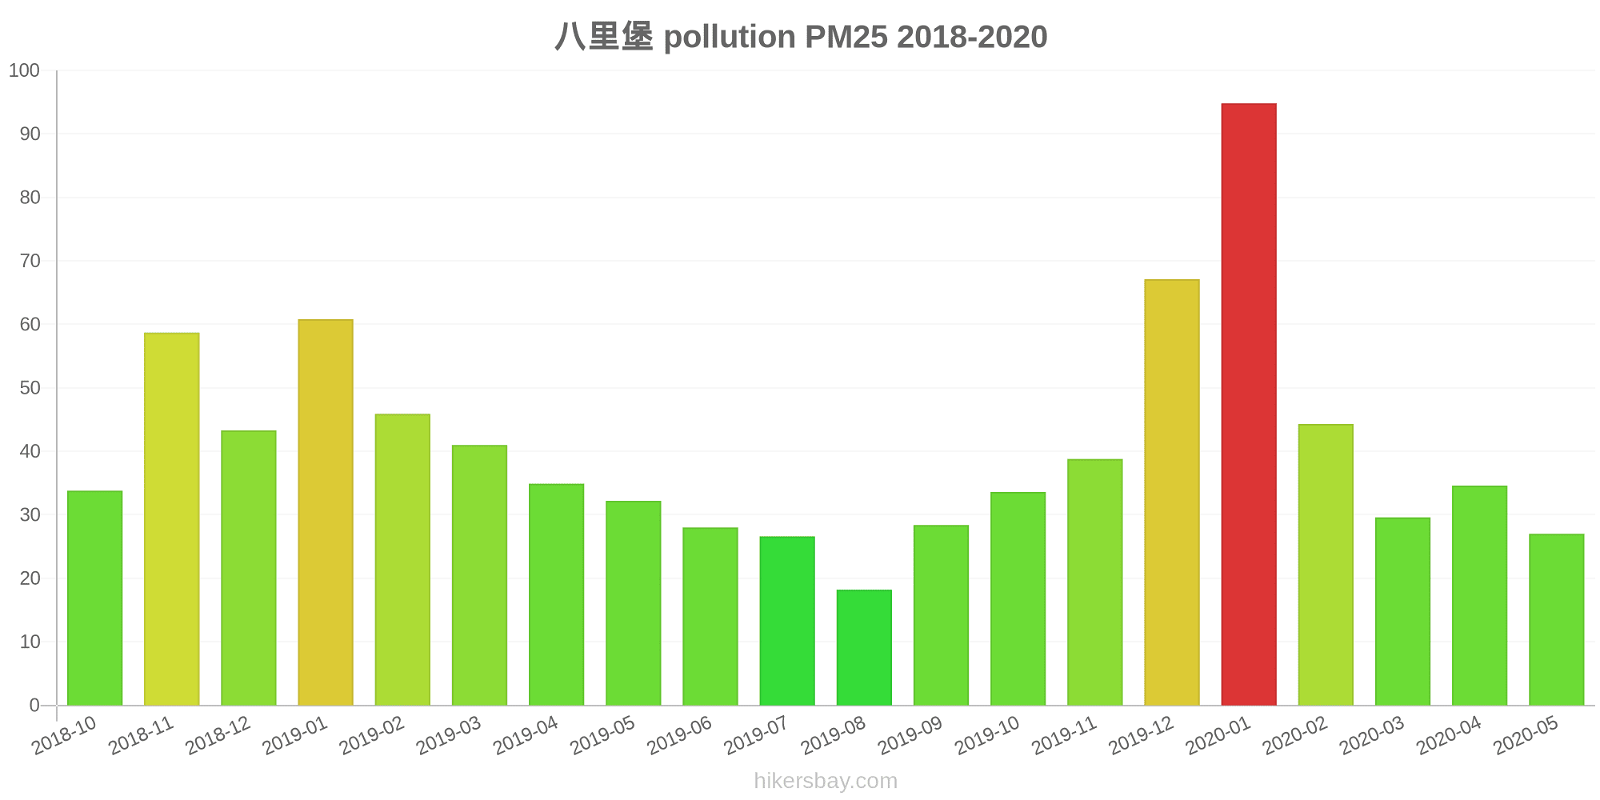
八里堡
Friday, May 27, 2022, 12:00 PM
PM10 6.7 (Good)
particulate matter (PM10) suspended dust
PM2,5 1.7 (Good)
particulate matter (PM2.5) dust
CO 100 (Good)
carbon monoxide (CO)
NO2 7.6 (Good)
nitrogen dioxide (NO2)
O3 0.02 (Good)
ozone (O3)
SO2 8.6 (Good)
sulfur dioxide (SO2)
八里堡
index
2022-05-27
pm10
32
pm25
24
co
468
no2
21
o3
32
so2
4.6
八里堡
2018-10 2020-05
index
2020-05
2020-04
2020-03
2020-02
2020-01
2019-12
2019-11
2019-10
2019-09
2019-08
2019-07
2019-06
2019-05
2019-04
2019-03
2019-02
2019-01
2018-12
2018-11
2018-10
pm25
27
35
30
44
95
67
39
34
28
18
27
28
32
35
41
46
61
43
59
34
co
845
807
835
1
1
1
1
943
958
746
919
840
806
903
996
1
1
1
1
1
no2
16
23
19
20
37
39
33
31
25
16
17
17
18
22
26
27
35
31
40
33
o3
136
120
96
89
75
57
63
92
129
97
164
173
160
117
102
79
66
60
70
86
pm10
84
86
65
65
122
93
78
79
68
39
53
50
70
91
84
89
108
86
110
72
so2
14
16
14
20
35
32
22
17
14
7.5
6.3
12
13
18
21
28
38
31
32
17
* Pollution data source:
https://openaq.org
(ChinaAQIData)
The data is licensed under CC-By 4.0
PM10 7 (Good)
PM2,5 2 (Good)
CO 100 (Good)
NO2 8 (Good)
O3 0 (Good)
SO2 9 (Good)
Data on air pollution from recent days in Balibucun
| index | 2022-05-27 |
|---|---|
| pm10 | 32 Moderate |
| pm25 | 24 Moderate |
| co | 468 Good |
| no2 | 21 Good |
| o3 | 32 Good |
| so2 | 5 Good |
| index | 2020-05 | 2020-04 | 2020-03 | 2020-02 | 2020-01 | 2019-12 | 2019-11 | 2019-10 | 2019-09 | 2019-08 | 2019-07 | 2019-06 | 2019-05 | 2019-04 | 2019-03 | 2019-02 | 2019-01 | 2018-12 | 2018-11 | 2018-10 |
|---|---|---|---|---|---|---|---|---|---|---|---|---|---|---|---|---|---|---|---|---|
| pm25 | 27 (Moderate) | 35 (Moderate) | 30 (Moderate) | 44 (Unhealthy for Sensitive Groups) | 95 (Very Unhealthy) | 67 (Unhealthy) | 39 (Unhealthy for Sensitive Groups) | 34 (Moderate) | 28 (Moderate) | 18 (Moderate) | 27 (Moderate) | 28 (Moderate) | 32 (Moderate) | 35 (Moderate) | 41 (Unhealthy for Sensitive Groups) | 46 (Unhealthy for Sensitive Groups) | 61 (Unhealthy) | 43 (Unhealthy for Sensitive Groups) | 59 (Unhealthy) | 34 (Moderate) |
| co | 845 (Good) | 807 (Good) | 835 (Good) | 1 (Good) | 1 (Good) | 1 (Good) | 1 (Good) | 943 (Good) | 958 (Good) | 746 (Good) | 919 (Good) | 840 (Good) | 806 (Good) | 903 (Good) | 996 (Good) | 1 (Good) | 1 (Good) | 1 (Good) | 1 (Good) | 1 (Good) |
| no2 | 16 (Good) | 23 (Good) | 19 (Good) | 20 (Good) | 37 (Good) | 39 (Good) | 33 (Good) | 31 (Good) | 25 (Good) | 16 (Good) | 17 (Good) | 17 (Good) | 18 (Good) | 22 (Good) | 26 (Good) | 27 (Good) | 35 (Good) | 31 (Good) | 40 (Good) | 33 (Good) |
| o3 | 136 (Unhealthy for Sensitive Groups) | 120 (Unhealthy for Sensitive Groups) | 96 (Moderate) | 89 (Moderate) | 75 (Moderate) | 57 (Good) | 63 (Good) | 92 (Moderate) | 129 (Unhealthy for Sensitive Groups) | 97 (Moderate) | 164 (Unhealthy) | 173 (Unhealthy) | 160 (Unhealthy) | 117 (Moderate) | 102 (Moderate) | 79 (Moderate) | 66 (Good) | 60 (Good) | 70 (Moderate) | 86 (Moderate) |
| pm10 | 84 (Unhealthy) | 86 (Unhealthy) | 65 (Unhealthy for Sensitive Groups) | 65 (Unhealthy for Sensitive Groups) | 122 (Very Unhealthy) | 93 (Unhealthy) | 78 (Unhealthy for Sensitive Groups) | 79 (Unhealthy for Sensitive Groups) | 68 (Unhealthy for Sensitive Groups) | 39 (Moderate) | 53 (Unhealthy for Sensitive Groups) | 50 (Unhealthy for Sensitive Groups) | 70 (Unhealthy for Sensitive Groups) | 91 (Unhealthy) | 84 (Unhealthy) | 89 (Unhealthy) | 108 (Unhealthy) | 86 (Unhealthy) | 110 (Very Unhealthy) | 72 (Unhealthy for Sensitive Groups) |
| so2 | 14 (Good) | 16 (Good) | 14 (Good) | 20 (Good) | 35 (Good) | 32 (Good) | 22 (Good) | 17 (Good) | 14 (Good) | 7.5 (Good) | 6.3 (Good) | 12 (Good) | 13 (Good) | 18 (Good) | 21 (Good) | 28 (Good) | 38 (Good) | 31 (Good) | 32 (Good) | 17 (Good) |
PM10 6.7 (Good)
particulate matter (PM10) suspended dustPM2,5 1.7 (Good)
particulate matter (PM2.5) dustCO 100 (Good)
carbon monoxide (CO)NO2 7.6 (Good)
nitrogen dioxide (NO2)O3 0.02 (Good)
ozone (O3)SO2 8.6 (Good)
sulfur dioxide (SO2)八里堡
| index | 2022-05-27 |
|---|---|
| pm10 | 32 |
| pm25 | 24 |
| co | 468 |
| no2 | 21 |
| o3 | 32 |
| so2 | 4.6 |
八里堡

| index | 2020-05 | 2020-04 | 2020-03 | 2020-02 | 2020-01 | 2019-12 | 2019-11 | 2019-10 | 2019-09 | 2019-08 | 2019-07 | 2019-06 | 2019-05 | 2019-04 | 2019-03 | 2019-02 | 2019-01 | 2018-12 | 2018-11 | 2018-10 |
|---|---|---|---|---|---|---|---|---|---|---|---|---|---|---|---|---|---|---|---|---|
| pm25 | 27 | 35 | 30 | 44 | 95 | 67 | 39 | 34 | 28 | 18 | 27 | 28 | 32 | 35 | 41 | 46 | 61 | 43 | 59 | 34 |
| co | 845 | 807 | 835 | 1 | 1 | 1 | 1 | 943 | 958 | 746 | 919 | 840 | 806 | 903 | 996 | 1 | 1 | 1 | 1 | 1 |
| no2 | 16 | 23 | 19 | 20 | 37 | 39 | 33 | 31 | 25 | 16 | 17 | 17 | 18 | 22 | 26 | 27 | 35 | 31 | 40 | 33 |
| o3 | 136 | 120 | 96 | 89 | 75 | 57 | 63 | 92 | 129 | 97 | 164 | 173 | 160 | 117 | 102 | 79 | 66 | 60 | 70 | 86 |
| pm10 | 84 | 86 | 65 | 65 | 122 | 93 | 78 | 79 | 68 | 39 | 53 | 50 | 70 | 91 | 84 | 89 | 108 | 86 | 110 | 72 |
| so2 | 14 | 16 | 14 | 20 | 35 | 32 | 22 | 17 | 14 | 7.5 | 6.3 | 12 | 13 | 18 | 21 | 28 | 38 | 31 | 32 | 17 |