Air Pollution in Koubeicun: Real-time Air Quality Index and smog alert.
Pollution and air quality forecast for Koubeicun. Today is Tuesday, June 16, 2026. The following air pollution values have been recorded for Koubeicun:- particulate matter (PM10) suspended dust - 7 (Good)
- particulate matter (PM2.5) dust - 2 (Good)
- carbon monoxide (CO) - 100 (Good)
- nitrogen dioxide (NO2) - 8 (Good)
- ozone (O3) - 0 (Good)
- sulfur dioxide (SO2) - 9 (Good)

What is the air quality in Koubeicun today? Is the air polluted in Koubeicun?. Is there smog?
What is the level of PM10 today in Koubeicun? (particulate matter (PM10) suspended dust)
The current level of particulate matter PM10 in Koubeicun is:
7 (Good)
The highest PM10 values usually occur in month: 153 (January 2020).
The lowest value of particulate matter PM10 pollution in Koubeicun is usually recorded in: August (36).
What is the current level of PM2.5 in Koubeicun? (particulate matter (PM2.5) dust)
Today's PM2.5 level is:
2 (Good)
For comparison, the highest level of PM2.5 in Koubeicun in the last 7 days was: 24 (Friday, May 27, 2022) and the lowest: 24 (Friday, May 27, 2022).
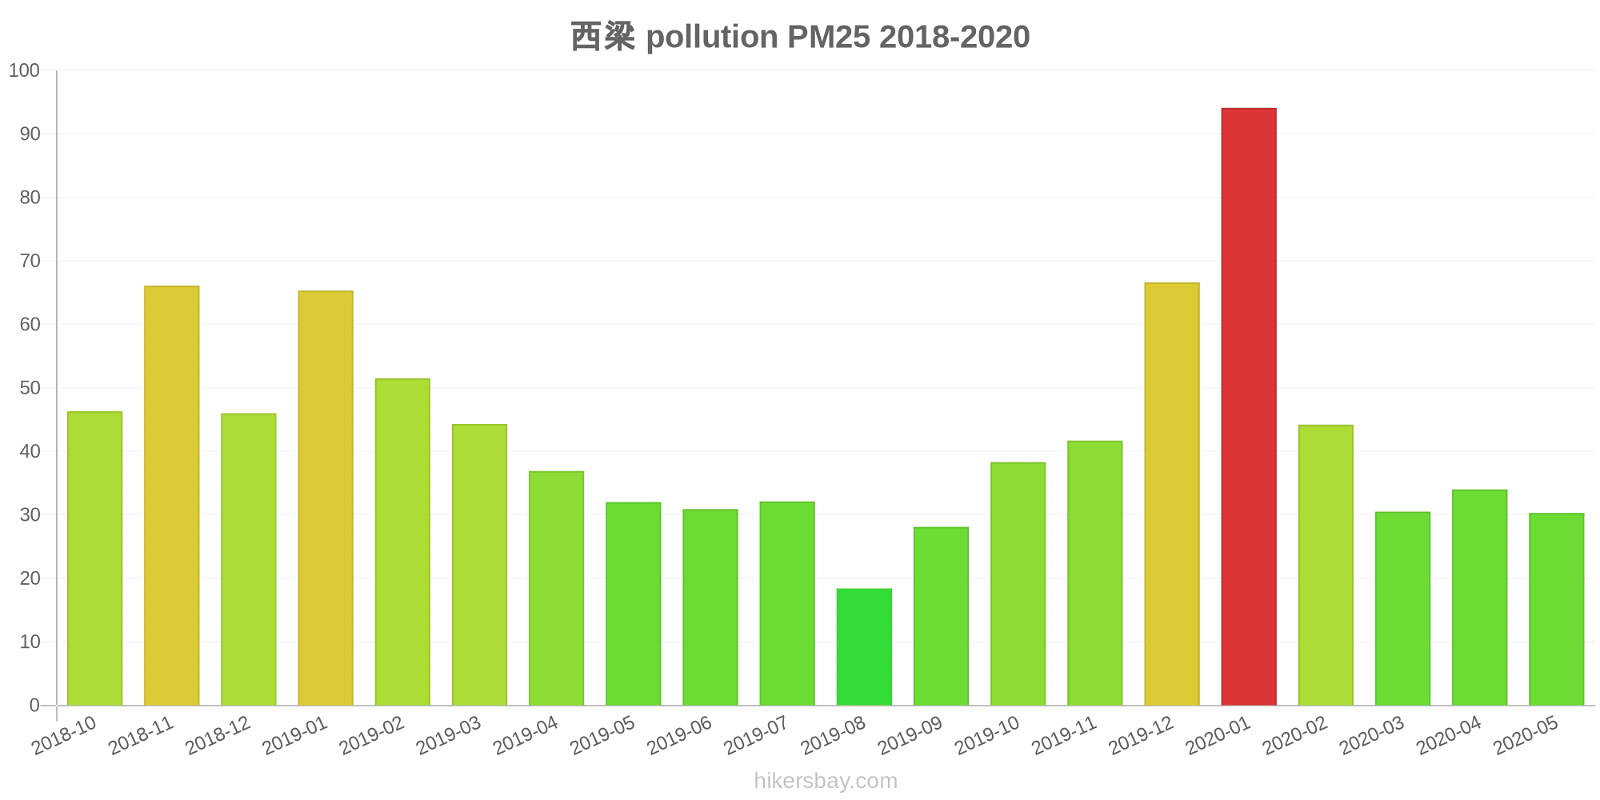
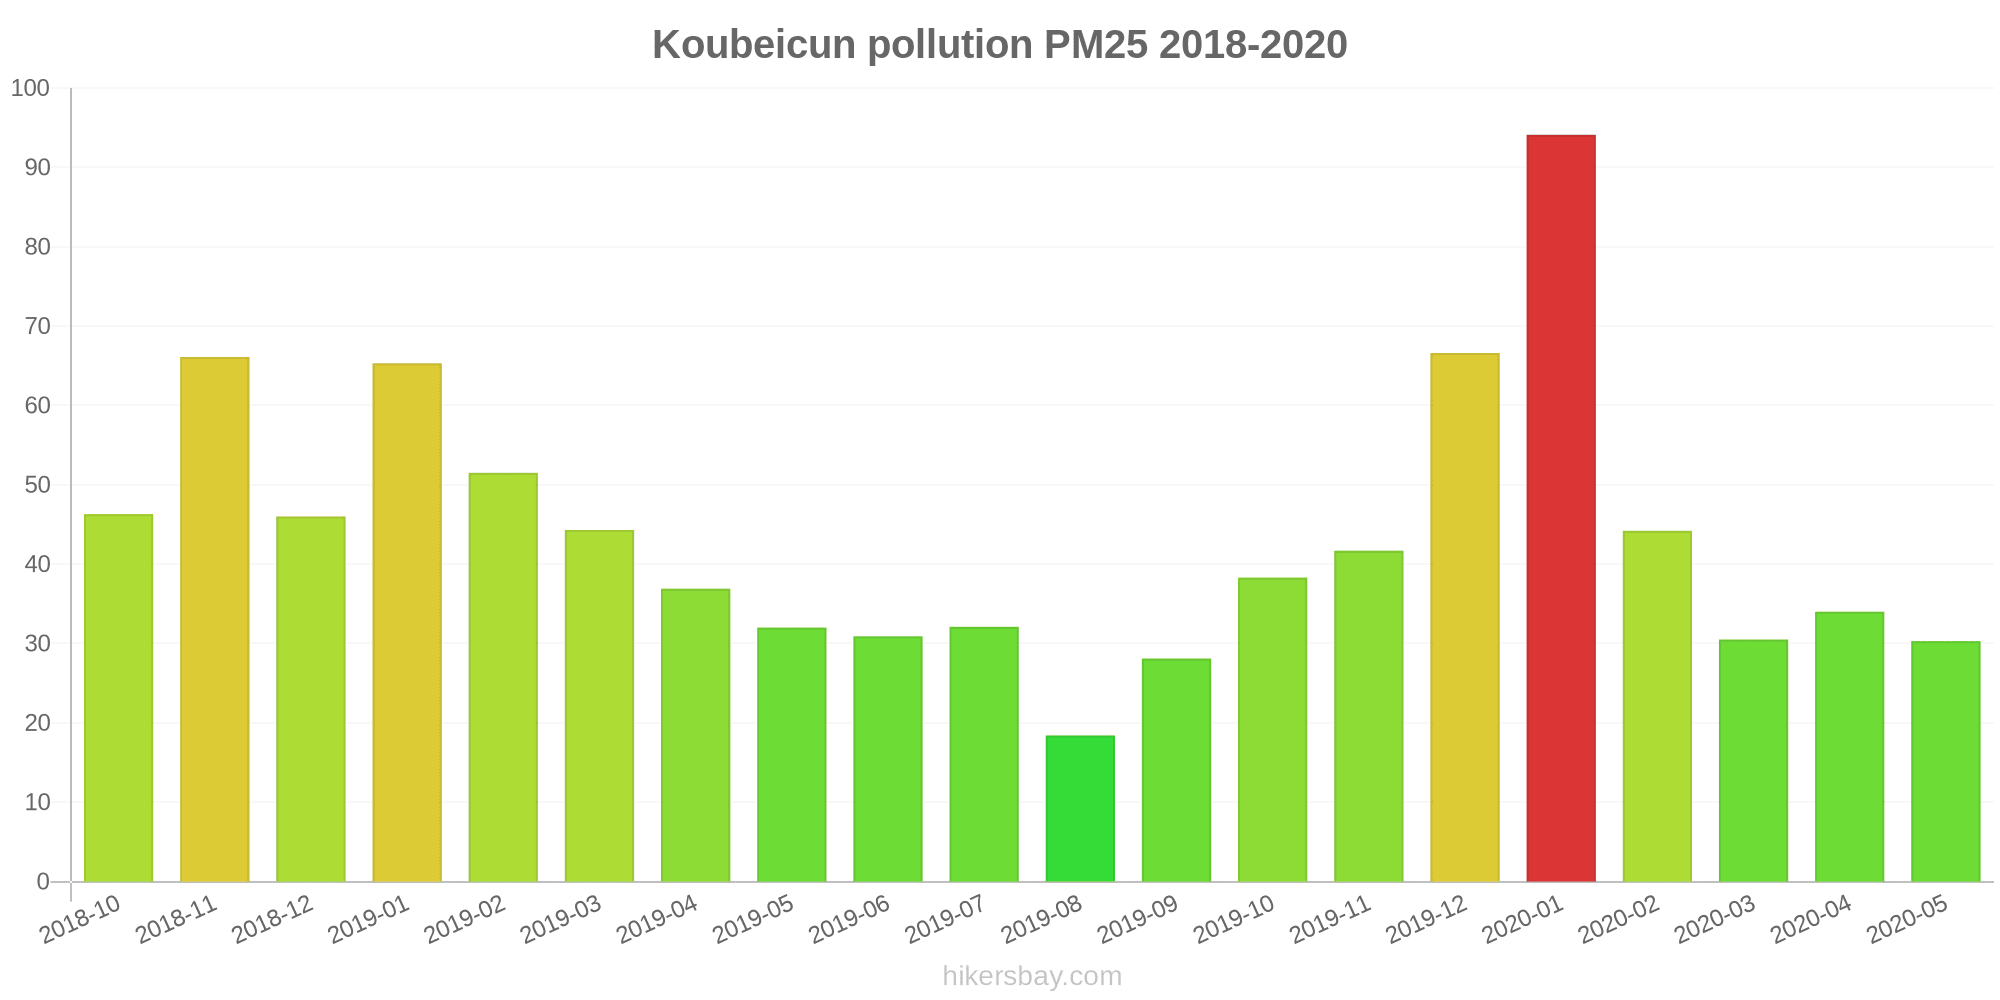
The highest PM2.5 values were recorded: 94 (January 2020).
The lowest level of particulate matter PM2.5 pollution occurs in month: August (18).
How high is the CO level? (carbon monoxide (CO))
100 (Good)
How high is the level of NO2? (nitrogen dioxide (NO2))
8 (Good)
How is the O3 level today in Koubeicun? (ozone (O3))
0 (Good)
What is the level of SO2 pollution? (sulfur dioxide (SO2))
9 (Good)
Current data Friday, May 27, 2022, 12:00 PM
PM10 7 (Good)
PM2,5 2 (Good)
CO 100 (Good)
NO2 8 (Good)
O3 0 (Good)
SO2 9 (Good)
Data on air pollution from recent days in Koubeicun
index
2022-05-27
pm10
32
Moderate
pm25
24
Moderate
co
468
Good
no2
21
Good
o3
32
Good
so2
5
Good
data source »
Air pollution in Koubeicun from October 2018 to May 2020

index
2020-05
2020-04
2020-03
2020-02
2020-01
2019-12
2019-11
2019-10
2019-09
2019-08
2019-07
2019-06
2019-05
2019-04
2019-03
2019-02
2019-01
2018-12
2018-11
2018-10
pm25
30 (Moderate)
34 (Moderate)
31 (Moderate)
44 (Unhealthy for Sensitive Groups)
94 (Very Unhealthy)
67 (Unhealthy)
42 (Unhealthy for Sensitive Groups)
38 (Unhealthy for Sensitive Groups)
28 (Moderate)
18 (Moderate)
32 (Moderate)
31 (Moderate)
32 (Moderate)
37 (Unhealthy for Sensitive Groups)
44 (Unhealthy for Sensitive Groups)
52 (Unhealthy for Sensitive Groups)
65 (Unhealthy)
46 (Unhealthy for Sensitive Groups)
66 (Unhealthy)
46 (Unhealthy for Sensitive Groups)
co
592 (Good)
815 (Good)
853 (Good)
1 (Good)
2 (Good)
1 (Good)
1 (Good)
896 (Good)
922 (Good)
740 (Good)
787 (Good)
772 (Good)
709 (Good)
809 (Good)
1 (Good)
1 (Good)
1 (Good)
1 (Good)
1 (Good)
977 (Good)
no2
14 (Good)
18 (Good)
20 (Good)
17 (Good)
36 (Good)
36 (Good)
31 (Good)
27 (Good)
20 (Good)
13 (Good)
17 (Good)
16 (Good)
18 (Good)
21 (Good)
25 (Good)
26 (Good)
35 (Good)
30 (Good)
35 (Good)
29 (Good)
o3
140 (Unhealthy for Sensitive Groups)
119 (Moderate)
97 (Moderate)
90 (Moderate)
72 (Moderate)
56 (Good)
65 (Good)
92 (Moderate)
133 (Unhealthy for Sensitive Groups)
103 (Moderate)
151 (Unhealthy)
154 (Unhealthy)
145 (Unhealthy for Sensitive Groups)
121 (Unhealthy for Sensitive Groups)
109 (Moderate)
83 (Moderate)
68 (Good)
62 (Good)
70 (Moderate)
85 (Moderate)
pm10
82 (Unhealthy)
85 (Unhealthy)
67 (Unhealthy for Sensitive Groups)
73 (Unhealthy for Sensitive Groups)
153 (Very bad Hazardous)
104 (Unhealthy)
79 (Unhealthy for Sensitive Groups)
73 (Unhealthy for Sensitive Groups)
58 (Unhealthy for Sensitive Groups)
36 (Moderate)
44 (Moderate)
38 (Moderate)
56 (Unhealthy for Sensitive Groups)
97 (Unhealthy)
90 (Unhealthy)
96 (Unhealthy)
113 (Very Unhealthy)
91 (Unhealthy)
125 (Very Unhealthy)
83 (Unhealthy)
so2
15 (Good)
15 (Good)
14 (Good)
19 (Good)
43 (Good)
37 (Good)
27 (Good)
18 (Good)
17 (Good)
13 (Good)
13 (Good)
16 (Good)
13 (Good)
20 (Good)
23 (Good)
36 (Good)
42 (Good)
35 (Good)
44 (Good)
19 (Good)
data source »
西梁
Friday, May 27, 2022, 12:00 PM
PM10 6.7 (Good)
particulate matter (PM10) suspended dust
PM2,5 1.7 (Good)
particulate matter (PM2.5) dust
CO 100 (Good)
carbon monoxide (CO)
NO2 7.6 (Good)
nitrogen dioxide (NO2)
O3 0.02 (Good)
ozone (O3)
SO2 8.6 (Good)
sulfur dioxide (SO2)
西梁
index
2022-05-27
pm10
32
pm25
24
co
468
no2
21
o3
32
so2
4.6
西梁
2018-10 2020-05
index
2020-05
2020-04
2020-03
2020-02
2020-01
2019-12
2019-11
2019-10
2019-09
2019-08
2019-07
2019-06
2019-05
2019-04
2019-03
2019-02
2019-01
2018-12
2018-11
2018-10
pm25
30
34
31
44
94
67
42
38
28
18
32
31
32
37
44
52
65
46
66
46
co
592
815
853
1
2
1
1
896
922
740
787
772
709
809
1
1
1
1
1
977
no2
14
18
20
17
36
36
31
27
20
13
17
16
18
21
25
26
35
30
35
29
o3
140
119
97
90
72
56
65
92
133
103
151
154
145
121
109
83
68
62
70
85
pm10
82
85
67
73
153
104
79
73
58
36
44
38
56
97
90
96
113
91
125
83
so2
15
15
14
19
43
37
27
18
17
13
13
16
13
20
23
36
42
35
44
19
* Pollution data source:
https://openaq.org
(ChinaAQIData)
The data is licensed under CC-By 4.0
PM10 7 (Good)
PM2,5 2 (Good)
CO 100 (Good)
NO2 8 (Good)
O3 0 (Good)
SO2 9 (Good)
Data on air pollution from recent days in Koubeicun
| index | 2022-05-27 |
|---|---|
| pm10 | 32 Moderate |
| pm25 | 24 Moderate |
| co | 468 Good |
| no2 | 21 Good |
| o3 | 32 Good |
| so2 | 5 Good |
| index | 2020-05 | 2020-04 | 2020-03 | 2020-02 | 2020-01 | 2019-12 | 2019-11 | 2019-10 | 2019-09 | 2019-08 | 2019-07 | 2019-06 | 2019-05 | 2019-04 | 2019-03 | 2019-02 | 2019-01 | 2018-12 | 2018-11 | 2018-10 |
|---|---|---|---|---|---|---|---|---|---|---|---|---|---|---|---|---|---|---|---|---|
| pm25 | 30 (Moderate) | 34 (Moderate) | 31 (Moderate) | 44 (Unhealthy for Sensitive Groups) | 94 (Very Unhealthy) | 67 (Unhealthy) | 42 (Unhealthy for Sensitive Groups) | 38 (Unhealthy for Sensitive Groups) | 28 (Moderate) | 18 (Moderate) | 32 (Moderate) | 31 (Moderate) | 32 (Moderate) | 37 (Unhealthy for Sensitive Groups) | 44 (Unhealthy for Sensitive Groups) | 52 (Unhealthy for Sensitive Groups) | 65 (Unhealthy) | 46 (Unhealthy for Sensitive Groups) | 66 (Unhealthy) | 46 (Unhealthy for Sensitive Groups) |
| co | 592 (Good) | 815 (Good) | 853 (Good) | 1 (Good) | 2 (Good) | 1 (Good) | 1 (Good) | 896 (Good) | 922 (Good) | 740 (Good) | 787 (Good) | 772 (Good) | 709 (Good) | 809 (Good) | 1 (Good) | 1 (Good) | 1 (Good) | 1 (Good) | 1 (Good) | 977 (Good) |
| no2 | 14 (Good) | 18 (Good) | 20 (Good) | 17 (Good) | 36 (Good) | 36 (Good) | 31 (Good) | 27 (Good) | 20 (Good) | 13 (Good) | 17 (Good) | 16 (Good) | 18 (Good) | 21 (Good) | 25 (Good) | 26 (Good) | 35 (Good) | 30 (Good) | 35 (Good) | 29 (Good) |
| o3 | 140 (Unhealthy for Sensitive Groups) | 119 (Moderate) | 97 (Moderate) | 90 (Moderate) | 72 (Moderate) | 56 (Good) | 65 (Good) | 92 (Moderate) | 133 (Unhealthy for Sensitive Groups) | 103 (Moderate) | 151 (Unhealthy) | 154 (Unhealthy) | 145 (Unhealthy for Sensitive Groups) | 121 (Unhealthy for Sensitive Groups) | 109 (Moderate) | 83 (Moderate) | 68 (Good) | 62 (Good) | 70 (Moderate) | 85 (Moderate) |
| pm10 | 82 (Unhealthy) | 85 (Unhealthy) | 67 (Unhealthy for Sensitive Groups) | 73 (Unhealthy for Sensitive Groups) | 153 (Very bad Hazardous) | 104 (Unhealthy) | 79 (Unhealthy for Sensitive Groups) | 73 (Unhealthy for Sensitive Groups) | 58 (Unhealthy for Sensitive Groups) | 36 (Moderate) | 44 (Moderate) | 38 (Moderate) | 56 (Unhealthy for Sensitive Groups) | 97 (Unhealthy) | 90 (Unhealthy) | 96 (Unhealthy) | 113 (Very Unhealthy) | 91 (Unhealthy) | 125 (Very Unhealthy) | 83 (Unhealthy) |
| so2 | 15 (Good) | 15 (Good) | 14 (Good) | 19 (Good) | 43 (Good) | 37 (Good) | 27 (Good) | 18 (Good) | 17 (Good) | 13 (Good) | 13 (Good) | 16 (Good) | 13 (Good) | 20 (Good) | 23 (Good) | 36 (Good) | 42 (Good) | 35 (Good) | 44 (Good) | 19 (Good) |
PM10 6.7 (Good)
particulate matter (PM10) suspended dustPM2,5 1.7 (Good)
particulate matter (PM2.5) dustCO 100 (Good)
carbon monoxide (CO)NO2 7.6 (Good)
nitrogen dioxide (NO2)O3 0.02 (Good)
ozone (O3)SO2 8.6 (Good)
sulfur dioxide (SO2)西梁
| index | 2022-05-27 |
|---|---|
| pm10 | 32 |
| pm25 | 24 |
| co | 468 |
| no2 | 21 |
| o3 | 32 |
| so2 | 4.6 |
西梁

| index | 2020-05 | 2020-04 | 2020-03 | 2020-02 | 2020-01 | 2019-12 | 2019-11 | 2019-10 | 2019-09 | 2019-08 | 2019-07 | 2019-06 | 2019-05 | 2019-04 | 2019-03 | 2019-02 | 2019-01 | 2018-12 | 2018-11 | 2018-10 |
|---|---|---|---|---|---|---|---|---|---|---|---|---|---|---|---|---|---|---|---|---|
| pm25 | 30 | 34 | 31 | 44 | 94 | 67 | 42 | 38 | 28 | 18 | 32 | 31 | 32 | 37 | 44 | 52 | 65 | 46 | 66 | 46 |
| co | 592 | 815 | 853 | 1 | 2 | 1 | 1 | 896 | 922 | 740 | 787 | 772 | 709 | 809 | 1 | 1 | 1 | 1 | 1 | 977 |
| no2 | 14 | 18 | 20 | 17 | 36 | 36 | 31 | 27 | 20 | 13 | 17 | 16 | 18 | 21 | 25 | 26 | 35 | 30 | 35 | 29 |
| o3 | 140 | 119 | 97 | 90 | 72 | 56 | 65 | 92 | 133 | 103 | 151 | 154 | 145 | 121 | 109 | 83 | 68 | 62 | 70 | 85 |
| pm10 | 82 | 85 | 67 | 73 | 153 | 104 | 79 | 73 | 58 | 36 | 44 | 38 | 56 | 97 | 90 | 96 | 113 | 91 | 125 | 83 |
| so2 | 15 | 15 | 14 | 19 | 43 | 37 | 27 | 18 | 17 | 13 | 13 | 16 | 13 | 20 | 23 | 36 | 42 | 35 | 44 | 19 |