Air Pollution in Dazhangcun: Real-time Air Quality Index and smog alert.
Pollution and air quality forecast for Dazhangcun. Today is Tuesday, June 16, 2026. The following air pollution values have been recorded for Dazhangcun:- particulate matter (PM10) suspended dust - 53 (Unhealthy for Sensitive Groups)
- ozone (O3) - 0 (Good)
- particulate matter (PM2.5) dust - 7 (Good)
- sulfur dioxide (SO2) - 18 (Good)
- nitrogen dioxide (NO2) - 3 (Good)
- carbon monoxide (CO) - 1 (Good)

What is the air quality in Dazhangcun today? Is the air polluted in Dazhangcun?. Is there smog?
What is the level of PM10 today in Dazhangcun? (particulate matter (PM10) suspended dust)
The current level of particulate matter PM10 in Dazhangcun is:
53 (Unhealthy for Sensitive Groups)
The highest PM10 values usually occur in month: 155 (February 2019).
The lowest value of particulate matter PM10 pollution in Dazhangcun is usually recorded in: August (64).
How is the O3 level today in Dazhangcun? (ozone (O3))
0 (Good)
What is the current level of PM2.5 in Dazhangcun? (particulate matter (PM2.5) dust)
Today's PM2.5 level is:
7 (Good)
For comparison, the highest level of PM2.5 in Dazhangcun in the last 7 days was: 21 (Friday, May 27, 2022) and the lowest: 21 (Friday, May 27, 2022).
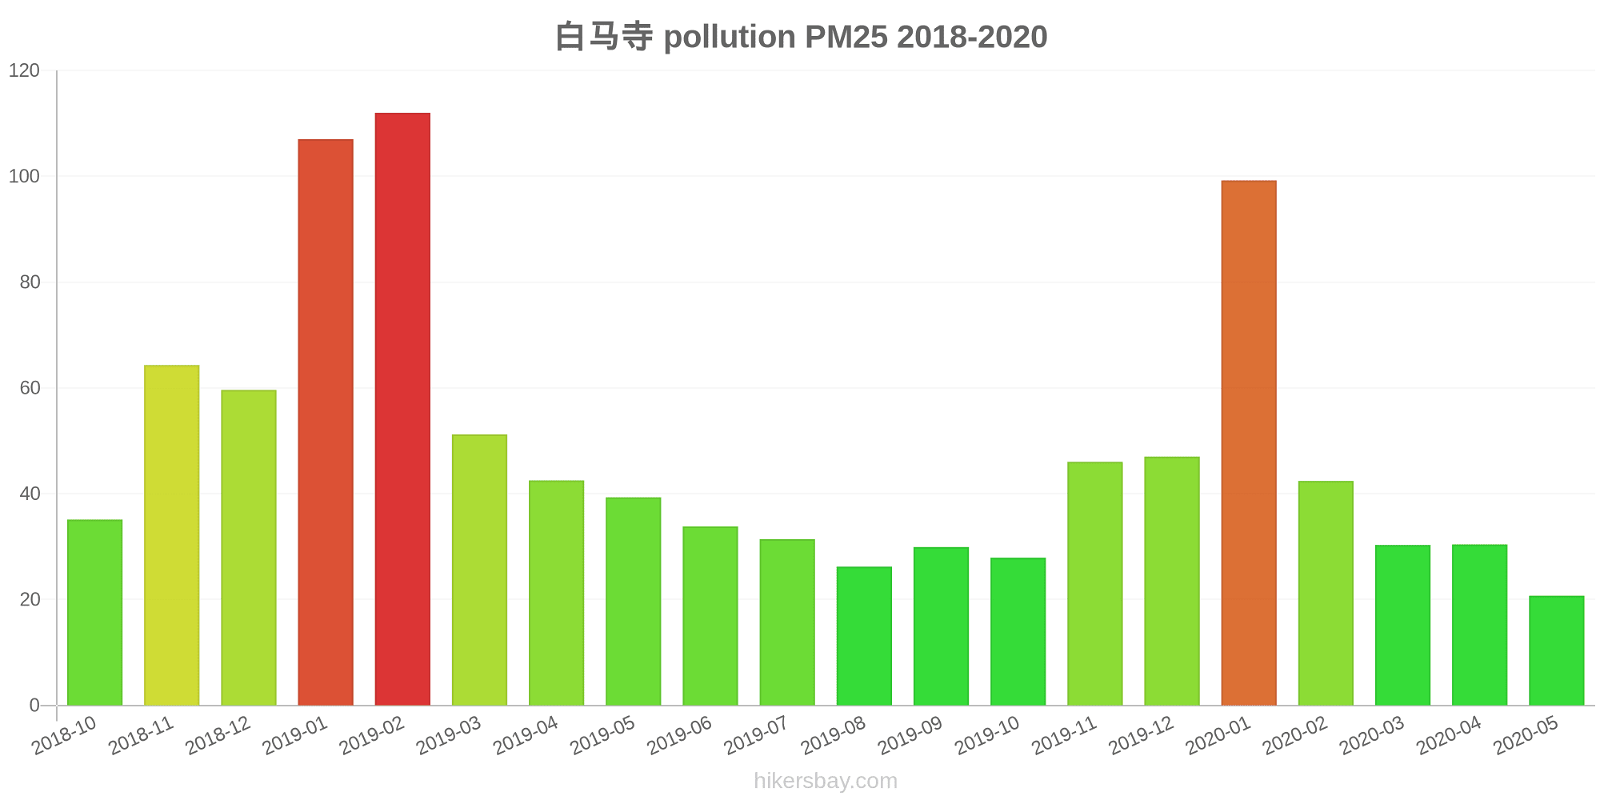
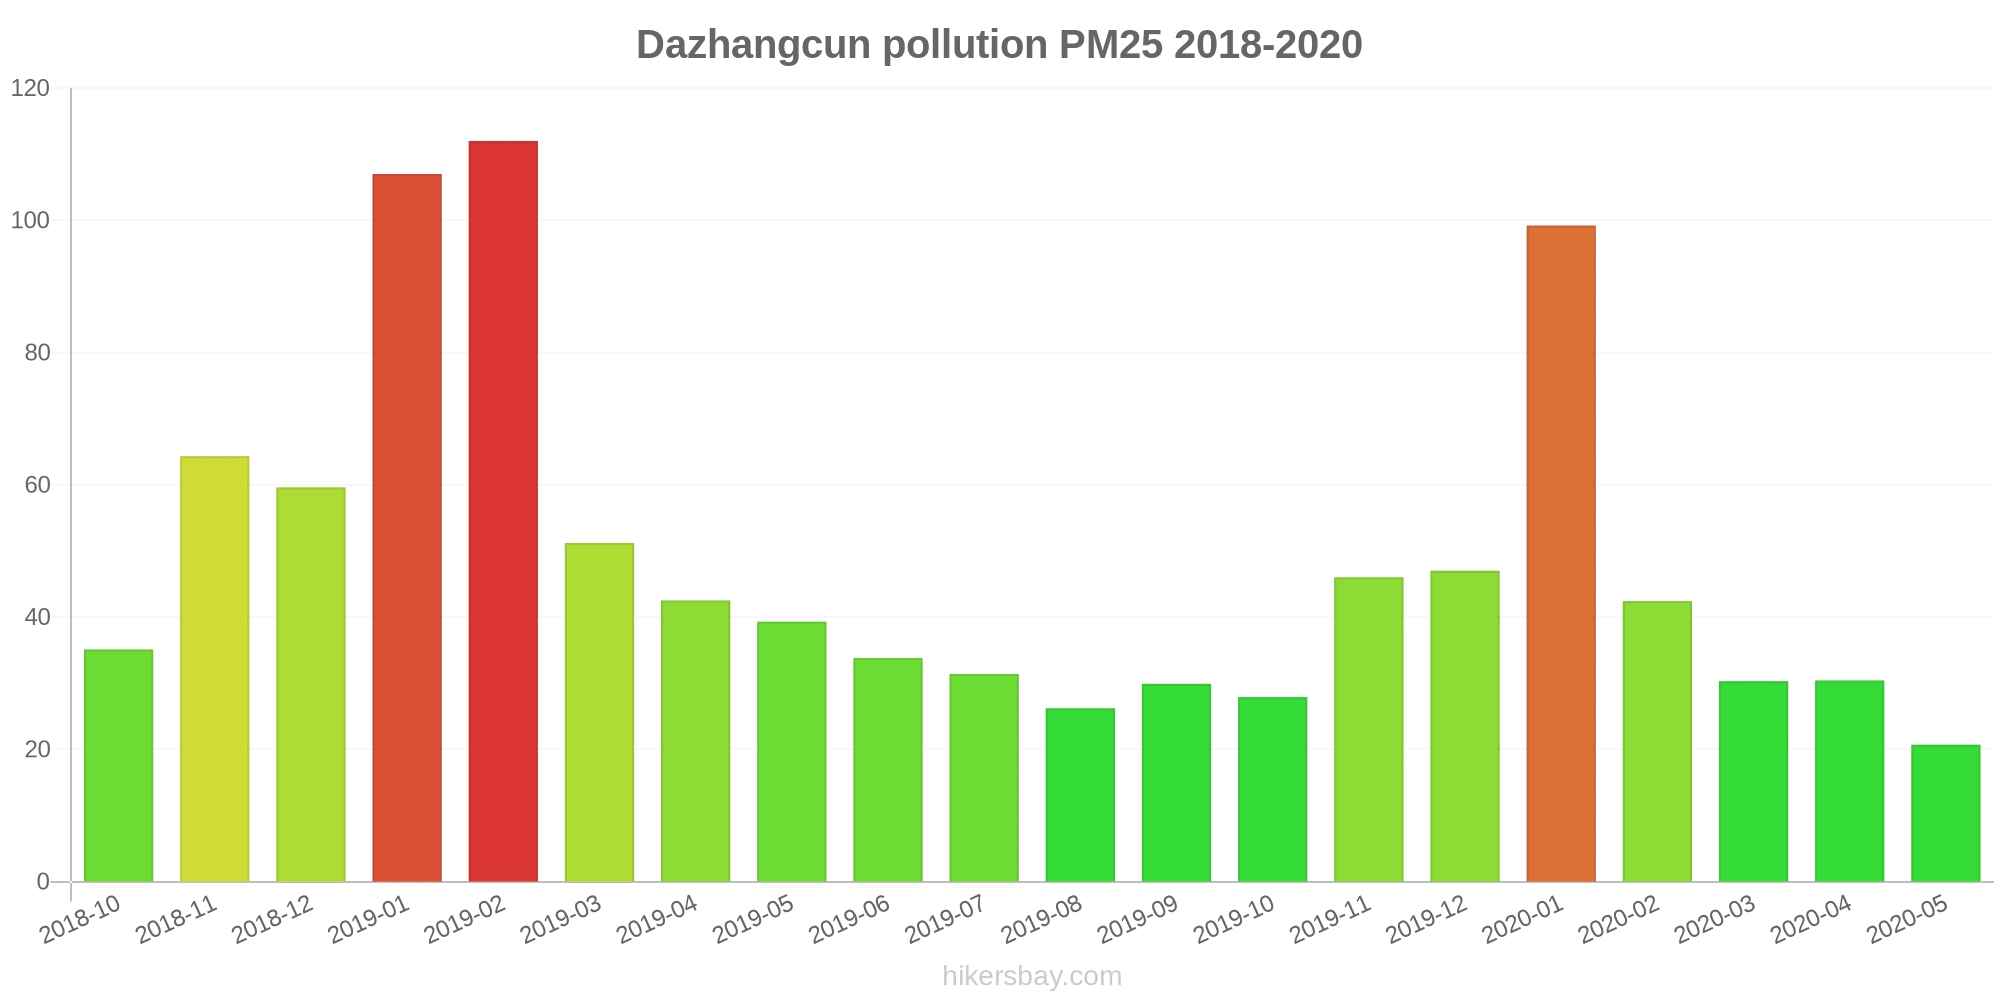
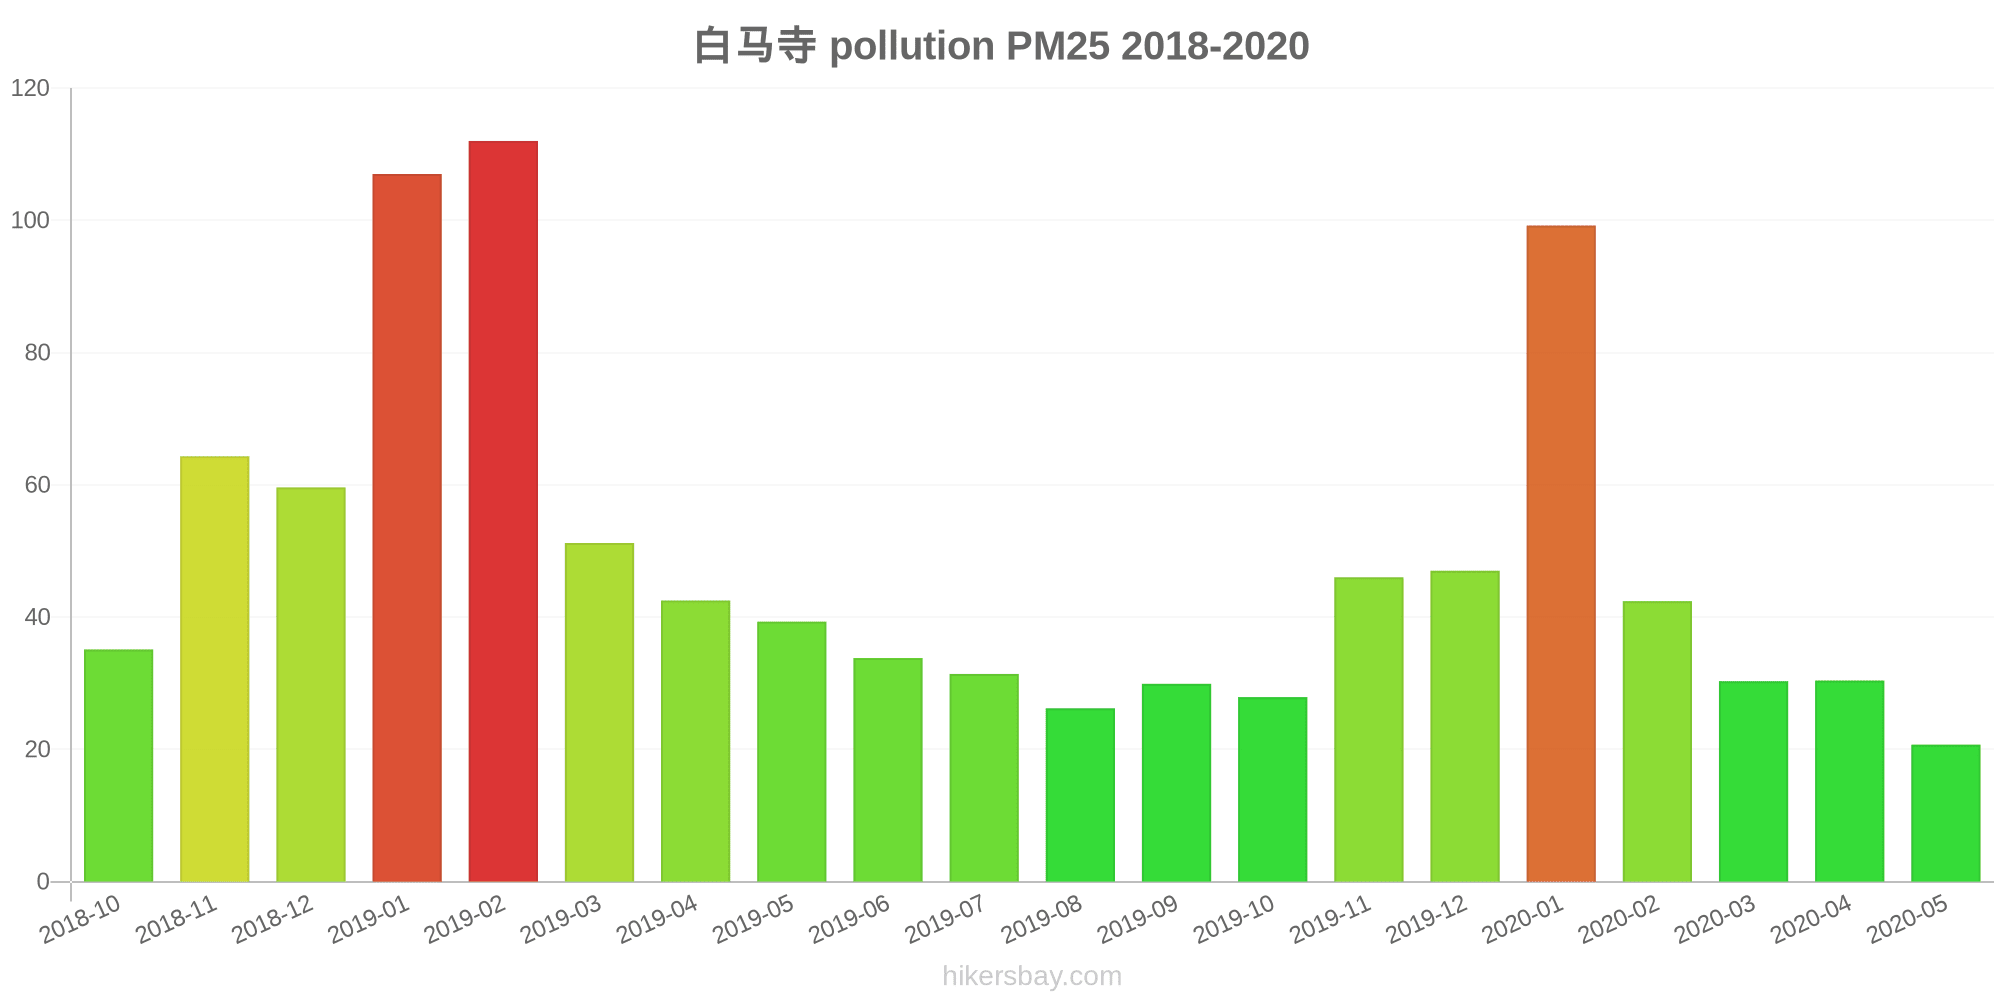
The highest PM2.5 values were recorded: 112 (February 2019).
The lowest level of particulate matter PM2.5 pollution occurs in month: May (21).
What is the level of SO2 pollution? (sulfur dioxide (SO2))
18 (Good)
How high is the level of NO2? (nitrogen dioxide (NO2))
3 (Good)
How high is the CO level? (carbon monoxide (CO))
1 (Good)
Current data Friday, May 27, 2022, 12:00 PM
PM10 53 (Unhealthy for Sensitive Groups)
O3 0 (Good)
PM2,5 7 (Good)
SO2 18 (Good)
NO2 3 (Good)
CO 1 (Good)
Data on air pollution from recent days in Dazhangcun
index
2022-05-27
pm10
51
Unhealthy for Sensitive Groups
o3
0
Good
pm25
21
Moderate
so2
10
Good
no2
0
Good
co
1
Good
data source »
Air pollution in Dazhangcun from October 2018 to May 2020

index
2020-05
2020-04
2020-03
2020-02
2020-01
2019-12
2019-11
2019-10
2019-09
2019-08
2019-07
2019-06
2019-05
2019-04
2019-03
2019-02
2019-01
2018-12
2018-11
2018-10
pm25
21 (Moderate)
30 (Moderate)
30 (Moderate)
42 (Unhealthy for Sensitive Groups)
99 (Very Unhealthy)
47 (Unhealthy for Sensitive Groups)
46 (Unhealthy for Sensitive Groups)
28 (Moderate)
30 (Moderate)
26 (Moderate)
31 (Moderate)
34 (Moderate)
39 (Unhealthy for Sensitive Groups)
43 (Unhealthy for Sensitive Groups)
51 (Unhealthy for Sensitive Groups)
112 (Very bad Hazardous)
107 (Very Unhealthy)
60 (Unhealthy)
64 (Unhealthy)
35 (Unhealthy for Sensitive Groups)
co
1 (Good)
1 (Good)
1 (Good)
1 (Good)
1 (Good)
1 (Good)
1 (Good)
857 (Good)
940 (Good)
998 (Good)
867 (Good)
767 (Good)
1 (Good)
1 (Good)
1 (Good)
1 (Good)
1 (Good)
1 (Good)
1 (Good)
818 (Good)
no2
16 (Good)
22 (Good)
17 (Good)
17 (Good)
29 (Good)
26 (Good)
30 (Good)
21 (Good)
17 (Good)
12 (Good)
15 (Good)
18 (Good)
21 (Good)
21 (Good)
23 (Good)
21 (Good)
41 (Moderate)
30 (Good)
28 (Good)
24 (Good)
o3
156 (Unhealthy)
136 (Unhealthy for Sensitive Groups)
107 (Moderate)
103 (Moderate)
95 (Moderate)
77 (Moderate)
90 (Moderate)
111 (Moderate)
163 (Unhealthy)
172 (Unhealthy)
194 (Very Unhealthy)
210 (Very Unhealthy)
163 (Unhealthy)
140 (Unhealthy for Sensitive Groups)
137 (Unhealthy for Sensitive Groups)
113 (Moderate)
92 (Moderate)
74 (Moderate)
103 (Moderate)
126 (Unhealthy for Sensitive Groups)
pm10
74 (Unhealthy for Sensitive Groups)
94 (Unhealthy)
95 (Unhealthy)
92 (Unhealthy)
146 (Very Unhealthy)
100 (Unhealthy)
118 (Very Unhealthy)
87 (Unhealthy)
79 (Unhealthy for Sensitive Groups)
64 (Unhealthy for Sensitive Groups)
70 (Unhealthy for Sensitive Groups)
78 (Unhealthy for Sensitive Groups)
100 (Unhealthy)
109 (Unhealthy)
104 (Unhealthy)
155 (Very bad Hazardous)
147 (Very Unhealthy)
114 (Very Unhealthy)
124 (Very Unhealthy)
83 (Unhealthy)
so2
8.4 (Good)
12 (Good)
11 (Good)
13 (Good)
16 (Good)
14 (Good)
13 (Good)
9.1 (Good)
11 (Good)
10 (Good)
12 (Good)
11 (Good)
18 (Good)
14 (Good)
14 (Good)
13 (Good)
28 (Good)
20 (Good)
16 (Good)
12 (Good)
data source »
白马寺
Friday, May 27, 2022, 12:00 PM
PM10 53 (Unhealthy for Sensitive Groups)
particulate matter (PM10) suspended dust
O3 0.02 (Good)
ozone (O3)
PM2,5 6.6 (Good)
particulate matter (PM2.5) dust
SO2 18 (Good)
sulfur dioxide (SO2)
NO2 3 (Good)
nitrogen dioxide (NO2)
CO 1.3 (Good)
carbon monoxide (CO)
白马寺
index
2022-05-27
pm10
51
o3
0.02
pm25
21
so2
9.6
no2
0.38
co
0.64
白马寺
2018-10 2020-05
index
2020-05
2020-04
2020-03
2020-02
2020-01
2019-12
2019-11
2019-10
2019-09
2019-08
2019-07
2019-06
2019-05
2019-04
2019-03
2019-02
2019-01
2018-12
2018-11
2018-10
pm25
21
30
30
42
99
47
46
28
30
26
31
34
39
43
51
112
107
60
64
35
co
1
1
1
1
1
1
1
857
940
998
867
767
1
1
1
1
1
1
1
818
no2
16
22
17
17
29
26
30
21
17
12
15
18
21
21
23
21
41
30
28
24
o3
156
136
107
103
95
77
90
111
163
172
194
210
163
140
137
113
92
74
103
126
pm10
74
94
95
92
146
100
118
87
79
64
70
78
100
109
104
155
147
114
124
83
so2
8.4
12
11
13
16
14
13
9.1
11
10
12
11
18
14
14
13
28
20
16
12
* Pollution data source:
https://openaq.org
(ChinaAQIData)
The data is licensed under CC-By 4.0
PM10 53 (Unhealthy for Sensitive Groups)
O3 0 (Good)
PM2,5 7 (Good)
SO2 18 (Good)
NO2 3 (Good)
CO 1 (Good)
Data on air pollution from recent days in Dazhangcun
| index | 2022-05-27 |
|---|---|
| pm10 | 51 Unhealthy for Sensitive Groups |
| o3 | 0 Good |
| pm25 | 21 Moderate |
| so2 | 10 Good |
| no2 | 0 Good |
| co | 1 Good |
| index | 2020-05 | 2020-04 | 2020-03 | 2020-02 | 2020-01 | 2019-12 | 2019-11 | 2019-10 | 2019-09 | 2019-08 | 2019-07 | 2019-06 | 2019-05 | 2019-04 | 2019-03 | 2019-02 | 2019-01 | 2018-12 | 2018-11 | 2018-10 |
|---|---|---|---|---|---|---|---|---|---|---|---|---|---|---|---|---|---|---|---|---|
| pm25 | 21 (Moderate) | 30 (Moderate) | 30 (Moderate) | 42 (Unhealthy for Sensitive Groups) | 99 (Very Unhealthy) | 47 (Unhealthy for Sensitive Groups) | 46 (Unhealthy for Sensitive Groups) | 28 (Moderate) | 30 (Moderate) | 26 (Moderate) | 31 (Moderate) | 34 (Moderate) | 39 (Unhealthy for Sensitive Groups) | 43 (Unhealthy for Sensitive Groups) | 51 (Unhealthy for Sensitive Groups) | 112 (Very bad Hazardous) | 107 (Very Unhealthy) | 60 (Unhealthy) | 64 (Unhealthy) | 35 (Unhealthy for Sensitive Groups) |
| co | 1 (Good) | 1 (Good) | 1 (Good) | 1 (Good) | 1 (Good) | 1 (Good) | 1 (Good) | 857 (Good) | 940 (Good) | 998 (Good) | 867 (Good) | 767 (Good) | 1 (Good) | 1 (Good) | 1 (Good) | 1 (Good) | 1 (Good) | 1 (Good) | 1 (Good) | 818 (Good) |
| no2 | 16 (Good) | 22 (Good) | 17 (Good) | 17 (Good) | 29 (Good) | 26 (Good) | 30 (Good) | 21 (Good) | 17 (Good) | 12 (Good) | 15 (Good) | 18 (Good) | 21 (Good) | 21 (Good) | 23 (Good) | 21 (Good) | 41 (Moderate) | 30 (Good) | 28 (Good) | 24 (Good) |
| o3 | 156 (Unhealthy) | 136 (Unhealthy for Sensitive Groups) | 107 (Moderate) | 103 (Moderate) | 95 (Moderate) | 77 (Moderate) | 90 (Moderate) | 111 (Moderate) | 163 (Unhealthy) | 172 (Unhealthy) | 194 (Very Unhealthy) | 210 (Very Unhealthy) | 163 (Unhealthy) | 140 (Unhealthy for Sensitive Groups) | 137 (Unhealthy for Sensitive Groups) | 113 (Moderate) | 92 (Moderate) | 74 (Moderate) | 103 (Moderate) | 126 (Unhealthy for Sensitive Groups) |
| pm10 | 74 (Unhealthy for Sensitive Groups) | 94 (Unhealthy) | 95 (Unhealthy) | 92 (Unhealthy) | 146 (Very Unhealthy) | 100 (Unhealthy) | 118 (Very Unhealthy) | 87 (Unhealthy) | 79 (Unhealthy for Sensitive Groups) | 64 (Unhealthy for Sensitive Groups) | 70 (Unhealthy for Sensitive Groups) | 78 (Unhealthy for Sensitive Groups) | 100 (Unhealthy) | 109 (Unhealthy) | 104 (Unhealthy) | 155 (Very bad Hazardous) | 147 (Very Unhealthy) | 114 (Very Unhealthy) | 124 (Very Unhealthy) | 83 (Unhealthy) |
| so2 | 8.4 (Good) | 12 (Good) | 11 (Good) | 13 (Good) | 16 (Good) | 14 (Good) | 13 (Good) | 9.1 (Good) | 11 (Good) | 10 (Good) | 12 (Good) | 11 (Good) | 18 (Good) | 14 (Good) | 14 (Good) | 13 (Good) | 28 (Good) | 20 (Good) | 16 (Good) | 12 (Good) |
PM10 53 (Unhealthy for Sensitive Groups)
particulate matter (PM10) suspended dustO3 0.02 (Good)
ozone (O3)PM2,5 6.6 (Good)
particulate matter (PM2.5) dustSO2 18 (Good)
sulfur dioxide (SO2)NO2 3 (Good)
nitrogen dioxide (NO2)CO 1.3 (Good)
carbon monoxide (CO)白马寺
| index | 2022-05-27 |
|---|---|
| pm10 | 51 |
| o3 | 0.02 |
| pm25 | 21 |
| so2 | 9.6 |
| no2 | 0.38 |
| co | 0.64 |
白马寺
| index | 2020-05 | 2020-04 | 2020-03 | 2020-02 | 2020-01 | 2019-12 | 2019-11 | 2019-10 | 2019-09 | 2019-08 | 2019-07 | 2019-06 | 2019-05 | 2019-04 | 2019-03 | 2019-02 | 2019-01 | 2018-12 | 2018-11 | 2018-10 |
|---|---|---|---|---|---|---|---|---|---|---|---|---|---|---|---|---|---|---|---|---|
| pm25 | 21 | 30 | 30 | 42 | 99 | 47 | 46 | 28 | 30 | 26 | 31 | 34 | 39 | 43 | 51 | 112 | 107 | 60 | 64 | 35 |
| co | 1 | 1 | 1 | 1 | 1 | 1 | 1 | 857 | 940 | 998 | 867 | 767 | 1 | 1 | 1 | 1 | 1 | 1 | 1 | 818 |
| no2 | 16 | 22 | 17 | 17 | 29 | 26 | 30 | 21 | 17 | 12 | 15 | 18 | 21 | 21 | 23 | 21 | 41 | 30 | 28 | 24 |
| o3 | 156 | 136 | 107 | 103 | 95 | 77 | 90 | 111 | 163 | 172 | 194 | 210 | 163 | 140 | 137 | 113 | 92 | 74 | 103 | 126 |
| pm10 | 74 | 94 | 95 | 92 | 146 | 100 | 118 | 87 | 79 | 64 | 70 | 78 | 100 | 109 | 104 | 155 | 147 | 114 | 124 | 83 |
| so2 | 8.4 | 12 | 11 | 13 | 16 | 14 | 13 | 9.1 | 11 | 10 | 12 | 11 | 18 | 14 | 14 | 13 | 28 | 20 | 16 | 12 |