Air Pollution in Wanglong: Real-time Air Quality Index and smog alert.
Pollution and air quality forecast for Wanglong. Today is Tuesday, June 16, 2026. The following air pollution values have been recorded for Wanglong:- particulate matter (PM2.5) dust - 61 (Unhealthy)
- nitrogen dioxide (NO2) - 22 (Good)
- particulate matter (PM10) suspended dust - 69 (Unhealthy for Sensitive Groups)
- carbon monoxide (CO) - 219 (Good)
- ozone (O3) - 0 (Good)
- sulfur dioxide (SO2) - 8 (Good)

What is the air quality in Wanglong today? Is the air polluted in Wanglong?. Is there smog?
What is the current level of PM2.5 in Wanglong? (particulate matter (PM2.5) dust)
Today's PM2.5 level is:
61 (Unhealthy)
For comparison, the highest level of PM2.5 in Wanglong in the last 7 days was: 28 (Friday, May 27, 2022) and the lowest: 28 (Friday, May 27, 2022).
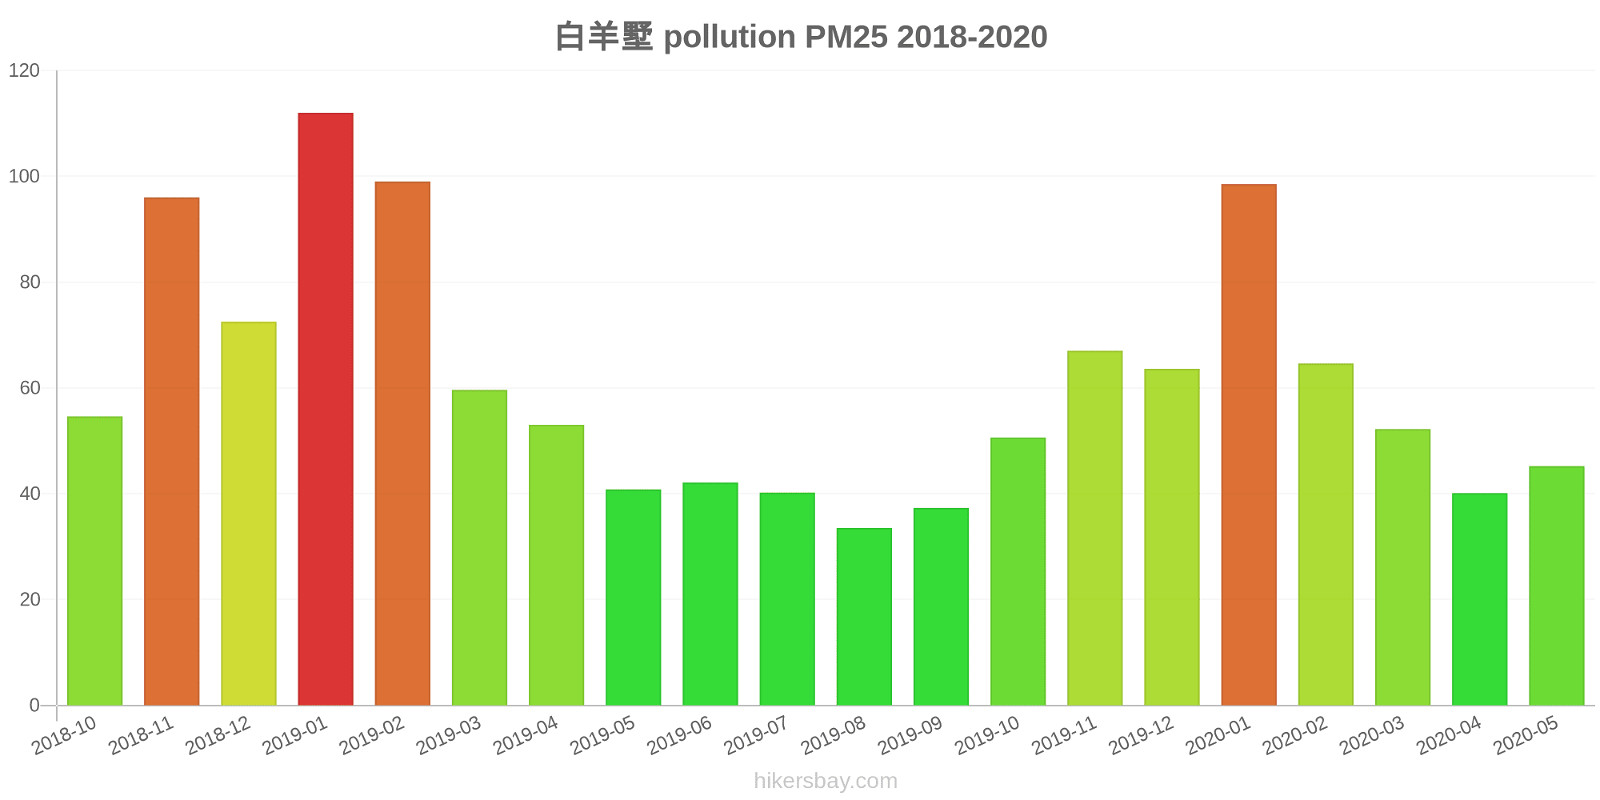
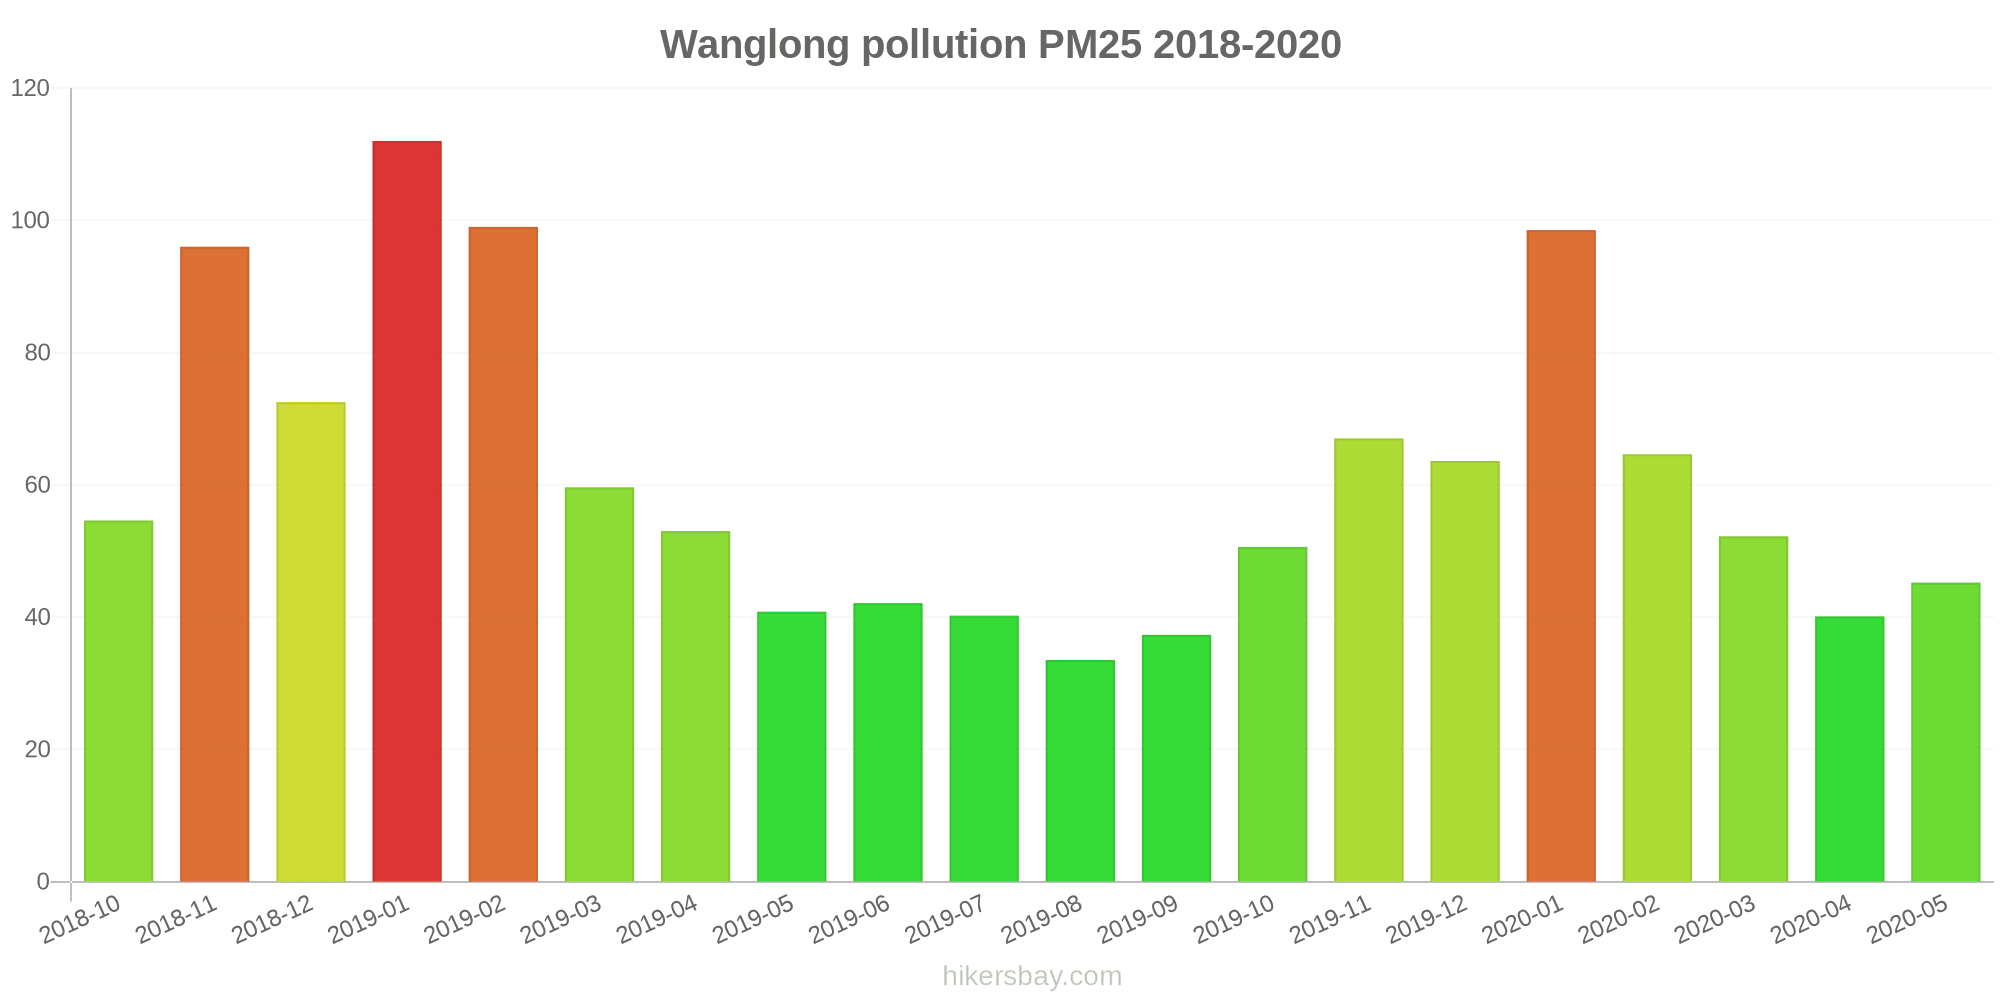
The highest PM2.5 values were recorded: 112 (January 2019).
The lowest level of particulate matter PM2.5 pollution occurs in month: August (34).
How high is the level of NO2? (nitrogen dioxide (NO2))
22 (Good)
What is the level of PM10 today in Wanglong? (particulate matter (PM10) suspended dust)
The current level of particulate matter PM10 in Wanglong is:
69 (Unhealthy for Sensitive Groups)
The highest PM10 values usually occur in month: 208 (November 2018).
The lowest value of particulate matter PM10 pollution in Wanglong is usually recorded in: August (73).
How high is the CO level? (carbon monoxide (CO))
219 (Good)
How is the O3 level today in Wanglong? (ozone (O3))
0 (Good)
What is the level of SO2 pollution? (sulfur dioxide (SO2))
8 (Good)
Current data Friday, May 27, 2022, 3:00 PM
PM2,5 61 (Unhealthy)
NO2 22 (Good)
PM10 69 (Unhealthy for Sensitive Groups)
CO 219 (Good)
O3 0 (Good)
SO2 8 (Good)
Data on air pollution from recent days in Wanglong
index
2022-05-27
pm25
28
Moderate
no2
22
Good
pm10
35
Moderate
co
579
Good
o3
22
Good
so2
5
Good
data source »
Air pollution in Wanglong from October 2018 to May 2020

index
2020-05
2020-04
2020-03
2020-02
2020-01
2019-12
2019-11
2019-10
2019-09
2019-08
2019-07
2019-06
2019-05
2019-04
2019-03
2019-02
2019-01
2018-12
2018-11
2018-10
pm25
45 (Unhealthy for Sensitive Groups)
40 (Unhealthy for Sensitive Groups)
52 (Unhealthy for Sensitive Groups)
65 (Unhealthy)
99 (Very Unhealthy)
64 (Unhealthy)
67 (Unhealthy)
51 (Unhealthy for Sensitive Groups)
37 (Unhealthy for Sensitive Groups)
34 (Moderate)
40 (Unhealthy for Sensitive Groups)
42 (Unhealthy for Sensitive Groups)
41 (Unhealthy for Sensitive Groups)
53 (Unhealthy for Sensitive Groups)
60 (Unhealthy)
99 (Very Unhealthy)
112 (Very bad Hazardous)
73 (Unhealthy)
96 (Very Unhealthy)
55 (Unhealthy for Sensitive Groups)
co
1 (Good)
761 (Good)
1 (Good)
1 (Good)
2 (Good)
1 (Good)
1 (Good)
1 (Good)
1 (Good)
1 (Good)
1 (Good)
1 (Good)
956 (Good)
1 (Good)
1 (Good)
1 (Good)
2 (Good)
1 (Good)
1 (Good)
1 (Good)
no2
36 (Good)
42 (Moderate)
43 (Moderate)
35 (Good)
54 (Moderate)
51 (Moderate)
50 (Moderate)
38 (Good)
43 (Moderate)
31 (Good)
35 (Good)
42 (Moderate)
44 (Moderate)
40 (Good)
46 (Moderate)
49 (Moderate)
67 (Moderate)
55 (Moderate)
59 (Moderate)
50 (Moderate)
o3
158 (Unhealthy)
132 (Unhealthy for Sensitive Groups)
103 (Moderate)
87 (Moderate)
70 (Good)
57 (Good)
64 (Good)
102 (Moderate)
154 (Unhealthy)
157 (Unhealthy)
198 (Very Unhealthy)
205 (Very Unhealthy)
168 (Unhealthy)
132 (Unhealthy for Sensitive Groups)
117 (Moderate)
87 (Moderate)
55 (Good)
48 (Good)
69 (Good)
97 (Moderate)
pm10
116 (Very Unhealthy)
110 (Very Unhealthy)
121 (Very Unhealthy)
106 (Unhealthy)
155 (Very bad Hazardous)
139 (Very Unhealthy)
154 (Very bad Hazardous)
106 (Unhealthy)
82 (Unhealthy)
73 (Unhealthy for Sensitive Groups)
84 (Unhealthy)
99 (Unhealthy)
116 (Very Unhealthy)
127 (Very Unhealthy)
139 (Very Unhealthy)
162 (Very bad Hazardous)
207 (Very bad Hazardous)
162 (Very bad Hazardous)
208 (Very bad Hazardous)
133 (Very Unhealthy)
so2
16 (Good)
19 (Good)
21 (Good)
21 (Good)
33 (Good)
32 (Good)
26 (Good)
16 (Good)
16 (Good)
13 (Good)
18 (Good)
23 (Good)
27 (Good)
17 (Good)
29 (Good)
34 (Good)
69 (Moderate)
44 (Good)
47 (Good)
27 (Good)
data source »
白羊墅
Friday, May 27, 2022, 3:00 PM
PM2,5 61 (Unhealthy)
particulate matter (PM2.5) dust
NO2 22 (Good)
nitrogen dioxide (NO2)
PM10 69 (Unhealthy for Sensitive Groups)
particulate matter (PM10) suspended dust
CO 219 (Good)
carbon monoxide (CO)
O3 0.05 (Good)
ozone (O3)
SO2 7.7 (Good)
sulfur dioxide (SO2)
白羊墅
index
2022-05-27
pm25
28
no2
22
pm10
35
co
579
o3
22
so2
4.6
白羊墅
2018-10 2020-05
index
2020-05
2020-04
2020-03
2020-02
2020-01
2019-12
2019-11
2019-10
2019-09
2019-08
2019-07
2019-06
2019-05
2019-04
2019-03
2019-02
2019-01
2018-12
2018-11
2018-10
pm25
45
40
52
65
99
64
67
51
37
34
40
42
41
53
60
99
112
73
96
55
co
1
761
1
1
2
1
1
1
1
1
1
1
956
1
1
1
2
1
1
1
no2
36
42
43
35
54
51
50
38
43
31
35
42
44
40
46
49
67
55
59
50
o3
158
132
103
87
70
57
64
102
154
157
198
205
168
132
117
87
55
48
69
97
pm10
116
110
121
106
155
139
154
106
82
73
84
99
116
127
139
162
207
162
208
133
so2
16
19
21
21
33
32
26
16
16
13
18
23
27
17
29
34
69
44
47
27
* Pollution data source:
https://openaq.org
(ChinaAQIData)
The data is licensed under CC-By 4.0
PM2,5 61 (Unhealthy)
NO2 22 (Good)
PM10 69 (Unhealthy for Sensitive Groups)
CO 219 (Good)
O3 0 (Good)
SO2 8 (Good)
Data on air pollution from recent days in Wanglong
| index | 2022-05-27 |
|---|---|
| pm25 | 28 Moderate |
| no2 | 22 Good |
| pm10 | 35 Moderate |
| co | 579 Good |
| o3 | 22 Good |
| so2 | 5 Good |
| index | 2020-05 | 2020-04 | 2020-03 | 2020-02 | 2020-01 | 2019-12 | 2019-11 | 2019-10 | 2019-09 | 2019-08 | 2019-07 | 2019-06 | 2019-05 | 2019-04 | 2019-03 | 2019-02 | 2019-01 | 2018-12 | 2018-11 | 2018-10 |
|---|---|---|---|---|---|---|---|---|---|---|---|---|---|---|---|---|---|---|---|---|
| pm25 | 45 (Unhealthy for Sensitive Groups) | 40 (Unhealthy for Sensitive Groups) | 52 (Unhealthy for Sensitive Groups) | 65 (Unhealthy) | 99 (Very Unhealthy) | 64 (Unhealthy) | 67 (Unhealthy) | 51 (Unhealthy for Sensitive Groups) | 37 (Unhealthy for Sensitive Groups) | 34 (Moderate) | 40 (Unhealthy for Sensitive Groups) | 42 (Unhealthy for Sensitive Groups) | 41 (Unhealthy for Sensitive Groups) | 53 (Unhealthy for Sensitive Groups) | 60 (Unhealthy) | 99 (Very Unhealthy) | 112 (Very bad Hazardous) | 73 (Unhealthy) | 96 (Very Unhealthy) | 55 (Unhealthy for Sensitive Groups) |
| co | 1 (Good) | 761 (Good) | 1 (Good) | 1 (Good) | 2 (Good) | 1 (Good) | 1 (Good) | 1 (Good) | 1 (Good) | 1 (Good) | 1 (Good) | 1 (Good) | 956 (Good) | 1 (Good) | 1 (Good) | 1 (Good) | 2 (Good) | 1 (Good) | 1 (Good) | 1 (Good) |
| no2 | 36 (Good) | 42 (Moderate) | 43 (Moderate) | 35 (Good) | 54 (Moderate) | 51 (Moderate) | 50 (Moderate) | 38 (Good) | 43 (Moderate) | 31 (Good) | 35 (Good) | 42 (Moderate) | 44 (Moderate) | 40 (Good) | 46 (Moderate) | 49 (Moderate) | 67 (Moderate) | 55 (Moderate) | 59 (Moderate) | 50 (Moderate) |
| o3 | 158 (Unhealthy) | 132 (Unhealthy for Sensitive Groups) | 103 (Moderate) | 87 (Moderate) | 70 (Good) | 57 (Good) | 64 (Good) | 102 (Moderate) | 154 (Unhealthy) | 157 (Unhealthy) | 198 (Very Unhealthy) | 205 (Very Unhealthy) | 168 (Unhealthy) | 132 (Unhealthy for Sensitive Groups) | 117 (Moderate) | 87 (Moderate) | 55 (Good) | 48 (Good) | 69 (Good) | 97 (Moderate) |
| pm10 | 116 (Very Unhealthy) | 110 (Very Unhealthy) | 121 (Very Unhealthy) | 106 (Unhealthy) | 155 (Very bad Hazardous) | 139 (Very Unhealthy) | 154 (Very bad Hazardous) | 106 (Unhealthy) | 82 (Unhealthy) | 73 (Unhealthy for Sensitive Groups) | 84 (Unhealthy) | 99 (Unhealthy) | 116 (Very Unhealthy) | 127 (Very Unhealthy) | 139 (Very Unhealthy) | 162 (Very bad Hazardous) | 207 (Very bad Hazardous) | 162 (Very bad Hazardous) | 208 (Very bad Hazardous) | 133 (Very Unhealthy) |
| so2 | 16 (Good) | 19 (Good) | 21 (Good) | 21 (Good) | 33 (Good) | 32 (Good) | 26 (Good) | 16 (Good) | 16 (Good) | 13 (Good) | 18 (Good) | 23 (Good) | 27 (Good) | 17 (Good) | 29 (Good) | 34 (Good) | 69 (Moderate) | 44 (Good) | 47 (Good) | 27 (Good) |
PM2,5 61 (Unhealthy)
particulate matter (PM2.5) dustNO2 22 (Good)
nitrogen dioxide (NO2)PM10 69 (Unhealthy for Sensitive Groups)
particulate matter (PM10) suspended dustCO 219 (Good)
carbon monoxide (CO)O3 0.05 (Good)
ozone (O3)SO2 7.7 (Good)
sulfur dioxide (SO2)白羊墅
| index | 2022-05-27 |
|---|---|
| pm25 | 28 |
| no2 | 22 |
| pm10 | 35 |
| co | 579 |
| o3 | 22 |
| so2 | 4.6 |
白羊墅

| index | 2020-05 | 2020-04 | 2020-03 | 2020-02 | 2020-01 | 2019-12 | 2019-11 | 2019-10 | 2019-09 | 2019-08 | 2019-07 | 2019-06 | 2019-05 | 2019-04 | 2019-03 | 2019-02 | 2019-01 | 2018-12 | 2018-11 | 2018-10 |
|---|---|---|---|---|---|---|---|---|---|---|---|---|---|---|---|---|---|---|---|---|
| pm25 | 45 | 40 | 52 | 65 | 99 | 64 | 67 | 51 | 37 | 34 | 40 | 42 | 41 | 53 | 60 | 99 | 112 | 73 | 96 | 55 |
| co | 1 | 761 | 1 | 1 | 2 | 1 | 1 | 1 | 1 | 1 | 1 | 1 | 956 | 1 | 1 | 1 | 2 | 1 | 1 | 1 |
| no2 | 36 | 42 | 43 | 35 | 54 | 51 | 50 | 38 | 43 | 31 | 35 | 42 | 44 | 40 | 46 | 49 | 67 | 55 | 59 | 50 |
| o3 | 158 | 132 | 103 | 87 | 70 | 57 | 64 | 102 | 154 | 157 | 198 | 205 | 168 | 132 | 117 | 87 | 55 | 48 | 69 | 97 |
| pm10 | 116 | 110 | 121 | 106 | 155 | 139 | 154 | 106 | 82 | 73 | 84 | 99 | 116 | 127 | 139 | 162 | 207 | 162 | 208 | 133 |
| so2 | 16 | 19 | 21 | 21 | 33 | 32 | 26 | 16 | 16 | 13 | 18 | 23 | 27 | 17 | 29 | 34 | 69 | 44 | 47 | 27 |